Publisher’s version / Version de l'éditeur:
Scientific Reports, 7, 2017-11-16
READ THESE TERMS AND CONDITIONS CAREFULLY BEFORE USING THIS WEBSITE. https://nrc-publications.canada.ca/eng/copyright
Vous avez des questions? Nous pouvons vous aider. Pour communiquer directement avec un auteur, consultez la première page de la revue dans laquelle son article a été publié afin de trouver ses coordonnées. Si vous n’arrivez pas à les repérer, communiquez avec nous à PublicationsArchive-ArchivesPublications@nrc-cnrc.gc.ca.
Questions? Contact the NRC Publications Archive team at
PublicationsArchive-ArchivesPublications@nrc-cnrc.gc.ca. If you wish to email the authors directly, please see the first page of the publication for their contact information.
NRC Publications Archive
Archives des publications du CNRC
This publication could be one of several versions: author’s original, accepted manuscript or the publisher’s version. / La version de cette publication peut être l’une des suivantes : la version prépublication de l’auteur, la version acceptée du manuscrit ou la version de l’éditeur.
For the publisher’s version, please access the DOI link below./ Pour consulter la version de l’éditeur, utilisez le lien DOI ci-dessous.
https://doi.org/10.1038/s41598-017-11565-7
Access and use of this website and the material on it are subject to the Terms and Conditions set forth at
QTL mapping and molecular characterization of the classical D locus
controlling seed and flower color in Linum usitatissimum (flax)
Sudarshan, Gurudatt Pavagada; Kulkarni, Manoj; Akhov, Leonid; Ashe,
Paula; Shaterian, Hamid; Cloutier, Sylvie; Rowland, Gordon; Wei, Yangdou;
Selvaraj, Gopalan
https://publications-cnrc.canada.ca/fra/droits
L’accès à ce site Web et l’utilisation de son contenu sont assujettis aux conditions présentées dans le site LISEZ CES CONDITIONS ATTENTIVEMENT AVANT D’UTILISER CE SITE WEB.
NRC Publications Record / Notice d'Archives des publications de CNRC:
https://nrc-publications.canada.ca/eng/view/object/?id=d5dbe07c-fce3-4a79-a1d5-bc23f59666f9
https://publications-cnrc.canada.ca/fra/voir/objet/?id=d5dbe07c-fce3-4a79-a1d5-bc23f59666f9
www.nature.com/scientificreports
QTL mapping and molecular
characterization of the classical D
locus controlling seed and lower
color in Linum usitatissimum (lax)
Gurudatt Pavagada Sudarshan
,, Manoj Kulkarni , Leonid Akhov , Paula Ashe , Hamid
Shaterian , Sylvie Cloutier , Gordon Rowland , Yangdou Wei & Gopalan Selvaraj
The lowers of lax (linseed) are blue-hued, ephemeral and self-pollinating, and the seeds are typically brown. A century-old interest in natural yellow seed variants and a historical model point to recessive alleles in B1, D and G loci being responsible, but the functional aspects had remained unknown. Here, we characterized the “D” locus by quantitative trait loci (QTL) mapping and identiied a FLAVONOID
3′ ′ HYDROXYLASE (F3′ ′H) gene therein. It does not belong to the F ′ ′H clade, but resembles
biochemically characterized F ′Hs (lavonoid ′ hydroxylase) but without F ′H activity. The genome lacks other F3′H or F3′H-like genes. The apparent neo-functionalization from F ′H is associated with a Thr → Ser substitution in a substrate recognition site (SRS). The yellow seed and white lower phenotypes of the classical d mutation was found to be due to one nucleotide deletion that would truncate the deduced product and remove three of the six potential SRS, negatively impacting delphinidin synthesis. Delphinidin is sporadic in angiosperms, and lax has no known pollination syndrome(s) with functional pollinator group(s) that are attracted to blue lowers, raising questions on the acquisition of F ′ ′H. The appearance of d allele is suggestive of the beginning of the loss of F ′ ′H in this species.
Flax is the seed/iber crop among the eight founder crops in agriculture1. Archeological evidence indicates use
of lax ibers nearly 30,000 years ago2. Flax ofers the richest seed source of 18:3, ∆3–5 α-linolenic acid (ALA; ω–3
fatty acid). Oxidative polymerization of ALA renders lax oil its characteristic drying property that is capitalized upon in inks, varnishes and paints. ALA also has health-promoting properties that have made lax products popular nutritional supplements6. However, ALA-rich oil has poor shelf life; it becomes rancid and is unusable
as staple oil. In Australia and Canada, breeding eforts were undertaken to enable kitchen use of lax oil by genet-ically reducing the ALA content by incorporating mutations in fatty acid desaturation7,8. In Canada, the largest
exporter of lax seed in the world, it became mandatory to segregate low-ALA lax for trade purposes. Yellow seed color was adopted to distinguish low-ALA types from the mainstream high-ALA lax commodity which is brown-seeded. he subsequent lack of markets for low-ALA varieties triggered the de-registration of all low-ALA lax varieties in Canada. Consequently, the exclusive use of yellow seed color for low-ALA type has become unnecessary and yellow seed variety with high-ALA can now be produced. Yellow seeds are generally larger, and contain more protein and oil9,10. his is attributed to altered seed coat properties. he world’s germplasm
collec-tions comprise 4.3% yellow seed types9. hus, breeding yellow seed varieties for mainstream industrial purposes
has become an attractive proposition.
here has been a longstanding interest in the genetics of lax seed types11. hree loci (B1, D and G) when in
recessive state were postulated to result in yellow seed color11 and subsequently a dominant locus/allele (Y or Y1)
was also found3,12. All four loci were proven to be independently inherited13. Arabidopsis tt (transparent testa)
National Research Council of Canada, Gymnasium Place, Saskatoon, SK S N W , Canada. Agriculture and Agri-Food Canada, Carling Avenue, Ottawa, ON K A C , Canada. Crop Development Centre, Department of Plant Science, University of Saskatchewan, Agriculture Building, Campus Drive, Saskatoon, SK S N A , Canada. Department of Biology, University of Saskatchewan, Science Place, Saskatoon, SK S N E , Canada. Present address: Bayer CropScience, Crop Analytics Morrisville, TECHIII Davis Drive, Morrisville, NC, , USA. Correspondence and requests for materials should be addressed to G.S. (email: gopalan.selvaraj@nrc.ca)
Received: 2 June 2017 Accepted: 31 July 2017 Published: xx xx xxxx
www.nature.com/scientificreports/
mutants defective in PA biosynthesis have been studied extensively. Yellow seed color is a result of blocked biosyn-thesis of proanthocyanidins (PA; condensed tannins) that impart the brown color to the seed coat4,5,14,15. While
yellow lax seeds are desirable for their oil content, the lower PA content also ofers some advantages. he seed coat is not removed during oil extraction and thus the defatted lax seed meal, which is a protein-rich supplement in animal feed, contains PA that negatively afects protein digestion16. Low-PA meal is preferred in animal feed
supplements17,18. PA biosynthesis in lax has not been studied at the molecular level.
Despite the longstanding interest in lax seed and lower color, there have been no reports on the genes under-pinning the phenotypes. his work reveals the genetic, biochemical, molecular and evolutionary aspects of the formation of the classical blue lowers and brown seeds in lax; it shows how lax difers from model systems such as Arabidopsis, and raises some questions about the gain of the capacity to make delphinidin at the expense of cyanidin biosynthesis.
Results
The d mutant accumulates much less PA in the endothelium resulting in yellow seed color.
CDC Bethune (B1B1, DD, GG genotype)19 has brown seeds and blue petals, as most of the global lax
acces-sions do, whereas G1186/94 (B1B1, dd, GG)13 has yellow seeds and white petals (Fig. 1). As elucidation of the
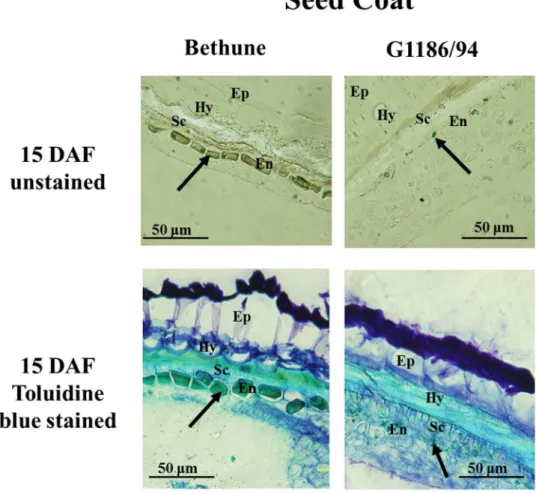
molecular basis of the d allele and its impact on seed color was a major objective of this study, our initial work concerned seed analysis for PA accumulation. Comparative phytochemistry of developing seeds of CDC Bethune indicated that seeds began accumulating PA at 6 days ater lowering (DAF) (L. Akhov, unpublished). As shown in Fig. 2, the endothelium in the toluidine blue-stained sections of seeds of 15 DAF showed diferences in the two genotypes. Endothelial cells of G1186/94 were smaller in size as compared to CDC Bethune, indicating per-turbed development of this seed coat layer. he unstained sections, the endothelium in CDC Bethune but not in G1186/94 was brown, which we attribute to PA accumulation.
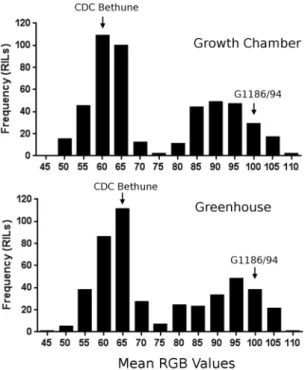
Seed color was quantitatively evaluated in the red (R), green (G) and blue (B) spectrum through scanning. he brown seeds of CDC Bethune had an RGB value of 56.7 ± 0.4 whereas the yellow seeds of G1186/94 had a value of 99.3 ± 3.0 when the lines had been grown under controlled conditions in a growth cabinet. he values in a somewhat more variable greenhouse environment were also distinct for the brown and yellow seeds: 63.5 ± 4.5
Figure 1. Seed and lower color phenotypes of CDC Bethune (a representative of the wild type; brown seed and
www.nature.com/scientificreports/
for CDC Bethune and 99.7 ± 3.1 for G1186/94. he correlation between the two environments was 91.7%. he F8:9 and F9:10 recombinant inbred lines (RIL) derived from these parents showed a bimodal distribution of the
phenotypes (Fig. 3), indicative of a single major locus, in agreement with Mittapalli and Rowland13 who observed
a 3:1 brown to yellow ratio in F2-derived seeds of three G1186/94 (female) by brown seeded lines (male) crosses.
Mapping the d allele indicates the presence a putative FLAVONOID 3′ HYDROXYLASE (F3′H)
gene of CYP B type.
A genetic map of the CDC Bethune x G1186/94 RIL population based on SSR mark-ers spanning all 15 linkage groups (LGs) of lax was constructed. Initially, 47 brown and 47 yellow seed recom-binant inbred lines were mapped with SSR markers (Supp. Table S1). his resulted in a framework genetic map comprising 83 markers spanning a total genetic distance of 467.8 cM and 19 LG (Supp. Fig. S1). LG1 named here corresponds to LG2 of the published integrated genetic and physical map of lax20,21 and it harbours the D locusbased on the QTL analysis for seed color. Additional markers were developed in the interval to ine-map the QTL and markers explaining the 84 to 89% of the phenotypic variance were identiied (Fig. 4).
he SSR markers Lu209 and Lu125 that were initially found to be linked to the d allele were derived from
ESTs22. The SSR in Lu209 corresponds to two nested ESTs of otherwise identical sequences: Accession No.
JG040203.1; JG047082.122,23. A BLAST query (e-10) of the lax reference genome sequence24 located the ESTs
on Scafold 208 which is 830.6 Kbp. All subsequent markers for ine-mapping were derived from this scafold sequence by in silico scanning for potential SSRs. Of the 52 potential SSR markers identiied 8 were experi-mentally found to be polymorphic between CDC Bethune and G1186/94 (Supp. Table S1). In addition, map-ping Illumina short reads from the re-sequencing of G1186/94 identiied SNPs from which one CAPS marker was developed. Mapping these 9 markers on the RIL population helped identify the terminal 53.5-kb region of Scafold 208 as the region of interest in the D locus to ind the d allele (Fig. 4).
Scafold 208 sequence was subjected to FGENESH prediction with Hevea for gene model25, and predicted
amino acid sequences were used for BLAST against the TAIR database. A total of 236 genes were predicted (Supp. Table S2). he 53.5 Kb region of Scafold 208 where the D locus had been mapped has 14 candidate genes (Supp.
Figure 2. Deiciency in pigment accumulation in the seed coat of G1186/94 (yellow seed) in contrast to
CDC Bethune (brown seeds) as shown in cross sections of seeds at 15 days ater lowering (DAF). he two upper panels are unstained sections, and the two bottom panels are sections stained with toluidine blue. he dark coloration in both the unstained and stained CDC Bethune endothelium is indicative of the presence of proanthocyanidins (PA) as indicated by the arrows. he corresponding cell layer in G1186/94, which is deicient in PA accumulation, is also indicated by arrows. (Ep- epidermis, Hy- hypodermis, Sc-sclerenchyma layer, En- endothelium).
www.nature.com/scientificreports/
Table S3). One of these is annotated as a putative F3′H gene between 7127–9095 bp of the scafold (Lus10021620
in the lax genome; https://phytozome.jgi.doe.gov/pz/portal.html#!info?alias=Org_Lusitatissimum). he
pre-dicted gene has three exonic regions that code for 521 amino acids that have 61.7% identity with the deduced F3′H polypeptide of the Arabidopsis TRANSPARENT TESTA 7 (TT7) gene (AT5G07990.1) over the entire length.
he latter is a CYP75B subfamily type in the CYP71 clan of cytochrome P450 monooxygenases26.
Phytochemistry indicates absence of F ′H activity in lax and instead reveals ′ ′
hydroxyla-tion that is defective in G
/ in seeds and petals.
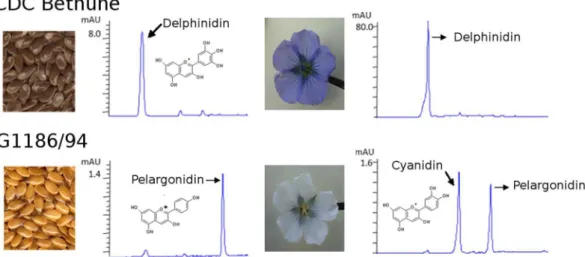
Polymerized PA is generally recalcitrant to compositional analysis. Acidiied butanol extraction is a commonly used method to analyze the polylavan struc-ture ater partial de-polymerization27. As a result of this extraction, lavans are transformed into correspondinganthocyanidins. he subsequent anthocyanidins serve to deduce the B-ring hydroxylation pattern(s) in PA. Our analyses showed that the seed coats of CDC Bethune contained delphinidin (3′4′5′ hydroxylated) and only trace levels of cyanidin (4′5′ hydroxylated). G1186/94 seed coat extracts contained very low levels of pelargonidin (4′ hydroxylated) but not delphinidin, indicating defective 3′5′ hydroxylation (Fig. 5). he trace level of cyanidin in
G1186/94 was comparable to that in CDC Bethune. hus, gallocatechin (3′4′5′ trihydroxy lavan-3-ol) in CDC Bethune and afzelechin (4′hydroxy lavan-3-ol) in G1186/94 are the main components of seed coat PA.
CDC Bethune petals (blue) had delphinidin whereas G1186/94 lowers (white) did not. he latter contained very low amounts of pelargonidin that was not detected in seeds and petals of CDC Bethune. he lower levels of pelargonidin in G1186/94, relative to the delphinidin content in CDC Bethune derived from dihydromyri-cetin (3′,4′,5′ hydroxylated), suggest that the next step in the pathway ater B-ring hydroxylation mediated by dihydrolavonol-4 reductase (DFR) is less eicient in accepting dihydrokaempferol (4-hydroxylated). he lack of delphinidin anthocyanins in G1186/94 explains the white petal phenotype. he smaller amounts of afzelechin based PA in G1186/94 might not be suicient to impart a brown seed phenotype.
he F8:9 RIL population comprising 479 lines showed that all brown-seeded lines (280) had blue petals and all
yellow-seeded lines (199) had white petals. We then phytochemically analyzed a random subset of 67 blue-petal lines and 33 white-petal RILs. he chemotypic characteristics of all blue-petal lines were like the above-noted CDC Bethune type and that of all white-petal lines were like G1186/94. hese results collectively showed that while the best candidate gene in the D locus was a putative F3′H gene, the biochemical defect in d mutant was in 3′5′hydroxylation and consequently the gene was presumed to encode a 3′5′ hydroxylase. F3′5′H directs the lavonoid pathway to the delphinidin branch and mutations afecting expression of the F3′5′H gene impact del-phinidin synthesis28,29.
Downregulation of the putative FLAVONOID ′ ′ HYDROXYLASE in G
/ seeds and
pet-als supports the chemotypic deviation from CDC Bethune.
he predicted coding sequence from Scafold 208 as a query against all ESTs of Linum in Genbank identiied only six short-sequence ESTs amongFigure 3. Phenotypic distribution of seed color in G1186/94 X CDC Bethune recombinant inbred line (RIL)
population grown in two diferent environments (a controlled growth cabinet and a less controlled greenhouse). Brown seeds (e.g. CDC Bethune) had a lower mean RGB value of <70 whereas yellow seeds (e.g. G1186/94) had a value of >80. he parental lines indicated by arrows had the phenotypes shown in Fig. 1.Transgressive segregants for both darker brown and brighter yellow were evident in both environments.
www.nature.com/scientificreports/
the 286,900 entries in the database. All these six ESTs were from CDC Bethune23: One from seed coat tissue
corresponding to torpedo stage embryo; two from lower tissues and three from endosperm tissue. One of these 6 ESTs (286 bp) represented the 5′ end; the other 5 were at the 3′ end, four of them were shorter and nested under the longest sequence of 404 bp with 100% identity (Supp. Fig. S2). We performed quantitative gene expression analysis (qRT-PCR) of seed coat tissue and lower petals in CDC Bethune and G1186/94. CDC Bethune had ~20-fold higher expression in petals and ~25-fold higher expression in seed coat tissue relative to the expression levels in G1186/94 (Fig. 6). he results established that the diminished expression of the putative FLAVONOID 3′5′HYDROXYLASE gene in d allele in G1186/94 impacted both seed and petal color.
Loss of lavonoid ′ ′hydroxylase function in G
/ is due to a premature translational
stop mutation in a gene resembling F3′H.
Re-sequencing the six ESTs fully showed that these clones contained only the short sequences reported in Genbank. Full-length genomic sequences from CDC Bethune and G1186/94 were retrieved by PCR with forward and reverse primers designed from the sequences of the ESTs JG242995.1 and JG079443.1, respectively. PCR errors were ruled out by ive replicates of PCR. he 1969-bpsequence encompassing exons and introns were identical in CDC Bethune and G1186/94 (Fig. 7) except for a
single nucleotide deletion in the second exon of G1186/94 (Supp Fig. S3). his deletion would create an in-frame
Figure 4. Fine mapping of the D locus in LG2. Recessive mutation d imparts both yellow seed and white petal
color. QTL location between Lu2351 and LuM566 in recombinant inbred line population of G1186/94 x CDC
Bethune grown in two environments is shown: GC, controlled growth cabinet (LOD 47.1 and R2 0.89); GH,
greenhouse (LOD 39.1 and R2 0.84). he genetic location of some markers are not shown in the igure to avoid
crowding the depiction, but it is indicated in parentheses, preceding the physical location corresponding to the nucleotide sequence of Scafold 20824: LuM566 (12.9), 53.5 kb; LuM568 (12.9), 58.5 kb; LuM569 (12.9), 58.6 kb;.
LuM588 (14.5), 141.2 kb; LuM592 (14.5), 152.5 kb; LuM193 (14.5), 155.1 kb; LuM595 (14.5), 155.6 kb; LuM597 (14.5), 159.9 kb; Lu209 (14.5), 184.1 kb; LuM71 (15.4), 423.5 kb; LuCAPS_110, 447.7 kb. he primer information for the LuM SSR markers is provided in Supp. Table S1. LuCAPS_110 is a CAPS marker that is described in Methods. (cM = centimorgans).
www.nature.com/scientificreports/
stop codon prematurely terminating the polypeptide ater 278 amino acids in G1186/94, whereas the open read-ing frame in CDC Bethune would encode a polypeptide of 521 amino acids (Supp. Fig. S4). Notably, a subsequent re-sequencing of Avantgard, the donor of the d allele in G1186/94, also conirmed the occurrence this single nucleotide deletion (Supp. Fig. S5).
The F3′ ′H gene is a later acquisition of dual hydroxylation function from F3′H.
he biochemi-cal defect seen in vivo being a loss of F3′5′H rather than F3′H activity was resolved from sequence analysis. heFigure 5. Qualitative and quantitative diferences in the lavonoids from seeds and petals of CD Bethune and
G1186/94 as shown by HPLC proiles of acidiied butanol extracts. Note the compressed scale for CDC Bethune and expanded scale for G1186/94. CDC Bethune lowers also contained a similar amount of cyanidin as in G1186/94 lowers.
Figure 6. Lower expression of F3′5′H gene in G1186/94 as identiied from qRT-PCR analysis of transcripts in
seed coat (15 days ater lowering) and petals (lower buds at anthesis before opening). EF1α was used as the common internal control reference gene24. Higher level of expression in CDC Bethune relative to G1186/94 is
shown.
Figure 7. Depiction of F3′5′H gene in CDC Bethune and G1186/94. Exons are shown as illed boxes and
introns as open boxes. he number of nucleotides in each of these is as indicated. he asterisk denotes a premature stop codon created due to a single nucleotide deletion in G1186/94. Further details are in Supplementary Figures 3 and 4. he sequence between ATG and TGA shown in the igure was ampliied with suitable primers highlighted in Supplementary Figure 3. An alignment of CDC Bethune and G1186/94 amplicon sequences is shown in Supplementary Figure 4.
www.nature.com/scientificreports/
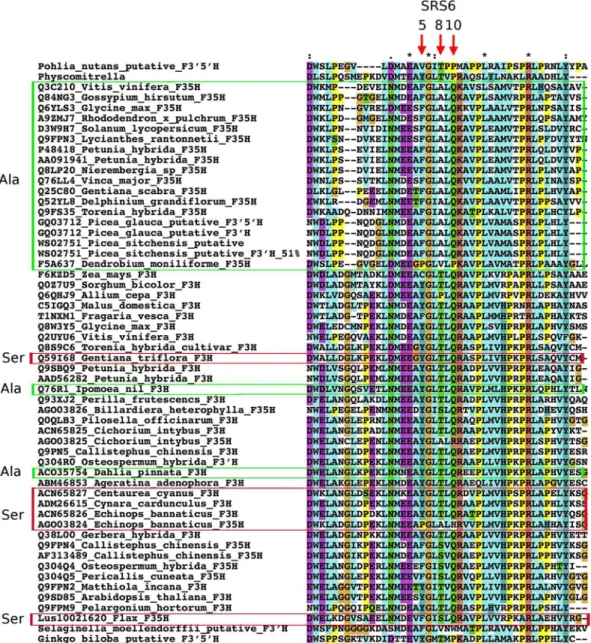
lax F3′5′H (521 amino acids) is 64% identical over 97% of its sequence to the biochemically characterized grape F3′H (BAE470005.1; ALP48438.1 and NP_001267916.1). In a phylogenetic analysis using the Neighbour-Joining method, it did not cluster with classical F3′5′H enzymes but instead grouped with the F3′H clade. To avoid any uncertainty of enzymatic function from tentative annotations of sequences in databases, we repeated the analyses with only biochemically characterized F3′H and F3′5′H and these indicated clearly that the lax sequence is more related to F3′H than to F3′5′H (Fig. 8). Taking the grape F3′H amino acid sequence as a reference, the lax F3′5′H sequence has at its 498th amino acid position (487 in grape) a serine (Ser) residue instead of a threonine (hr).
Earlier research30–32 reported that such a substitution in Gerbera hybrida converts F3′H to F3′5′H and, the reverse
of it in Osteospermum hybrida F3′5′H makes it an F3′H enzyme. Not only does replacement of hr with Ser make this phenomenal switch but also Ala at this position is associated with 3′5′ hydroxylation function (Fig. 9)33. In
addition to the lax F3′5′H, only four other F3′5′H that bear more structural resemblance to F3′H have been identiied to date32. hree are in Asteraceae and one from Pittosporaceae (Fig. 9). hese independently derived,
neo-functionalized enzymes represent those appearing late in evolution.
Discussion
CDC Bethune provides a typical example for the preponderance of blue lower and brown seed types in global lax accessions13. G1186/94 represents an ancient naturally occurring variant whose seed is yellow and lower petals
are white13. In a classical study of yellow seed variants, an un-mutated form of the genetic factor D has been shown
to make lowers lilac and also to intensify the color whereas the recessive d version renders lowers pale/pink11.
he binary chemotypic distinction of the brown-seed, blue-lower lines from the yellow-seed, white-lower lines
Figure 8. Location of the lax F3′5 H (marked with an asterisk) in the F3′H clade. he unrooted phylogenetic
tree was constructed as described in Methods. he accessions are from BRENDA (http://www.brenda-enzymes.
org), Seitz et al.31,32 and NCBI. he species names and the entries are as in Fig. 9. he enzymatic function is
known for all entries except those from Ginkgo biloba, Picea glauca, Physcomitrella patens, Pohlia nutans, Selaginella moellendorii.
www.nature.com/scientificreports/
among the stable single-seed descendants of genetic crosses between CDC Bethune and G1186/94 establishes a common genetic event underlying the phenotypic contrast. We have mapped the major QTL associated with seed and lower color and have delineated the molecular characteristic of the d allele. We have shown that the d allele carries a single nucleotide deletion in the F3′5′H gene causing a frameshit and premature termination, resulting in yellow seeds and white lowers. Prior modeling studies had identiied six potential substrate recognition sites (SRS) in P450 monooxygenases34,35. he premature termination codon in the d allele would remove SRS 4, 5 and 6
in the gene product. he 20- to 25-fold lower level of transcripts in G1186/94 might be due to nonsense-mediated decay (NMD) of transcripts, as seen in an Ipomea purpurea mutant where the deduced polypeptide of F3′H is truncated by 241 amino acids due to a premature stop codon36.
he FLAVONOID 3′5′ HYDROXYLASE gene itself is a recent acquisition in the evolution of lowering plants, where the capacity to perform dual hydroxylation (3′5′-hydroxylation) on the lavonoid B-ring has arisen by a seemingly conservative substitution of hr to Ser while simultaneously losing the ability for 3′-hydroxylation. he phylogenetic relationships clearly establish a closer association to the F3′H clade than to F3′5′H clade. Only trace levels of cyanidin were found in G1186/94, and these were not higher in CDC Bethune despite the presence of an intact F3′5′H gene in the latter. We found in the lax genome24 neither an additional F3′H-like nor an F3′5′H-like
gene in BLAST analyses (M. Kulkarni, unpublished). his indicates the incapability of the lax lavonoid 3′5′
Figure 9. Alignment of putative F3′H and F3′5′H amino acid sequences with marked region for substrate
recognition site (SRS6). he accessions are from BRENDA (http://www.brenda-enzymes.org), Seitz et al.31,32 and
NCBI. he positions 5, 8 and 10 within SRS6 are indicated by arrows. Notable for substrate speciicity is position 831,32. he accessions where a Ser (S) is present at this site instead of hr (T) are boxed in red; Ala (A) substituted
sequences are boxed in green. hese boxed proteins are F3′5′H whereas others are F3′H. “Lus10021620_Flax_ F35H” boxed in red is the lax D locus gene product that has a Ser substitution at position 8.
www.nature.com/scientificreports/
hydroxylase for 3′ monohydroxylation alone to any signiicant extent. Seeds and petals as contrasting tissue types that generally synthesize lavonoids show very little cyanidin, and these small amounts present in the seeds and lowers is not due to a bona ide F3′H gene. We surmise that it is due to “metabolic noise” due to substrate
prom-iscuity of some P450 enzymes37. For instance, metabolomic analyses have documented the presence of some
substances in Arabidopsis for which no established biosynthetic routes exist or can be predicted from the genome sequence38.
Since lower plants contain 3′ and 3′5′ hydroxylated flavonoids, it is believed that the two hydroxylases
diverged early in the evolution39. However, F3′H appears to be more extant than F3′5′H as evidenced by the
scant appearance of the latter in plant taxa. he few examples of active F3′5′H hydroxylase genes in plant spe-cies include Vitis, Petunia, Vinca, Gentiana, Solanum, Cichorium intybus, Echinops bannaticus, Pericallis cruenta, Osteospermum, and Callistephus32. Many other ornamental species like rose, gerbera, lily, chrysanthemum and
the fully sequenced model plant Arabidopsis lack F3′5′H40. Loss of F3′5′H due to spontaneous mutations is also
evident in otherwise blue-lowered plants41,42. Assuming that F3′5′H has been lost many times31,32,43,44, sporadic
re-appearance of it is intriguing.
The appearance of the flax F3′5′H gene within the F3′H clade suggests the presence of an F3′H gene in the ancestry of lax. How did lax F3′5′H arise? If it was by gene duplication, the genome should have another F3′H-like gene which is not the case; hence, suggesting neo-functionalization of a single copy gene at the expense of F3′H activity. Gene duplications relieve adaptive conlicts. Two models have been proposed: escape from adap-tive conlict (EAC)45 and invention-ampliication-diversiication (IAD)46. he former postulates that duplication
provides a mean to address adaptive conlict if an old function is compromised by a new function. he IAD model holds that some ancestral enzymes are as good as modern enzymes. Considering that lax F3′5′H is a modern enzyme, it is as good as the old enzyme of the classical F3′5′H clade in terms of delphinidin production. Note that EAC appears to apply to duplications of DFR genes whose function follows immediately ater F3′H and F3′5′H
in the lavonoid biosynthesis pathway47. he lax genome has two DFR genes that we have cloned (M. Kulkarni,
unpublished). However, there is no gene duplication of F3′H/F3′5′H in lax despite the loss of the presumed ancestral F3′H activity suggesting that there was either no conlict from losing an antecedent F3′H function or that duplication occurred but was followed by subsequent gene loss that was not detrimental. he latter seems unlikely given the recent appearance of F3′H-like F3′5′H in lax.
F3′5′H is generally attributed to blue-hued lowers although blue color is not exclusively due to delphinidin
anthocyanins44. he three F3′5′H enzymes of Asteraceae and the one from Pittosporaceae that arose from F3′H
are considered to have aforded a selective advantage31,32. Why did lax (or its ancestor) gain F3′5′H at the expense
of F3′H? Flower traits are shaped by pollination syndromes that encompass enticing loral characteristics and the predominant group(s) of pollinators48. White lowers for example tend to be self-pollinated whereas blue lowers
attract bees and red lowers have more bird visits43,49. he literature indicates that delphinidin-based
anthocya-nins aforded on blue-hued lowers a pollination advantage by helping attract insects and that white lowers have become increasingly self-pollinating50. L. usitatissimum is a highly self-pollinating plant, and its lower is very
short-lived, oten lasting less than a day. hus, there is no overt need in lax to have a blue lower with delphini-din. L. bienne, which is considered a progenitor of L. usitatissimum51, is also homostylous, suggesting an innate
capacity for self-pollination even though bees and wasps visit its lowers. Keeping in mind the ancestry of lax is still unclear and that many Linum species are heterostylous that necessitates cross-pollination, the acquisition of F3′5′H in lax might pre-date the immediate ancestors. Its retention in lax suggests neutrality. Alternatively, the loss of it in the d allele might indicate the beginning of the loss of this function.
Methods
Plant materials.
CDC Bethune (brown-seeded) is described in Rowland et al.19 G1186/94 (yellow-seeded)derived from Avantgard is from the lax breeding program of Prof. Dr. Wolfgang Friedt, University of Giessen,
Germany13. Recombinant inbred lines (RILs) developed from a reciprocal cross between the parents were used
for linkage mapping. he F8:9 seeds from RILs grown in a growth chamber (GC) were phenotyped for seed color.
DNA extracted from single F8:9 grown in pots in a greenhouse (GH) was used for genotyping and the resultant
F9:10 seeds were phenotyped for color.
Microscopy.
Seed samples were collected from lax capsules at several time points, deined as days ater low-ering (DAF), to represent important seed coat development stages. Tissue ixation, embedding and sectioning were performed as previously described52. Sections were stained with Toluidine-O-Blue 0.025% in aqueoussolu-tion. Seed development stages were followed as described23. Sections were observed and photographed using a
Zeiss Axioplan (Germany) microscope. Pictures were taken with AxioVision4.7 sotware (Zeiss, Germany).
Seed color measurement.
For phenotyping, the RIL population of 479 lines of F8:9 seeds (GC) and 463lines of F9:10 seeds (GH) were used. Flat bottom 96 Well MicrotestTM 96 well plates (BD Biosciences) were used
to screen 8 seeds of each RIL as well as parental seeds. Seeds were scanned using an EPSON scanner (Expression 1680) at the 400 dpi pixel intensity using Silverfast (AiV6.22r4) sotware. Red = 129, Green = 125, Blue = 121,
Luminosity = 126 and color value was set at 125 in Adobe PhotoshopR (Elements 9) sotware to normalize the
red, green and blue (RGB) values. Color intensity of seed surface areas was measured using ImageJ sotware53.
he average RGB value of these 8 seeds was used to represent seed color. Yellow seeds had higher RGB values than brown seeds.
SSR marker development and genotyping.
Simple sequence repeat (SSR) markers weredevel-oped by surveying lax genomic sequences using ‘WebSat’ sotware54. Details of these markers are provided
www.nature.com/scientificreports/
PCR ampliication had on their 5′ side an M13 sequence to enable luorescence detection and multiplexing
(CACGACGTTGTAAAACGAC). SSR ampliication and detection was performed as described earlier55.
Development of CAPS (Cleaved Ampliied Polymorphic Sequences) markers.
Single nucleotidepolymorphisms (SNPs) were identiied from the alignment of Illumina short reads of G1186/9456 to the DNA
sequence of scafold 208 that was obtained from the whole genome assembly of CDC Bethune24. Putative SNPs
between CDC Bethune and G1186/94 were detected in silico (CLC Genomics Workbench 6 sotware; www.clcbio.
com). A SNP was considered putative when present in at least two reads. Such putative SNP targets were subjected to in silico restriction digests for all commercially available enzymes; among these, the ones with high read-counts in the assembly file were identified as putative CAPS. LuCAPS_110 was amplified using LuCAPS_110_F (CCTTTATCTCTGCCTCTTCTCC) and LuCAPS_110_R (ACAACCCCAACACAATCTCG) and was digested with HaeIII. Wild type (CDC Bethune type) produced a unique ~500 bp amplicon whereas HaeIII restricted the yellow type amplicon into two fragments of ~290 and 220 bp.
Genetic analyses.
Segregation ratio for d mutation was assessed using chi-square analysis (Yate’s correction applied) considering an expected 1:1 segregation ratio for yellow: brown seed color in the advanced RIL popu-lation13. It is assumed that there was no operator bias while advancing RIL population using single seed descentmethod. Linkage analysis was performed using a minimum LOD 3.0 threshold and a maximum recombination fraction of 4055. LOD threshold was determined by 1000 permutations at P < 0.0557. QTL analysis was performed
using phenotypic-genotypic data in QTL Cartographer v2.5. he composite interval mapping (CIM) method was used (Kosambi function, walk speed 1 cM and ‘forward and backward regression’ method for co-factors, standard model 6 forward and backward regression). QTL identiication and percent contribution to the phenotypic vari-ance (R2) were obtained through this analysis.
F3′H (F3′ ′H) gene expression analysis using qRT-PCR.
RNA was extracted from lax seed coat at 15DAF and from petal tissues of CDC Bethune and G1186/94 using a method adapted from Meisel et al.58. cDNA
synthesis was performed using AinityScript
™
QPCR cDNA synthesis kit (Agilent Technologies, Santa Clara,CA). F3′5′H speciic target region primers were used to amplify the third exonic region of the putative gene with an expected amplicon length of 158 bp with the forward primer F3′5′H_q_F (AGCTGATGACGGCTGTTCTT) and the reverse primer F3′5′H_q_R (ATAAACATGCTCCGCCAATC). Elongation factor 1α (EF1α) was used as internal control with forward primer α_F1qEF (TTGGATACAACCCCGACAAAA) and reverse primer α_
R1qEF (GGGCCCTTGTACCAGTCAAG)59. A 50 µl qRT-PCR reaction had 25 µl SYBR GreenER master mix
(@2X), 2 µl cDNA, 1 µl each forward and reverse primers (10 pM stock concentration) and 20 µl double-deionized water. he qRT-PCR reactions were initiated with incubation at 95 °C for 10 min followed by a standard two-step protocol of 95 °C for 15 s; 58 °C for 60 s for a total of 40 cycles. Melting curve analyses beginning with an incuba-tion of 1 min at 60 °C with a gradual increase in temperature of 0.3 °C/15 s to 95 °C for 15 s were performed at the
end. qRT-PCR reactions were conducted using a StepOnePlusTM Real Time PCR system and data was collected
using StepOne v2.1 sotware (Applied Biosystems). Gene expression changes were calculated using the 2−∆∆C
T
method60 for both seed coat and lower petal samples.
Cloning of full-length F3′ ′H gene from lax.
Genomic DNA was extracted from CDC Bethune and G1186/94 leaves using the CTAB method and the full-length genomic region of the FLAVONOID 3′5′ HYDROXYLASE (F3′5′H) gene was ampliied using PCR primers: 5′-GCGGATCCGATGTCTACGTCGACGGCCAT-3′ (sense, the XbaI site is underlined) and 5′-GCGAATTCACTGGTGGCTTGGTTGGTTCC-3′ (antisense, the EcoRI site is underlined), gel puriied and cloned into TA cloning vector (hermoFisher Scientiic, Waltham, MA).Amino acid alignment and phylogenetic tree construction.
Amino acid sequences of F3′H and F3′5′H were taken from BRENDA (http://www.brenda-enzymes.org), Seitz et al.31,32 and NCBI. Sequences werealigned using the complete alignment option (allowing gapped alignment) of Clustal2X (https://sif.info-ufr.
univ-montp2.fr/?q=content/clustal2x). his alignment was used to identify conserved domains and to check amino acid divergence at position 5, 8 and 10 of the substrate recognition site 6 (SRS 6) at the C-terminal region of the proteins32. he phylogenetic tree was constructed using “One Click” mode of the phylogeny PhyML
appli-cation (www.phylogeny.lirmm.fr/phylo_cgi/simple_phylogeny.cgi) and the tree was visualized using TreeDyn
(www.phylogeny.fr).
Phytochemistry.
Analyses of phenolic compounds were performed as described before61. Briely, all analyseswere done in triplicate; lavonoids were extracted from lyophilized seed tissue samples with aqueous (70%) acetone (plant matter: solvent ration 1:5 w/v). Total PA content in catechin equivalent was measured using a dimethylami-nocinnamaldehyde (DMACA) assay62. Hydrolysis of lavonoid glycosides were done with 2 N HCl for 1 h at 95 °C.
Resultant aglycones were extracted with ethyl acetate and subjected to HPLC analysis. Concentration of bound PA was established using butanol-HCl (5%) assay27 and expressed as delphinidin or pelargonidin equivalents.
References
1. Allaby, R. G., Peterson, G. W., Merriwether, D. A. & Fu, Y. B. Evidence of the domestication history of lax (Linum usitatissimum L.) from genetic diversity of the sad2 locus. heor Appl Genet. 112, 58–65, doi:10.1007/s00122-005-0103-3 (2005).
2. Kvavadze, E. et al. 30,000-year-old wild lax ibers. Science 325, 1359, doi:10.1126/science.1175404 (2009).
3. Green, A. G. & Dribnenki, J. C. P. Breeding and development of LINOLA (low-linolenic flax). In The Third Meeting of the International Flax Breeding Group. 144–150 (1995).
4. Shirley, B. W. et al. Analysis of Arabidopsis mutants deicient in lavonoid biosynthesis. he Plant Journal 8, 659–671, doi:10.1046/ j.1365-313X.1995.08050659.x (1995).
www.nature.com/scientificreports/
5. Xu, W., Dubos, C. & Lepiniec, L. Transcriptional control of lavonoid biosynthesis by MYB–bHLH–WDR complexes. Trends in Plant Science 20, 176–185, doi:10.1016/j.tplants.2014.12.001 (2015).
6. Touré, A. & Xueming, X. Flaxseed lignans: source, biosynthesis, metabolism, antioxidant activity, bio-active components, and health beneits. Comprehensive Reviews in Food Science and Food Safety 9, 261–269, doi:10.1111/j.1541-4337.2009.00105.x (2010). 7. Green, A. G. A mutant genotype of lax (Linum usitatissimum L.) containing very low level of linolenic acid in its seed oil. Canadian
Journal of Plant Science 66, 499–503, doi:10.4141/cjps86-068 (1986).
8. Rowland, G. G. An EMS-induced low-linolenic-acid mutant in McGregor lax (Linum usitatissimum L.). Canadian Journal of Plant Science 71, 393–396, doi:10.4141/cjps91-054 (1991).
9. Diederichsen, A., Raney, J. P. & Duguid, S. D. Variation of mucilage in lax seed and its relationship with other seed characters. Crop Science 46, 365–371, doi:10.2135/cropsci2005.0146 (2006).
10. Khan, N. A., Booker, H. & Yu, P. Molecular structures and metabolic characteristics of protein in brown and yellow laxseed with altered nutrient traits. Journal of Agricultural and Food Chemistry 62, 6556–6564, doi:10.1021/jf501284a (2014).
11. Tammes, T. Genetic analysis, schemes of co-operation and multiple allelomorphs of Linum usitatissimum. Journal of Genetics 12, 19–46, doi:10.1007/bf02983072 (1922).
12. Popescu, F. & Marinescu, I. Y1-a dominant gene determining yellow seed color in linseed. Probleme de Genetica Teoretica si Aplicata (Romania) 28, 99–106 h tt p: // ag ri s. fa o. or g/ ag ri s- se ar ch /s ea rc h. do ;j se ss io ni d= AC C9 E2 E0 AD 03 5F ED DF D7 76 8E F9 A1 8F C6 ?r eq ue-st _l oc ale=es&recordID=RO1998000073&sourceQuery=&query=&sortField=&sortOrder=&agrovocString=&advQuery=&ce nterString=&enableField=(1996).
1 3. Mittapalli, O. & Rowland, G. Inheritance of seed color in lax. Crop Science 43, 1945–1951, doi:10.2135/cropsci2003.1945 (2003). 14. Winkel-Shirley, B. Flavonoid biosynthesis. A colorful model for genetics, biochemistry, cell biology, and biotechnology. Plant
Physiology 126, 485–493, doi:10.1104/pp.126.2.485 (2001).
15. Lepiniec, L. et al. Genetics and biochemistry of seed lavonoids. Annual Review of Plant Biology 57, 405–430, doi:10.1146/annurev. arplant.57.032905.105252 (2006).
16. Mole, S. & Waterman, P. G. Tannic acid and proteolytic enzymes: Enzyme inhibition or substrate deprivation? Phytochemistry 26, 99–102, doi:10.1016/S0031-9422(00)81490-9 (1986).
17. Oomah, B. D., Kenaschuk, E. O. & Mazza, G. Phenolic acids in laxseed. Journal of Agricultural and Food Chemistry 43, 2016–2019
http://pubs.acs.org/doi/pdf/10.1021/jf00056a011 (1995).
18. Oomah, B. D., Mazza, G. & Kenaschuk, E. O. Flavonoid content of laxseed. Inluence of cultivar and environment. Euphytica 90, 163–167, doi:10.1007/BF00023854 (1996).
19. Rowland, G. G., Hormis, Y. A. & Rashid, K. Y. CDC Bethune lax. Canadian Journal of Plant Science 82, 101–102, doi: 10.4141/p01-066 (2002).
20. Cloutier, S. et al. Integrated consensus genetic and physical maps of lax (Linum usitatissimum L.). heoretical and Applied Genetics
125, 1783–1795, doi:10.1007/s00122-012-1953-0 (2012).
21. Cloutier, S. et al. Simple sequence repeat marker development from bacterial artiicial chromosome end sequences and expressed sequence tags of lax (Linum usitatissimum L.). heoretical and Applied Genetics 125, 685–694, doi:10.1007/s00122-012-1860-4 (2012). 22. Cloutier, S., Niu, Z., Datla, R. & Duguid, S. Development and analysis of EST-SSRs for lax (Linum usitatissimum L.). heoretical and
Applied Genetics 119, 53–63, doi:10.1007/s00122-009-1016-3 (2009).
23. Venglat, P. et al. Gene expression analysis of lax seed development. BMC Plant Biology 11, 74, doi:10.1186/1471-2229-11-74 (2011). 24. Wang, Z. et al. he genome of lax (Linum usitatissimum) assembled de novo from short shotgun sequence reads. he Plant Journal
72, 461–473, doi:10.1111/j.1365-313X.2012.05093.x (2012).
25. Lee, E. K. et al. A functional phylogenomic view of the seed plants. PLOS Genetics 7, e1002411, doi:10.1371/journal.pgen.1002411 (2011). 26. Schoenbohm, C., Martens, S., Eder, C., Forkmann, G. & Weisshaar, B. Identification of the Arabidopsis thaliana flavonoid 3′-hydroxylase gene and functional expression of the encoded P450 enzyme. Biological Chemistry 381, 749–753, doi:10.1515/ BC.2000.095 (2000).
27. Porter, L. J., Hrstich, L. N. & Chan, B. G. The conversion of procyanidins and prodelphinidins to cyanidin and delphinidin. Phytochemistry 25, 223–230, doi:10.1016/S0031-9422(00)94533-3 (1985).
28. Holton, T. A. et al. Cloning and expression of cytochrome P450 genes controlling flower colour. Nature 366, 276–279, doi:10.1038/366276a0 (1993).
29. Nishihara, M. & Nakatsuka, T. Genetic engineering of flavonoid pigments to modify flower color in floricultural plants. Biotechnology Letters 33, 433–441, doi:10.1007/s10529-010-0461-z (2011).
30. Seitz, C. et al. Cloning, functional identiication and sequence analysis of lavonoid 3′-hydroxylase and lavonoid 3′,5′-hydroxylase cDNAs reveals independent evolution of lavonoid 3′,5′-hydroxylase in the Asteraceae family. Plant Molecular Biology 61, 365–381, doi:10.1007/s11103-006-0012-0 (2006).
31. Seitz, C., Ameres, S. & Forkmann, G. Identiication of the molecular basis for the functional diference between lavonoid 3′ hydroxylase and lavonoid 3′,5′ hydroxylase. FEBS Letters 581, 3429–3434, doi:10.1016/j.febslet.2007.06.045 (2007).
32. Seitz, C., Ameres, S., Schlangen, K., Forkmann, G. & Halbwirth, H. Multiple evolution of lavonoid 3′,5′-hydroxylase. Planta 242, 561–573, doi:10.1007/s00425-015-2293-5 (2015).
33. Rupasinghe, S. & Schuler, M. A. Homology modeling of plant cytochrome P450s. Phytochemistry Reviews 5, 473–505, doi:10.1007/ s11101-006-9028-y (2006).
34. Gotoh, O. Substrate recognition sites in cytochrome P450 family 2 (CYP2) proteins inferred from comparative analyses of amino acid and coding nucleotide sequences. Journal of Biological Chemistry 267, 83–90 http://www.jbc.org/content/267/1/83.full. pdf+html (1992).
35. Rupasinghe, S., Baudry, J. & Schuler, M. A. Common active site architecture and binding strategy of four phenylpropanoid P450s from Arabidopsis thaliana as revealed by molecular modeling. Protein Engineering 16, 721–731, doi:10.1093/protein/gzg094 (2003). 36. Hoshino, A. et al. Spontaneous mutations of the lavonoid 3′-hydroxylase gene conferring reddish lowers in the three morning glory
species. Plant and Cell Physiology 44, 990–1001, doi:10.1093/pcp/pcg143 (2003).
37. Weng, J.-K. he evolutionary paths towards complexity: a metabolic perspective. New Phytologist 201, 1141–1149, doi:10.1111/ nph.12416 (2013).
38. Matsuda, F. et al. MS/MS spectral tag-based annotation of non-targeted proile of plant secondary metabolites. he Plant Journal 57, 555–577, doi:10.1111/j.1365-313X.2008.03705.x (2009).
39. Ueyama, Y. et al. Molecular and biochemical characterization of torenia lavonoid 3′-hydroxylase and lavone synthase II and modification of flower color by modulating the expression of these genes. Plant Science 163, 253–263, doi: 10.1016/S0168-9452(02)00098-5 (2002).
40. Falginella, L. et al. Expansion and subfunctionalisation of lavonoid 3′,5′-hydroxylases in the grapevine lineage. BMC Genomics 11, 562, doi:10.1186/1471-2164-11-562 (2010).
41. Nakatsuka, T., Nishihara, M., Mishiba, K., Hirano, H. & Yamamura, S. Two diferent transposable elements inserted in lavonoid 3′,5′-hydroxylase gene contribute to pink lower coloration in Gentiana scabra. Molecular Genetics and Genomics 275, 231–241, doi:10.1007/s00438-005-0083-7 (2006).
42. Nishihara, M., Hikage, T., Yamada, E. & Nakatsuka, T. A single-base substitution suppresses lower color mutation caused by a novel miniature inverted-repeat transposable element in gentian. Molecular Genetics and Genomics 286, 371–382, doi: 10.1007/s00438-011-0652-x (2011).
www.nature.com/scientificreports/
43. Rausher, M. D. Evolutionary transitions in loral color. International Journal of Plant Sciences 169, 7–21, doi:10.1086/523358 (2008). 44. Tanaka, Y. Flower colour and cytochromes P450. Phytochemistry Reviews 5, 283–291, doi:10.1007/s11101-006-9003-7 (2006). 45. Hughes, A. L. he evolution of functionally novel proteins ater gene duplication. Proceedings of the Royal Society of London B:
Biological Sciences 256, 119–124, doi:10.1098/rspb.1994.0058 (1994).
46. Näsvall, J., Sun, L., Roth, J. R. & Andersson, D. I. Real-time evolution of new genes by innovation, ampliication, and divergence. Science 338, 384–387, doi:10.1126/science.1226521 (2012).
47. Des Marais, D. L. & Rausher, M. D. Escape from adaptive conlict ater duplication in an anthocyanin pathway gene. Nature 454, 762–765, doi:10.1038/nature07092 (2008).
48. Fenster, C. B., Armbruster, W. S., Wilson, P., Dudash, M. R. & homson, J. D. Pollination syndromes and loral specialization. Annual Review of Ecology, Evolution, and Systematics 35, 375–403, doi:10.1146/annurev.ecolsys.34.011802.132347 (2004).
49. Reverté, S., Retana, J., Gómez, J. M. & Bosch, J. Pollinators show lower colour preferences but lowers with similar colours do not attract similar pollinators. Annals of Botany 118, 249–257, doi:10.1093/aob/mcw103 (2016).
50. Clegg, M. T. & Durbin, M. L. Flower color variation: a model for the experimental study of evolution. Proceedings of the National Academy of Sciences 97, 7016–7023, doi:10.1073/pnas.97.13.7016 (2000).
51. Fu, Y.-B. Population-based resequencing revealed an ancestral winter group of cultivated lax: implication for lax domestication processes. Ecology and Evolution 2, 622–635, doi:10.1002/ece3.101.
52. Tel-Zur, N. & Schneider, B. Floral biology of Ziziphus mauritiana (Rhamnaceae). Sexual Plant Reproduction 22, 73–85, doi:10.1007/ s00497-009-0093-4 (2009).
53. Abramoff, M. D., Magalhães, P. J. & Ram, S. J. Image processing with ImageJ. Biophotonics International 11, 36–42 https:// imagescience.org/meijering/publications/download/bio2004.pdf (2004).
54. Martins, W. S., Lucas, D. C. S., Neves, K. F. D. S. & Bertioli, D. J. WebSat - A web sotware for microsatellite marker development. Bioinformation 3, 282–283 https://www.ncbi.nlm.nih.gov/pmc/articles/PMC2646864/ (2009).
55. Cloutier, S., Ragupathy, R., Niu, Z. & Duguid, S. SSR-based linkage map of lax (Linum usitatissimum L.) and mapping of QTLs underlying fatty acid composition traits. Molecular Breeding 28, 437–451, doi:10.1007/s11032-010-9494-1 (2011).
56. Kumar, S., You, F. M. & Cloutier, S. Genome wide SNP discovery in flax through next generation sequencing of reduced representation libraries. BMC Genomics 13, 684, doi:10.1186/1471-2164-13-684 (2012).
57. Churchill, G. A. & Doerge, R. W. Empirical threshold values for quantitative trait mapping. Genetics 138, 963–971 http://www. genetics.org/content/138/3/963.long (1994).
58. Meisel, L. et al. A rapid and eicient method for purifying high quality total RNA from peaches (Prunus persica) for functional genomics analyses. Biological Research 38, 83–88, doi:10.4067/S0716-97602005000100010 (2005).
59. Roach, M. J. & Deyholos, M. K. Microarray analysis of developing lax hypocotyls identiies novel transcripts correlated with speciic stages of phloem ibre diferentiation. Annals of Botany 102, 317–330, doi:10.1093/aob/mcn110 (2008).
60. Livak, K. J. & Schmittgen, T. D. Analysis of relative gene expression data using real-time quantitative PCR and the 2−∆∆CT method.
Methods 25, 402–408, doi:10.1006/meth.2001.1262 (2001).
61. Akhov, L., Ashe, P., Tan, Y., Datla, R. & Selvaraj, G. Proanthocyanidin biosynthesis in the seed coat of yellow-seeded, canola quality Brassica napus YN01-429 is constrained at the committed step catalyzed by dihydrolavonol 4-reductase. Botany 87, 616–625, doi:10.1139/B09-036 (2009).
62. Li, Y.-G., Tanner, G. & Larkin, P. he DMACA-HCl protocol and the threshold proanthocyanidin content for bloat safety in forage legumes. Journal of the Science of Food and Agriculture 70, 89–101, doi:10.1002/(SICI)1097-0010(199601)70:1<89::AID-JSFA470>3.0.CO;2-N (1996).
Acknowledgements
We are grateful to the NRC DNA Unit staf and Plant Growth Facilities staf for their support. his project was supported by the Agricultural Development Fund, Ministry of Agriculture, Saskatchewan and by Genome Canada (Total Utilization of Flax Genomics; TUFGEN) and a Natural Sciences and Engineering Research Council (NSERC) Discovery Grant to G.S.
Author Contributions
G.S. and G.R. conceived the project. Growing plants and phenotyping by G.P.S. and H.S.; mapping by G.P.S. and M.K.; phytochemistry by L.A.; bioinformatics by P.A. and M.K.; molecular biology by G.P.S. and L.A. G.S. and Y.W. supervised the M. Sc research work of G.P.S. S.C. contributed some of the SSR primers and data on Avantgard sequences. M.K. collated data, with assistance from L.A. and P.A. M.K., L.A. and G.P.S. wrote a irst drat. G.S. directed the research and wrote the inal MS version that was read, edited and approved by all authors.
Additional Information
Supplementary information accompanies this paper at doi:10.1038/s41598-017-11565-7
Competing Interests: he authors declare that they have no competing interests.
Publisher's note: Springer Nature remains neutral with regard to jurisdictional claims in published maps and
institutional ailiations.
Open Access This article is licensed under a Creative Commons Attribution 4.0 International
License, which permits use, sharing, adaptation, distribution and reproduction in any medium or format, as long as you give appropriate credit to the original author(s) and the source, provide a link to the Cre-ative Commons license, and indicate if changes were made. he images or other third party material in this article are included in the article’s Creative Commons license, unless indicated otherwise in a credit line to the material. If material is not included in the article’s Creative Commons license and your intended use is not per-mitted by statutory regulation or exceeds the perper-mitted use, you will need to obtain permission directly from the copyright holder. To view a copy of this license, visit http://creativecommons.org/licenses/by/4.0/.