HAL Id: hal-01897771
https://hal.archives-ouvertes.fr/hal-01897771
Submitted on 17 Oct 2018
HAL is a multi-disciplinary open access
archive for the deposit and dissemination of
sci-entific research documents, whether they are
pub-lished or not. The documents may come from
teaching and research institutions in France or
abroad, or from public or private research centers.
L’archive ouverte pluridisciplinaire HAL, est
destinée au dépôt et à la diffusion de documents
scientifiques de niveau recherche, publiés ou non,
émanant des établissements d’enseignement et de
recherche français ou étrangers, des laboratoires
publics ou privés.
Biophysical dependences among functional wood traits
Jana Dlouhà, Tancrède Alméras, Jacques Beauchêne, Bruno Clair, Meriem
Fournier
To cite this version:
Jana Dlouhà, Tancrède Alméras, Jacques Beauchêne, Bruno Clair, Meriem Fournier. Biophysical
dependences among functional wood traits. Functional Ecology, Wiley, 2018, 32 (12), pp.2652-2665.
�10.1111/1365-2435.13209�. �hal-01897771�
The integration of wood traits as an independent variation axis orthogonal to leaf traits has been emphasized in plant ecology (Baraloto, Timothy Paine, et al., 2010; Chave et al., 2009; Fortunel, Fine, & Baraloto, 2012; Richardson et al., 2013). Wood density is
often taken as a key functional wood trait. Species with high den‐ sity tend to have lower growth and mortality rates, increased adult stature, shade tolerance and drought resistance (King, Davies, Tan, & Noor, 2006; Kunstler et al., 2016; Osazuwa‐Peters, Wright, & Zanne, 2017; Osunkoya et al., 2007; Poorter et al., 2010). However, evidence for wood density as a proxy of species strategies is mixed (Moles,
| Tancrède Alméras
2| Jacques Beauchêne
3| Bruno Clair
2,4|
Biophysical dependences among functional wood traits
Jana Dlouhá
1Meriem Fournier
11Université de Lorraine, AgroParisTech, Inra, Silva, Nancy, France
2LMGC, CNRS, Université de Montpellier, Montpellier, France
3CIRAD, UMR EcoFoG, AgroParisTech, CNRS, INRA, Université des Antilles, Université de Guyane, Kourou, France 4CNRS, UMR EcoFoG, AgroParisTech, Cirad, INRA, Université des Antilles, Université de Guyane, Kourou, France
Correspondence Jana Dlouhá Email: [email protected] Funding information French National Research Agency to the Woodiversity, Grant/Award Number: ANR‐05‐BDIV‐0012‐04; Bridge, Grant/ Award Number: ANR‐06‐BDIV‐0004; French National Research Agency (ANR), Grant/Award Number: ANR‐11‐ LABX‐0002‐01 and ANR‐10‐LABX‐25‐01
1 | INTRODUC TION
Abstract
1. Wood properties and especially wood density have been used as functional traits organized along major axes of species life history and strategy. Beyond statistical analyses, a better mechanistic understanding of relationships among wood traits is essential for ecologically relevant interpretation of wood trait variations. 2. A set of theoretical relationships mechanistically linking wood basic density with
some other wood traits is derived from cellular material physics. These theoretical models picture basic physical constraints and thus provide null hypotheses for further ecological studies. Analysis is applied to data from two original datasets and several datasets extracted from the literature.
3. Results emphasize the strong physical constraint behind the link between basic density and maximal storable water on the one hand, and elastic modulus on the other hand. Beyond these basic physical constraints, the developed framework reveals physically less expected trends: the amount of free water available for physiological needs increases in less dense wood of fast‐growing species, and the cell wall stiffness decreases with density in temperate hardwoods and is higher in sapling stages in the rainforest understorey where competition for light is associ‐ ated with high mechanical risk.
4. We emphasize the use of theoretically independent traits derived from models of cellular material physics to investigate the functional variation of wood traits to‐ gether with their environmental and phylogenetic variations. Although the cur‐ rent study is limited to basic density, green wood lumen saturation and wood specific modulus, we further emphasize the identification of complementary inde‐ pendent wood traits representing other biomechanical functions, nutrient stor‐ age, hydraulic conductance and resistance to drought.
K E Y W O R D S
2018; Russo et al., 2010). Indeed, to get relevant functional wood traits, tissue properties must be integrated at the whole plant level taking into account volume and shape of woody organs (Fournier, Dlouha, Jaouen, & Almeras, 2013; Lachenbruch & McCulloh, 2014). Moreover, as woods with the same density can have different anato‐ mies and cell wall structure, hydraulic and mechanical properties can be poorly linked to wood density (Lachenbruch & McCulloh, 2014; Zanne et al., 2010; Ziemińska, Westoby, & Wright, 2015). As devel‐ oped by Zanne et al. (2010) for hydraulic conductivity, more complex metrics of orthogonal axes of wood traits can be designed beyond the main axis of wood density. Lastly, dealing with wood density or other wood traits, attention must be paid to wood water content. Basic density, that is, the ratio between dried biomass to wet volume of wood in living trees, is nowadays a widely measured variable, used to estimate biomass and carbon fluxes from wood volumes assessed from non‐destructive forest measurements (Bastin et al., 2015; Chave et al., 2009; Nogueira, Fearnside, & Nelson, 2008). Beyond basic density, green wood density (including water content of wood in the living tree) is functionally relevant—for example, it represents the mechanical load per unit of stem volume—and is statistically well correlated to other wood traits (e.g., Niklas & Spatz, 2010). Beyond this rough correlation, more independent and functionally relevant traits, as water content, can be calculated from basic and green den‐ sity (Gartner, Moore, & Gardiner, 2004; Poorter, 2008).
In this paper, we emphasize physical constraints contained in em‐ pirical correlations between some wood traits. Indeed, correlation and causation are complex problems for the science of plant traits (Westoby & Wright, 2006). For evolutionary biologists, physical re‐ lationships cannot be disentangled from biological ones as evolution operates on the basis of a set of developmental constraints that are “physical” (in the sense that they fulfil mechanical or physiological functions). However, some physical relationships—as, for example, “the higher the density, the lower the porosity in the cellular ma‐ terial”—are biologically meaningless. There is no need of a complex genetic system to insure the co‐evolution of density and porosity which is an intrinsic property of cellular materials, biological or arti‐ ficial (Gibson & Ashby, 1997). Therefore, such laws of physics (most of them are less intuitive than the link between density and poros‐ ity) provide null hypotheses to ecologists. Then, analysing empirical statistical discrepancies from these null hypotheses, so long as they are not the result of measurement error, are meaningful in terms of adaptation to environmental conditions and/or phylogenetic con‐ straints. Note that these meaningful discrepancies can be poor cor‐ relations, although they would have been assumed as poor results by empirical science. The mechanistic toolbox we will develop uses a simplified representation of wood as a cellular material (Gibson & Ashby, 1997) to derive a set of physical relationships expected to link wood density measured at different moisture contents with some functional wood properties. We focus on the following properties: the potential capacitance of wood tissue, that is, the maximum amount of water that can be stored in a given wood volume, and the complementary amount of gas stored, already used by Gartner et al. (2004) or Poorter (2008) as functional traits, and the elastic
modulus, that is, the tissue mechanical stiffness, a relevant and basic biomechanical trait (Niklas & Spatz, 2012). Two original datasets of wood properties will be used. Dataset 1 is part of a large research project (Baraloto, Paine, et al., 2010; Sarmiento et al., 2011), includes a large diversity of species and contains basic density, green density and saturated density data. Dataset 2 provides data about inter‐ and intraspecific variability of basic density and elastic modulus of wood from trees at sapling stages where mechanical stability is a great constraint.
In this paper, we will check null hypothesis stressed in the phys‐ ical model of relationships among wood traits. Dataset 1 comes from a zone without a drought constraint so we do not expect any discrepancy from null hypotheses linking wood water content and construction cost, supporting results of Baraloto, Paine, et al., 2010; Baraloto, Timothy Paine, et al., 2010 who described one main axis of stem strategy: dense wood vs. high wood water content. In dataset 2, we could expect that to maintain self‐support, the lower wood density of fast‐growing pioneer species is compensated by higher cell wall stiffness, so that the relationship between wood density and modulus of elasticity differs from the null hypothesis.
2 | MATERIALS AND METHODS
2.1 | Plant material
Wood material for dataset 1 was collected in seven permanent 1‐ ha plots in French Guiana between November 2007 and September 2008. Overall, 2234 wood specimens from 601 species (http:// bridge.ecofog.gf/) were collected from adult trees, each species being represented by at least one tree without any within‐tree rep‐ etition of specimens. A 7‐mm‐diameter increment borer was used to extract sapwood at 1.3 m above‐ground level. Bark and cambium tis‐ sues were removed manually from each core to obtain a representa‐ tive 6‐mm‐long core containing only sapwood. The specimens were placed in a 2‐ml plastic tube, stored at −20°C in a portable freezer in the field and transported to a laboratory at Kourou, French Guiana, for density measurements.
Wood material for dataset 2 was collected at the Paracou Research Station, French Guiana (5°18′ N, 52°55′ W; Gourlet‐Fleury, Guehl, & Laroussinie, 2004), between September 2006 and October 2007. Ten tree species were selected among common angiosperms to cover a wide range of wood density. A total of 528 wood specimens were taken from saplings with diameter at breast height ranging from 40 to 70 mm including several replicates per tree to capture the wood properties’ radial variation. Straight as well as leaning stems were included in the study. Specimens (150 × 12 × 2 mm, L × T × R) were cut along the grain from 50‐cm‐long basal logs within a week after felling the trees at vari‐ ous distances from the pith including the juvenility gradient usually as‐ sociated with strong radial variation in wood structure and properties (Lachenbruch, Moore, & Evans, 2011). In tilted trees, sampling was per‐ formed along the diameter with higher eccentricity expecting occur‐ rence of reaction wood (Ruelle, Clair, Beauchene, Prevost, & Fournier, 2006). The objective was to maximize the intraspecific variability in
terms of different wood types (juvenile, tension and opposite wood). Specimens were then wrapped in wet sheets and plastic bags for trans‐ port from the field to the laboratory and kept wet immersed in water at low temperatures (4 ± 0.5°C) to avoid degradation (Dlouha, Almeras, & Clair, 2012). Both datasets are available in the Dryad Digital Repository (Dlouhá, Alméras, Beauchêne, Clair, & Fournier, 2018)
2.2 | Mass and volume measurements
For both datasets, the mass of specimens was measured in green state, and their fresh volume was estimated by the double weigh‐ ing method (Barnett & Jeronimidis, 2003). For dataset 1, specimens were then saturated in water in vacuum condition during 48–72 hr and finally dried at 103° for 72 h. Specimens of dataset 2 were dried at 60°C for 48 h which results in residual moisture content of 0.75% ± 0.03% (Brémaud, 2006) but avoids micro‐cracks during the drying so that specimens remain suitable for mechanical testing. Density and moisture content were calculated according to relation‐ ships and are summarized in Table 1.
2.3 | Elastic modulus
The elastic modulus for dataset 2 was estimated by forced flexural vibration method on specimens in green condition within 1 month after felling the tree. A frequency sweep detects the resonance fre‐
quency, from which the specific modulus of elasticity (E/d) is deter‐
mined according to the Euler–Bernoulli equation:
where l and h are the specimen length and thickness, f is the reso‐ nance frequency of the first mode and m is a constant depending on
mode order (m1 = 4.730). Details on the experimental procedure are
given in Brémaud et al. (2012).
2.4 | Definitions of traits and physical relationships
between traits
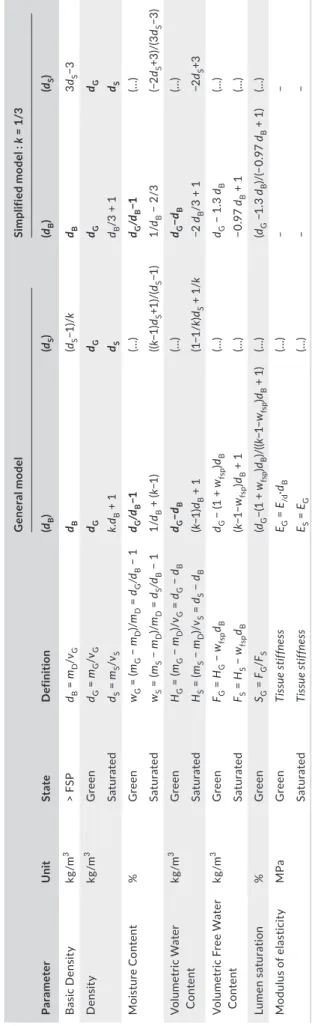
Definitions of different wood traits are summarized in Table 1. Physical assumptions and laws, detailed in Supporting information Appendix S1, give expected relationships among these traits. Results of calculations can be synthesized as follows (see also Table 1):
Above the fibre saturation point (FSP), moisture content wG links
basic density dB with green density dG:
The dependence of saturated density dS on basic density dB is
linear:
The intercept equal to 1 means that when basic density tends to 0, wood saturated density comes close to the density of water.
E/d=48π 2l4f2 m2h2 , (1) wG= dG∕dB− 1. (2) dS= 1 + k dB. T A B LE 1 D ef in iti on s o f d en si ty i n d iff er en t w at er c on di tio n a nd r el at ed w oo d t ra its , m od el s r el at in g t he m t o b as ic d en si ty o r s at ur at ed d en si ty ( ge ne ra l a nd s im pl ifi ed m od el s u si ng k = 1/ 3 as e xp la in ed in S up po rt in g in fo rm at io n A pp en di x S1 ). So m e m od el s, in di ca te d by (… ), ar e no t d et ai le d he re b ut c an b e ea si ly c om pu te d fr om re la tio ns hi p w ith b as ic d en si ty dB a nd dep en den ce be tw ee n dB a nd s at ur at ed d en si ty dS . F SP : f ib re s at ur at io n p oi nt , m : m as s, v: v ol um e, i nd ex D , G , S s ta nd f or d ry , g re en a nd s at ur at ed s ta te , r es pe ct iv el y Pa ra m et er U nit St at e D ef ini tio n G en er al m ode l Si m pl ifi ed m od el : k = 1/3 (dB ) (dS ) (dB ) (dS ) B as ic D en si ty kg /m 3 > F SP dB = mD /vG dB (dS −1)/ k dB 3dS −3 D en si ty kg /m 3 G re en dG = mG /vG dG dG dG dG Sat ur ate d dS = mS /vS k. dB + 1 dS dB /3 + 1 dS M oi st ur e C onte nt % G re en wG = (m G − mD )/ mD = dG /dB − 1 dG /dB −1 (…) dG /dB −1 (…) Sat ur ate d wS = (m S − mD )/ mD = dS /dB − 1 1/ dB + (k −1 ) ((k −1 )dS +1)/ (dS −1 ) 1/ dB − 2 /3 (−2 dS +3 )/( 3dS −3 ) Vo lu m et ric W at er C onte nt kg /m 3 G re en HG = (m G − mD )/ vG = dG − dB dG −dB (…) dG −dB (…) Sat ur ate d HS = (m S − mD )/ vS = dS − dB (k −1 )dB + 1 (1 −1 /k )dS + 1 /k −2 dB /3 + 1 −2 dS +3 Vo lu m et ric F re e W at er C onte nt kg /m 3 G re en FG = HG − wfsp dB dG − (1 + wfsp )dB (…) dG − 1 .3 dB (…) Sat ur ate d FS = HS − wfsp dB (k −1 −w fsp )dB + 1 (…) −0 .9 7 dB + 1 (…) Lu men s atu ra tio n % G re en SG = FG /FS (dG −( 1 + wfs p )dB )/( (k −1 −w fs p )dB + 1) (…) (dG − 1. 3 dB )/( −0 .9 7 dB + 1) (…) M od ul us o f e la st ic ity MP a G re en Tiss ue st iff ne ss EG = E/d ·dB (…) – – Sat ur ate d Tiss ue st iff ne ss ES = EG (…) – −
The parameter k is 1/3 according to a simplified model assuming the additivity of volumes.
Maximum moisture content wS and basic or saturated density are
then linked as follows:
The maximum volumetric water content HS may be expressed
as follows:
Partitioning of water contained in wood between the cell wall and cell lumens for wood having different basic density and different saturation state is illustrated in Figure 1. The water bound in the cell wall cannot be used for physiological needs; therefore, free water
content FG computed as a difference between volumetric water con‐
tent HG in green condition and water content bound in the cell wall
wFSP is a more appropriate variable as we introduced in Longuetaud
et al. (2017):
The relative saturation of lumen in green wood specimens (SG)
can be quantified as follows:
where HFSP is volumetric water content at FSP.
The green and the saturated elastic moduli are the same (EG = ES).
As for any honeycomb cellular material, wood elastic modulus in the fibre direction is expected to be proportional to its density (Gibson & Ashby, 1997):
E/d· is referred to as “wood specific modulus” (Gibson & Ashby,
1997; Niklas, 1993). We assume here that density reflects the amount of cell wall, by neglecting the contribution of non‐structural material such as living cells’ content and some extractive molecules located outside the cell wall. As the density of cell wall does not vary significantly among species and among wood types (Kellogg & Wangaard, 1969), the specific modulus directly reflects the stiffness
of the cell wall (Ecw) and E/d ≈ Ecw/1.5.
It is important to note that EG, although being a property of green
wood, is physically linked to basic density dB rather than to green
density dG because dG is addition of mass of the mechanically effi‐
cient cell wall material and of the mechanically inert free water in
lumen. Niklas and Spatz (2010) have found that dG measured at 50%
moisture content was a good predictor of mechanical properties
which is not surprising because d50 is a multiple of dB: Equation 2
gives d50 = 1.5 dB. However, 50% of moisture content has no specific
meaning regarding wood status in the living tree and conditioning wood at 50% moisture content is technically challenging. The proper
mechanistic predictor of EG is dB since it represents the amount of
supporting tissue in the unit of volume.
2.5 | Statistical analyses
We investigate three types of relationships from our data: (a) rela‐ tionships between wood density and water status as expressed by Equations 3‒7 (dataset 1); (b) relationships between physical param‐ eters of wood in green condition and basic density (dataset 1) and (c) relationships between elastic modulus and density on dataset 2 (Equation 9). For each examined relationship, linear model was first fitted using the ordinary least square method implemented in “lm” function of the R software (R Core Team, 2017). Further, random ef‐ fects (species for dataset 1 and nested levels species and individuals for dataset 2) were introduced using the “lmer” function of the “lme4″ package (Bates, Maechler, Bolker, & Walker, 2015). Mixed‐effect mod‐ els were fitted by the restricted maximum‐likelihood (REML) method. The selection of the best model fitted was based on Akaike’s infor‐ mation criterion and likelihood ratio test for nested model (“ANOVA” function in R). For dataset 1, only random effect associated with (3) wS= 1∕dB+ (k − 1) ≈ 1∕dB− 2∕3. (4) WS= ((k − 1)dS+ 1)∕(dS− 1) ≈ ( − 2⋅dS+ 3)∕(3⋅dS− 3). (5) HS= 1 + (k − 1)⋅dB≈ 1 − 2∕3⋅dB (6) or HS= (1 − 1∕k)⋅dS+ 1∕k ≈ 3 − 2dS (7) FG= HG− wFSP⋅dB (8) SG= (HG− HFSP)∕(HS− HFSP) (9) EG= E/d⋅dB
F I G U R E 1 Illustration of theoretical variations of green density dG and moisture content wG within the range of volume available for
water and air. As shown in Figure 1, the volume of voids (HS) decreases when basic density dB increases, can be filled only by air at the
theoretical fibre saturation point and replaced by water at in the saturated situation. Three situations are explored: a very low basic density
dB = 0.1 with plenty of space available for water and air, a very high one dB = 0.8 where voids for air or water are very limited and an
intermediary common one of dB = 0.4
100%
Volume dB = 0.1 Volume dB = 0.4 Volume dB = 0.8
80% 60%
gaz
gaz
Dry biomass Dry biomass
Free water Free water Bound water 40%
20% 0%
FSP Saturation FSP Saturation FSP Saturation 100% 80% 60% 40% 20% 0% 100% 80% 60% 40% 20% 0%
intercept was considered, as small number of specimens per species with limited intraspecific predictor range does not make it suitable
for random slope model. Relationship between wS and dB was trans‐
formed to a linear form using 1/dB as a variable. For relationships es‐
timating the green wood parameters, dG~dB, FG~dB, non‐linear forms
of model, namely, the second‐order polynomial, the logarithmic and
the power function for the relationship dG~dB were tested using the
“nlmer” function. In addition, the variance for these two relationships was not constant so weighted regression using the “VarExp” function was fitted. To examine whether the model parameter value was sig‐ nificantly different from zero or from the physical model parameter value, confidence intervals of the fixed parameters were investigated using the “confint” function, the level of confidence being set to 0.95.
3 | RESULTS
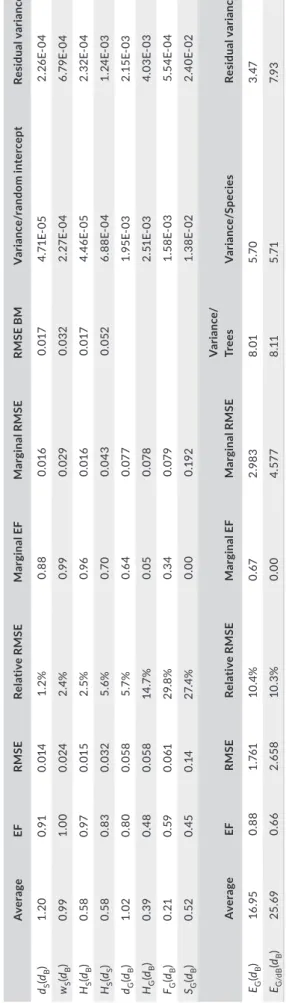
As stated at the end of introduction, the better the physical model fits, the stronger the physical constraint it bears. A poorly fitted model means species or individuals are able to overturn laws of cel‐ lular material design, by adjusting the geometry of vessels to po‐ rosity, or by changing the cell wall mechanical properties with the amount of cell wall. Parameters of all empirical and physical models are summarized in Table 2.
3.1 | Relationship between basic density and
saturated density
We found a linear relationship between saturated and basic den‐ sity (Figure 2). Confidence interval of the slope parameter k does not overlap the slope value of simplified physical model (0.33) but overlaps 0.36, the k value of a more complete model without the simplified assumption of volume additivity between water and cell wall material (see Supporting information Appendix S1). Slight over‐
estimation of dS as predicted from dB by the physical model likely
also comes from this simplification.
3.2 | Relationship between density and maximal
water content
We found a strong inverse relationship between maximum mois‐
ture content wS and dB (Figure 3a, EF > 0.99, RMSE = 0.024),
as predicted by Equation 4. The wS values as modelled from dS
(Equation 5) were overestimated, the model setting the upper bound of experimental values (Figure 3b). Further, we found that
volumetric water content HS scales linearly with both dB and dS
as predicted by Equations 6 and 7 (Figure 3c,d). Note that relative
RMSE is lower when dB is used as a predictor for HS (RMSE = 2.5%
and 5.6% when dS is used). This is likely related to the weight of
experimental error. Indeed, based on error propagation analysis,
it can be shown that the prediction error for HS in response to
measurement error on density is five times higher when based on
dS rather than on dB. T A B LE 2 G oo dn es s of fi t o f s ta tis tic al a nd b io ph ys ic al m od el s an d va ria nc es e xp la in ed b y ra nd om e ff ec ts . E F is m od el e ff ic ie nc y, R M SE is ro ot ‐m ea n‐ sq ua re e rr or o f t he s ta tis tic al fi t, RM SE B M is ro ot ‐m ea n‐ sq ua re e rr or o f t he b io ph ys ic al m od el . E F an d RM SE fo r m ar gi na l p re di ct io ns a re a ls o re po rt ed . F or h yd ra ul ic p ar am et er s, ra nd om v ar ia nc es o f s pe ci es e ff ec t as so ci at ed w ith i nt er ce pt a re s ho w n. F or EG (dB ) r el at io ns hi p, v ar ia nc e c om po ne nt s s ho w n c or re sp on d t o s pe ci es /t re e n es te d r an do m e ff ec ts a ss oc ia te d w ith s lo pe . F or EG /dB (dB ) re la tio ns hip , th e v ar ia nc es c om po ne nt s s ho w n c or re sp on d t o s pe ci es /n es te d r an do m e ff ec ts a ss oc ia te d w ith i nt er ce pt Av er ag e EF RM SE Re la tiv e RM SE M ar gi nal E F M ar gi nal R M SE RM SE B M V ar ia nc e/ ra ndom in ter cep t Re si du al v ar ia nc e dS (dB ) 1. 20 0.9 1 0.0 14 1. 2% 0. 88 0.0 16 0.0 17 4. 71 E‐ 05 2. 26 E‐ 04 wS (dB ) 0.9 9 1. 00 0.0 24 2. 4% 0.9 9 0.0 29 0.0 32 2. 27 E‐ 04 6. 79 E‐ 04 HS (dB ) 0. 58 0.9 7 0.0 15 2. 5% 0.9 6 0.0 16 0.0 17 4. 46 E‐ 05 2. 32 E‐ 04 HS (dS ) 0. 58 0. 83 0.0 32 5. 6% 0.7 0 0.0 43 0.0 52 6. 88 E‐ 04 1. 24 E‐ 03 dG (dB ) 1. 02 0. 80 0.0 58 5.7 % 0. 64 0.0 77 1.9 5E ‐0 3 2.1 5E ‐0 3 HG (dB ) 0. 39 0.4 8 0.0 58 14 .7 % 0.0 5 0.0 78 2. 51 E‐ 03 4.0 3E ‐0 3 FG (dB ) 0. 21 0. 59 0.0 61 29 .8 % 0. 34 0.0 79 1. 58 E‐ 03 5. 54 E‐ 04 SG (dB ) 0. 52 0. 45 0. 14 27. 4% 0.0 0 0. 19 2 1. 38 E‐ 02 2. 40 E‐ 02 Av er ag e EF RM SE Re la tiv e RM SE M ar gi nal E F M ar gi nal R M SE V ari anc e/ Tr ees V ar ian ce /S pec ies Re si du al v ar ia nc e EG (dB ) 16 .9 5 0. 88 1. 76 1 10 .4 % 0. 67 2.9 83 8. 01 5.7 0 3. 47 EG/d B (dB ) 25 .6 9 0. 66 2. 65 8 10 .3 % 0.0 0 4. 57 7 8. 11 5. 71 7. 93
3.3 | Relationships between basic density and
physical parameters of green wood
Relationship between dG and dB (Figuation 4a) was the best fitted
by a logarithmic weighted regression with random effect associated with intercept. We found a negative linear fit with random effect as‐ sociated with intercept between volumetric water content of green
wood HG and dB (Figure 4b). Random effect significantly increased the
model efficiency (Table 2), and the confidence interval of the slope parameter did not overlap zero and p‐value was highly significant (p < 0.001). Only 23 points out of 2,234 lie beyond the theoretical bounds set up by Equations 6 and 7 corresponding to FSP and satu‐
rated state, respectively. Free volumetric water content FG scales
with dB as predicted by Equation 8 (Figure 4c), and the relationship
was best fitted by a second‐order polynomial weighted regression
with null linear term. The slope of the SG−dB linear model was not
significant (confidence interval of the slope parameter overlapped zero, p‐value = 0.74) so random y‐intercept model was fitted. Lumen
saturation degree SG covers all the potential range from close to 0%
(FSP) to 100% (full saturation), 95% of data ranging between 15% and
88% and the average SG being 52% (Figure 4d). Note that a moisture
content w = 50%, a reference value used by Niklas and Spatz (2010), is physically impossible for woods with basic density larger than
0.86 × 10³ kg/m3.
3.4 | Relationship between mechanical
properties and density
Relationship between elastic modulus EG and dB was best fitted by
a linear regression without intercept with nested random effects species/tree associated with the slope (Figure 5a). The form of the
statistical fit followed theoretical prediction (Equation 10). Variance components analysis of random effects shows that 47% of the ran‐ dom variance was explained by tree effect and 37% by species effect (Table 2).
Slope of the linear relationship between wood specific modu‐
lus E/d and dB was not statistically significant, and its confidence
interval overlapped zero for both models, with and without ran‐ dom effects associated with the intercept (p‐value equal to 0.18 and 0.08, respectively). Therefore, we fitted y‐intercept model with nested random effects species/tree associated with the in‐ tercept. As shown in Table 2, tree and species effects explained, respectively, 37% and 26% of the random variance. Figure 5b in‐ cludes a compilation of previously reported green wood data (see
figure legend for details) and shows wide range of variation of E/d
(from 20 to 30 GPa.m3/kg).
4 | DISCUSSION
4.1 | Due to cellular nature of wood material, dried
matter content, namely, basic density, is strongly
linked to maximal water content w
Sor H
SThe use of inherently linked parameters artificially inflates the weight of the considered variable. Moreover, if the physical re‐
lationship is non‐linear as between wS and dB, usual multivari‐
ate analyses will fail in detecting the redundancy and will treat this non‐linearity as a source of variability. As basic density is
physically linked to fully saturated wood properties dS, wS or HS
(Equations 3‒5, Figures 2 and 3), we advocate the use of a single wood trait, namely, basic density, to represent these four param‐ eters in multivariate analyses of wood traits for ecological stud‐ ies as in Chave et al. (2009), Baraloto, Paine, et al., 2010; Baraloto, Timothy Paine, et al., 2010 and Fortunel, Ruelle, Beauchêne, Fine, and Baraloto (2014).
4.2 | The amount of free water available for
physiological needs, namely, F
G, slightly increases in
light wood species with faster growth
Green wood traits (dG, wG, HG and SG) are not mechanistically related
to basic density because they depend on the relative proportion of gas and water in the lumens. This proportion varies with many parameters such as environmental condition, daytime, season, rain events and ontogeny (Barnard et al., 2011; Hao, Wheeler, Holbrook, & Goldstein, 2013; Pineda‐Garcia, Paz, & Meinzer, 2013; Scholz et al., 2008); however, the magnitude of temporal variation does not exceed 10% (Hao et al., 2013).
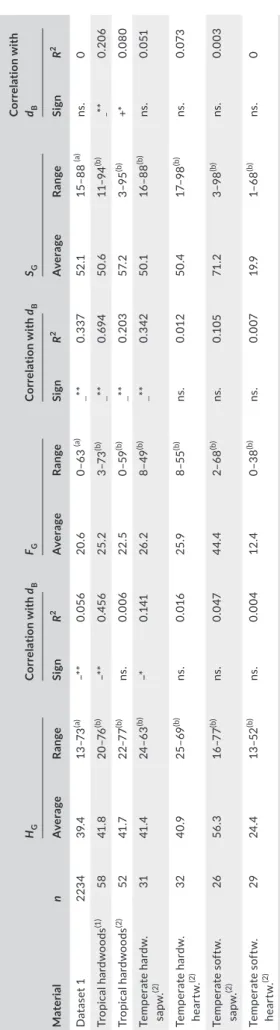
Negative relationships observed between free water content and basic density (Table 3) indicate that light wood species store higher amount of available water per unit of wood volume. We may question the biological reason for this. In angiosperms, light wood is associated with larger vessels (Hietz, Rosner, Hietz‐Seifert, & Wright, 2017; Zanne F I G U R E 2 Relationship between saturated and basic density.
Red line represents empirical fit, and black line corresponds to physical model (Equation 2)
et al., 2010) that is not a physical necessity (low density can be easily obtained from a large number of small vessels) but an adaptation of light wood species to fast growth because large vessels enhance hydrau‐ lic conductance for a given basic density (Lachenbruch & McCulloh, 2014). Large vessels can also retain water more easily so the adapted higher conductance of less dense wood is physically associated with a higher capacity to store water although ecological requirements would have suggested that dense wood species, more adapted to drought, should tend to increase their water storage capacity (Holbrook, 1995). On the other hand, species with low density wood and, presumably, higher transpiration rates, may more rely on release of stored water to constrain transpiration‐induced fluctuation in xylem tension (Goldstein et al., 1998) compared to species with denser wood that rely primarily
on xylem structural features to avoid embolism (Meinzer, Johnson, Lachenbruch, McCulloh, & Woodruff, 2009).
4.3 | Relative proportion of water and gas in
green wood lumens S
Grepresents an axis of wood
traits orthogonal to basic density
Wide variety in the use of available porosity for water or gas storage
(Figure 4d) suggests that SG is a good candidate trait constituting an
axis of functional diversity independent of dB. Our dataset and re‐
analysed literature data (Gartner et al., 2004; Poorter, 2008) come from a zone without a drought constraint which is consistent with
very weak or non‐significant correlation found between SG and dB
F I G U R E 3 Relationships between (a) maximum moisture content and basic density; (b) maximum moisture content and saturated density, (c) maximum volumetric water content and basic density and (d) maximum volumetric water content and saturated density. Red curve represents empirical fit, and black curve corresponds to physical model (Equations 3, 6‒8)
(Table 3). However, associations between SG and dB can be expected
for ecological reasons. For instance, a higher SG would be expected
in high density wood to maintain the amount of free water although less available space in lumens; alternatively, if low wood density is an adaptation to produce higher capacity for water storage, then a
negative association between dB and SG should be expected. Water
storage capacity is definitely an interesting trait to study in the cur‐ rent context of adaptation of forest composition to climate change. Benefit of low lumen saturation raises the question of the role of gas in the living tree. As stated by Gartner et al. (2004), oxygen is necessary for the respiration of living cells such as parenchyma and
has therefore a physiological role. Correlation between amount of parenchyma and wood gas content has never been examined to our knowledge but could provide some clue. Another potential benefit of replacing lumen water by gas is increasing mechanical stability by decreasing stem weight. Gartner et al. (2004) showed that this benefit was negligible regarding resistance to wind forces. The ben‐ efit regarding self‐stability has never been quantified to our knowl‐ edge, but is a good candidate since the critical buckling tree height scales with the inverse square root of stem mass (Jaouen, Almeras, Coutand, & Fournier, 2007), which, for a given basic density, directly depends on the amount of gas it contains.
F I G U R E 4 Relationships between (a) green and basic density; (b) green volumetric water content and basic density; (c) free volumetric water content and basic density and (d) degree of lumen saturation and basic density. In all graphs, red lines represent empirical fit. Black lines in Figure 4b correspond to the physical relationship expected at fibre saturation point (FSP) and in fully saturated condition. Black lines in Figure 4d correspond to the FSP and full saturation condition, and dashed red line corresponds to moisture content of 50%. Solid black lines indicate the theoretical upper bound corresponding to the saturated state (Equation 5) and lower bound corresponding to the FSP. FSP is taken as 30% moisture content. FSP usually ranges between 28% and 32% with exceptionally low values (17%–25%) in wood of high extractives contents (Popper, Niemz & Torres, 2006)
4.4 | Wood mechanical properties: part explained
by density and information carried by residual
variability related to cell wall variation
Proportional relationship between elastic modulus and density, well established in the wood material scientist community (Evans & Ilic, 2001; Yang & Evans, 2003) and validated on large interspecific studies in the context of ecology (Chave et al., 2009; van Gelder, Poorter, & Sterck, 2006; Niklas & Spatz, 2010) was confirmed also in our study (Figure 5a). High scatter is likely due to variation of pa‐ rameters affecting cell wall properties such as microfibril angle or chemical composition (Salmen & Burgert, 2009) known to largely vary with ontogeny (Lachenbruch et al., 2011), growth or site condi‐ tion (Medhurst et al., 2012; Wimmer, Downes, & Evans, 2002) and reaction wood occurrence (Hori, Suzuki, Kamiyama, & Sugiyama, 2003; Yoshida, Ohta, Yamamoto, & Okuyama, 2002).
Our results together with a compilation of literature data show
that green wood specific modulus E/d is highly variable between and
within species and independent of dB (Figure 5b, Table 4) except for
temperate hardwoods for which weak but significant negative E/
d−dB linear relationship (p < 0.01, R2 = 0.27, Table 4) was observed,
revealing that lighter wood has developed stiffer cell walls. Despite differences in geographical origin and phylogenic classification, av‐ erage values for all datasets are very close except for the present study and the study by McLean, Arnould, Beauchene, and Clair (2012) (Table 4). Although this difference may by partly attributed to the experimental method (the resonance method is known to slightly
overestimate the elastic modulus when compared to static bending test (Brancheriau & Bailleres, 2002; Haines, Leban, & Herbe, 1996), we assume that higher values of wood specific modulus are not a methodological artefact but originates in the sampling. Actually, other studies do not deal with sapling stage of development in tropical understory, where competition for light foraging is severe, tree trunks extremely slender, easily deformable, and close to their self‐supporting limit (Jaouen et al., 2007), so that a higher specific modulus could be a great advantage for both growth and survival as suggested by McLean et al. (2011).
Positive or negative associations between E/d and dB may be ex‐
pected in some specifically constrained environments or at a particu‐ lar location inside the tree. As stated by Read, Evans, Sanson, Kerr, and Jaffre (2011), Cerberiopsis candelabra trees growing in cyclone‐prone environments combine (a) the low density wood associated with fast growth in diameter and then, higher tree bending strength, despite lower wood modulus of rupture (see Larjavaara and Muller‐Landau (2010) for an accurate discussion about why weaker wood of lower
density make stronger trees) and (b) high cell wall stiffness E/d to bet‐
ter resist bending wind loads. While the benefit of high E/d is clearly to
achieve high stiffness for a given investment in biomass, production
of wood with low E/d may result from a trade‐off with other mechan‐
ical functions. For example, the occurrence of compression wood in gymnosperms is generally associated with large microfibril angle and low cellulose content (Donaldson, Grace, & Downes, 2004). These features are necessary for this wood to perform its function, that is, generate the righting movement that enables a gravitropic correction F I G U R E 5 Relationship between (a) elastic modulus and basic density; (b) wood specific modulus and basic density for our study (average
values per species) and different literature sources (1)(Forest Product Laboratory 2010); (2)(Niklas & Spatz, 2010); (3)(Chudnoff 1979);
(4)database of Brazilian wood properties available online (http://www.remade.com.br) and McLean et al. (2012). Vm: Virola michelii Heckel;
Dg: Dicorynia guianensis Amsh.; Eg: Eperua grandiflora (Aubl.) Benth.; Lp: Lecythis persistens Sagot; La: Licania alba (Bernoulli) Cuatrec.; Oa: Oxandra asbeckii (Pulle) R.E. Fries; Gg: Goupia glabra Aubl.; Tm: Tachigali melionii (Harms) Zarucchi & Herend.; Gh: Gustavia hexapetala (Aubl.) J.E. Smith; Ps: Pogonophora schomburgkiana Miers ex Benth.; temp: temperate; trop: tropical; HW: hardwoods; SW: softwoods; OW: opposite wood; TW: tension wood. Red line corresponds to empirical fit
T A B LE 3 H yd ra ul ic p ro pe rt ie s a nd t he ir c or re la tio n w ith b as ic d en si ty ( dB ) c om pu te d f or d at as et 1 a nd l ite ra tu re s ou rc es (1 ),( 2). F or d at as et 1 , e ig ht d at a w ith a be rr an t ( ne ga tiv e) g as c on te nt va lu es w er e r em ov ed f ro m t he a na ly si s Ma te ria l n HG C or re la tio n w ith dB FG C or re la tio n w ith dB SG C or re la tio n w ith dB Av er ag e Ra nge Sig n R 2 Av er ag e Ra nge Sig n R 2 Av er ag e Ra nge Sig n R 2 D at as et 1 223 4 39 .4 13 –7 3 (a) –* * 0.0 56 20 .6 0– 63 (a) — ** 0. 33 7 52 .1 15–8 8 (a) ns . 0 Tr opic al ha rd w oo ds (1 ) 58 41 .8 20 –7 6 (b) –* * 0. 45 6 25 .2 3–7 3 (b) — ** 0. 69 4 50 .6 11– 94 (b) − ** 0. 20 6 Tr opic al ha rd w oo ds (2) 52 41 .7 22 –7 7 (b) ns . 0.0 06 22 .5 0–5 9 (b) — ** 0. 20 3 57. 2 3–9 5 (b) +* 0.0 80 Tem per at e h ar dw . sa pw. (2) 31 41 .4 24 –6 3 (b) –* 0. 141 26 .2 8– 49 (b) — ** 0. 342 50 .1 16 –8 8 (b) ns . 0.0 51 Tem per at e h ar dw . he ar tw . (2) 32 40 .9 25 –69 (b) ns . 0.0 16 25 .9 8–5 5 (b) ns . 0.0 12 50 .4 17– 98 (b) ns . 0.0 73 Tem per at e s of tw . sa pw. (2) 26 56 .3 16 –7 7 (b) ns . 0.0 47 44 .4 2– 68 (b) ns . 0.1 05 71 .2 3–9 8 (b) ns . 0.0 03 Tem per at e s of tw . he ar tw . (2) 29 24 .4 13 –5 2 (b) ns . 0.0 04 12 .4 0–3 8 (b) ns . 0.0 07 19 .9 1– 68 (b) ns . 0 HG : v ol um et ric w ate r c onte nt , FG : f re e v ol um et ric w at er c on te nt , SG : d eg re e o f l um en s at ur at io n o f g re en w oo d, H ar dw .: h ar dw oo d ( an gi os pe rm ) s pe ci es ; S of tw .: s of tw oo d ( gy m no sp er m ) s pe ci es ; S ap w .: sa pw oo d s amp le s; H ea rt w .: he ar tw oo d s amp le s. n : n um be r o f s pe ci m en s ( D at as et 1 ) o r s pe ci es ( 1 a nd 2 ). Ra ng e: r an ge o f v al ue s ( a) f or 9 5% o f d at a; ( b) f or a ll d at a. (1 ) Poo rt er , L . ( 20 08 ) T he r el at io ns hi ps o f w oo d, g as a nd w at er f ra ct io ns o f t re e s te m s t o p er fo rm an ce a nd l ife h is to ry v ar ia tio n i n t ro pi ca l t re es . A nn al s o f B ot an y, 10 2, 3 67– 37 5. (2) F or es t P ro du ct L ab or at or y (2 01 0) W oo d h an db oo k – W oo d a s a n e ng in ee rin g m at er ia l. G en era l T ec hn ic al R ep or t F PL ‐G TR ‐1 90 (e d. W .U .S . M ad is on ), p p. 5 08 . St at is tic al s ig ni fic an ce o f c or re la tio ns i s i nd ic at ed b y n s: p > 0. 05 , * : p < 0 .0 5, a nd * *: p < 0.0 1.
(Almeras & Fournier, 2009), but they also induce a lower specific
modulus. Here, the positioning along the E/d axis reveals a trade‐off
between two mechanical functions of wood: providing the stem with high stiffness or providing it with a motor system. Other typical ex‐ amples of occurrence of wood with low specific modulus are juvenile wood (Lachenbruch et al., 2011) found in young stem or in the core of older stems, and so‐called flexure wood (Telewski, 1989) sometimes found in trees growing in windy conditions. Both these woods have a large microfibril angle, reducing their stiffness, but also probably increasing their deformability, that is, their capacity to undergo large deformations without damage. A large wood deformability increases the overall flexibility of the stem and allows for the reduction of winds loads (or other external loads such as falling trees) by geometric
reconfiguration. In this instance, the positioning along the E/d axis ex‐
presses a trade‐off between mechanical stress‐resistant and stress‐ avoidant strategies. Data that we have about mechanical properties of wood are mostly limited to elastic modulus, and very little is known about the green wood behaviour in rupture although this parameter is essential for the tree survival to bending loads. If a low value of wood specific modulus may be useful in small trees or large trees re‐ lying on the stress‐avoidant strategy against wind, high modulus of rupture is presumably always useful for woody plants.
4.5 | Ecological significance of mechanistic and
statistical independences among wood traits:
advocating the use of physically independent traits
Based on physical relationships between basic density and other wood traits, we advocate the use of three mechanistically
independent traits (dB, SG and E/d) as relevant wood traits to investi‐
gate the spectrum of life strategies and functional diversity of trees.
The method we used to define E/d from EG and dB from mecha‐
nistic models of cellular material could be extended to any mechan‐ ical or hydraulic property. In cellular solids, density is a basic trait, and theoretical scaling laws of tissue properties vs. density can be derived from material physics (Gibson & Ashby, 1997). The resid‐ ual variation from these theoretical scaling laws observed in nature along ecological gradients bring relevant information about species adaptation even if no direct data about tissue anatomy or cell wall ultrastructure are available. For example, as the resistance to cav‐ itation P50 has become a common hydraulic trait measured with quite high throughput and organized in large databases (Choat et al., 2012), it would be interesting to design a robust physical model of this trait combining approaches of Hacke, Sperry, Pockman, Davis, and McCulloh (2001) and current developments at the cell wall level (Tixier et al., 2014) to infer theoretically what is the underly‐ ing information born by the residual variation of the moderate cor‐
relation observed between P50 and dB (Westoby & Wright, 2006).
Many recent works in wood ecology take inspiration from previous works of wood anatomists (Carlquist, 2001) to interpret variations of wood structural traits as functional adaptations (Beeckman, 2016). Environmental and phylogenetic variations of vessel frequencies and size (Lachenbruch & McCulloh, 2014; Zanne et al., 2010), axial and radial parenchyma (Zheng & Martínez‐Cabrera, 2013), microfibril angle (Read et al., 2011) are then discussed. Generalizing the way physiologists use prediction of maximum conductance by the fourth power of conduit diameters, using biophysical framework to design metrics of functionally significant and theoretically independent
T A B L E 4 Wood specific modulus (E/d) and its correlation with basic density (dB) computed for dataset 2 and different literature
sources(1),(2),(3),(4) N Method E/d SD Correlation with dB R2 Sign Temperate softwoods(1) 69 SB 20.9 3.28 0.048 ns Temperate softwoods(2) 37 SB 18.6 2.66 0.002 ns Temperate hardwoods(1) 71 SB 17.4 2.71 0.223 **
Temp. + trop. hardwoods(2) 138 SB 17.9 3.09 0.000 ns
Tropical hardwoods(1) 67 SB 19.5 3.62 0.000 ns Tropical hardwoods(3) 103 SB 19.5 3.68 0.010 ns Tropical hardwoods(4) 20 SB 20.2 3.46 0.010 ns Dataset 2 10 R 25.8 2.58 0.130 ns McLean_OW 6 ST 19.9 6.37 0.264 ns McLean_TW 6 ST 24.2 7.78 0.023 ns Method of measurement is SB: static bending; R: resonance measurement; ST: quasi‐static tensile test on a DMA device. OW: opposite wood; TW: tension wood; N: number of species; SD: standard deviation.
(1)Forest Product Laboratory (2010) Wood handbook – Wood as an engineering material. General Technical Report FPL‐GTR‐190 (ed. W.U.S. Madison),
pp. 508.; (2)Niklas, K.J. & Spatz, H.‐C. (2010) Worldwide correlations of mechanical properties and green wood density. American Journal of Botany, 97,
1587–1594.; (3)Chudnoff, M. (1979) Tropical timbers of the world.; (4)database of Brazilian wood properties available online (http://www.remade.com.br)
and McLean McLean, J.P., Arnould, O., Beauchene, J. & Clair, B. (2012) The effect of the G‐layer on the viscoelastic properties of tropical hardwoods.
Annals of Forest Science, 69, 399–408.
traits, instead of analysing roughly the whole set of traits measured, is likely to contribute to identification of growth strategies among the large functional diversity of woods.
ACKNOWLEDGEMENTS
This work was supported by a grant overseen by the French National Research Agency to the Woodiversity (ANR‐05‐BDIV‐0012‐04) and Bridge (ANR‐06‐BDIV‐0004) projects. The UMR1092 and EcoFoG are supported by a grant overseen by the French National Research Agency (ANR) as part of the “Investissements d’Avenir” program (ANR‐11‐LABX‐0002‐01, Lab of Excellence ARBRE) and (CEBA, ref. ANR‐10‐LABX‐25‐01), respectively. Authors would also like to thank the late A. Thibaut for help with experimental measure‐ ments performed in the framework of Bridge project.
AUTHORS’ CONTRIBUTIONS
J.D., B.C. and J.B. collected the data; J.D. and T.A. analysed the data; J.D., T.A. and M.F. led the writing of the manuscript. All au‐ thors contributed critically to the drafts and gave final approval for publication.
DATA ACCESSIBILIT Y
Data available from the Dryad Digital Repository: https://doi. org/10.5061/dryad.t775334 (Dlouhá et al., 2018).
ORCID
Jana Dlouhá http://orcid.org/0000‐0002‐9282‐639X
REFERENCES
Almeras, T., & Fournier, M. (2009). Biomechanical design and long‐term stability of trees: Morphological and wood traits involved in the bal‐ ance between weight increase and the gravitropic reaction. Journal
of Theoretical Biology, 256, 370–381. https://doi.org/10.1016/j.
jtbi.2008.10.011
Baraloto, C., Paine, C. E. T., Patino, S., Bonal, D., Herault, B., & Chave, J. (2010). Functional trait variation and sampling strategies in spe‐ cies‐rich plant communities. Functio, 24(1), 208–216. https://doi. org/10.1111/j.1365‐2435.2009.01600.x
Baraloto, C., Timothy Paine, C. E., Poorter, L., Beauchene, J., Bonal, D., Domenach, A.‐M., … Chave, J. (2010). Decoupled leaf and stem economics in rain forest trees. Ecology Letters, 13(11), 1338–1347. https://doi.org/10.1111/j.1461‐0248.2010.01517.x
Barnard, D. M., Meinzer, F. C., Lachenbruch, B., McCulloh, K. A., Johnson, D. M., & Woodruff, D. R. (2011). Climate‐related trends in sapwood biophysical properties in two conifers: Avoidance of hydraulic dys‐ function through coordinated adjustments in xylem efficiency, safety and capacitance. Plant Cell and Environment, 34, 643–654. https://doi.org/10.1111/j.1365‐3040.2010.02269.x
Barnett, J., & Jeronimidis, G. (2003). Wood quality and its biological basis. New York: Wiley‐Blackwell.
Bastin, J.‐F., Fayolle, A., Tarelkin, Y., Van den Bulcke, J., de Haulleville, T., Mortier, F., … De Cannière, C. (2015). Wood specific gravity variations
and biomass of central african tree species: The simple choice of the outer wood. PLoS One, 10, e0142146. https://doi.org/10.1371/jour‐ nal.pone.0142146
Bates, D., Maechler, M., Bolker, B., & Walker, S. (2015). Fitting linear mixed‐effects models using lme4. Journal of Statistic Software, 67(1), 1–48. https://doi.org/10.18637/jss.v067.i01
Beeckman, H. (2016). Wood anatomy and trait‐based ecology. Iawa
Journal, 37, 127–151. https://doi.org/10.1163/22941932‐20160127
Brancheriau, L., & Bailleres, H. (2002). Natural vibration analysis of clear wooden beams: A theoretical review. Wood Science and Technology,
36, 347–365. https://doi.org/10.1007/s00226‐002‐0143‐7
Brémaud, I. (2006). Diversity of woods used or usable in musical instru‐
ments making. Mechanic of materials. Montpellier, France: University
of Montpellier II.
Brémaud, I., El Kaïm, Y., Guibal, D., Minato, K., Thibaut, B., & Gril, J. (2012). Characterisation and categorisation of the diversity in viscoelastic vi‐ brational properties between 98 wood types. Annals of Forest Science,
69(3), 373–386. https://doi.org/10.1007/s13595‐011‐0166‐z
Carlquist, S. (2001). Comparative wood anatomy: Systematic, ecolog‐
ical, and evolutionary aspects of dicotyledon wood. Springer series in wood science. Berlin, New York: Springer‐Verlag. https://doi.
org/10.1007/978‐3‐662‐04578‐7
Chave, J., Coomes, D., Jansen, S., Lewis, S. L., Swenson, N. G., & Zanne, A. E. (2009). Towards a worldwide wood eco‐ nomics spectrum. Ecology Letters, 12, 351–366. https://doi. org/10.1111/j.1461‐0248.2009.01285.x
Choat, B., Jansen, S., Brodribb, T. J., Cochard, H., Delzon, S., Bhaskar, R., … Zanne, A. E. (2012). Global convergence in the vulnerability of forests to drought. Nature, 491, 752–755. https://doi.org/10.1038/ nature11688
Dlouhá, J., Alméras, T., Beauchêne, J., Clair, B., & Fournier, M. (2018). Data from: Biophysical dependences among functional wood traits.
Dryad Digital Repository, https://doi.org/10.5061/dryad.t775334
Dlouha, J., Almeras, T., & Clair, B. (2012). Representativeness of wood biomechanical properties measured after storage in different con‐ ditions. Trees‐Structure and Function, 26, 695–703. https://doi. org/10.1007/s00468‐011‐0636‐9
Donaldson, L. A., Grace, J., & Downes, G. M. (2004). Within‐tree variation in anatomical properties of compression wood in radiata pine. Iawa
Journal, 25, 253–271. https://doi.org/10.1163/22941932‐90000364
Evans, R., & Ilic, J. (2001). Rapid prediction of wood stiffness from micro‐ fibril angle and density. Forest Products Journal, 51, 53–57.
Fortunel, C., Fine, P. V. A., & Baraloto, C. (2012). Leaf, stem and root tissue strategies across 758 Neotropical tree species. Functional Ecology,
26, 1153–1161. https://doi.org/10.1111/j.1365‐2435.2012.02020.x
Fortunel, C., Ruelle, J., Beauchêne, J., Fine, P. V. A., & Baraloto, C. (2014). Wood specific gravity and anatomy of branches and roots in 113 Amazonian rainforest tree species across environmental gradients. New Phytologist, 202, 79–94. https://doi.org/10.1111/ nph.12632
Fournier, M., Dlouha, J., Jaouen, G., & Almeras, T. (2013). Integrative biomechanics for tree ecology: Beyond wood density and strength.
Journal of Experimental Botany, 64, 4793–4815. https://doi.
org/10.1093/jxb/ert279
Gartner, B. L., Moore, J. R., & Gardiner, B. A. (2004). Gas in stems: Abundance and potential consequences for tree biomechan‐ ics. Tree Physiology, 24, 1239–1250. https://doi.org/10.1093/ treephys/24.11.1239
van Gelder, H. A., Poorter, L., & Sterck, F. J. (2006). Wood mechan‐ ics, allometry, and life‐history variation in a tropical rain for‐ est tree community. New Phytologist, 171, 367–378. https://doi. org/10.1111/j.1469‐8137.2006.01757.x
Gibson, L. J., & Ashby, M. F. (1997). Cellular solids. Structure and properties (2ème ed.). Cambridge, UK: Cambridge University Press. https://doi. org/10.1017/CBO9781139878326
Goldstein, G., Andrade, J. L., Meinzer, F. C., Holbrook, N. M., Cavelier, J., Jackson, P., & Celis, A. (1998). Stem water storage and diurnal patterns of water use in tropical forest canopy trees. Plant Cell and Environment,
21(4), 397–406. https://doi.org/10.1046/j.1365‐3040.1998.00273.x
Gourlet‐Fleury, S., Guehl, J.‐M., & Laroussinie, O. (2004). Ecology and
management of a neotropical rainforest: Lessons drawn from Paracou, a long‐term experimental research site in French Guiana. Paris, France:
Elsevier.
Hacke, U. G., Sperry, J. S., Pockman, W. T., Davis, S. D., & McCulloh, K. A. (2001). Trends in wood density and structure are linked to pre‐ vention of xylem implosion by negative pressure. Oecologia, 126, 457–461. https://doi.org/10.1007/s004420100628
Haines, D. W., Leban, J. M., & Herbe, C. (1996). Determination of Young's modulus for spruce, fir and isotropic materials by the resonance flex‐ ure method with comparisons to static flexure and other dynamic methods. Wood Science and Technology, 30, 253–263.
Hao, G. Y., Wheeler, J. K., Holbrook, N. M., & Goldstein, G. (2013). Investigating xylem embolism formation, refilling and water storage in tree trunks using frequency domain reflectometry. Journal of Experimental Botany,
64, 2321–2332. https://doi.org/10.1093/jxb/ert090
Hietz, P., Rosner, S., Hietz‐Seifert, U., & Wright, S. J. (2017). Wood traits related to size and life history of trees in a Panamanian rainforest.
New Phytologist, 213, 170–180. https://doi.org/10.1111/nph.14123
Holbrook, N. M. (1995). Stem water storage. In B. Gartner (Ed.), Plant
Stems (pp. 151–174). San Diego, CA: Elsevier. https://doi.org/10.1016/
B978‐012276460‐8/50009‐6
Hori, R., Suzuki, H., Kamiyama, T., & Sugiyama, J. (2003). Variation of mi‐ crofibril angles and chemical composition: Implication for functional properties. Journal of Materials Science Letters, 22, 963–966. https:// doi.org/10.1023/A:1024604728118
Jaouen, G., Almeras, T., Coutand, C., & Fournier, M. (2007). How to determine sapling buckling risk with only a few measurements.
American Journal of Botany, 94, 1583–1593. https://doi.org/10.3732/
ajb.94.10.1583
Kellogg, R. M., & Wangaard, F. F. (1969). Variation in the cell‐wall density of wood. Wood and Fiber Science, 1, 180–204.
King, D. A., Davies, S. J., Tan, S., & Noor, N. S. M. (2006). The role of wood density and stem support costs in the growth and mortal‐ ity of tropical trees. Journal of Ecology, 94, 670–680. https://doi. org/10.1111/j.1365‐2745.2006.01112.x
Kunstler, G., Falster, D., Coomes, D. A., Hui, F., Kooyman, R. M., Laughlin, D. C., … Westoby, M. (2016). Plant functional traits have globally con‐ sistent effects on competition. Nature, 529, 204‐U174. https://doi. org/10.1038/nature16476
Lachenbruch, B., & McCulloh, K. A. (2014). Traits, properties, and perfor‐ mance: How woody plants combine hydraulic and mechanical func‐ tions in a cell, tissue, or whole plant. New Phytologist, 204, 747–764. https://doi.org/10.1111/nph.13035
Lachenbruch, B., Moore, J. R., & Evans, R. (2011). Radial variation in wood structure and function in woody plants, and hypotheses for its occur‐ rence. In F. C. Meinzer, B. Lachenbruch, & T. E. Dawson (Eds.), Size‐
and age‐related changes in tree structure and function (pp. 121–164).
Netherlands: Springer. https://doi.org/10.1007/978‐94‐007‐1242‐3 Larjavaara, M., & Muller‐Landau, H. C. (2010). Rethinking the value of
high wood density. Functional Ecology, 24, 701–705. https://doi. org/10.1111/j.1365‐2435.2010.01698.x
Longuetaud, F., Mothe, F., Santenoise, P., Diop, N., Dlouha, J., Fournier, M., & Deleuze, C. (2017). Patterns of within‐stem variations in wood specific gravity and water content for five temperate tree species. Annals of Forest Science, 74(3), 64. https://doi.org/10.1007/ s13595‐017‐0657‐7
McLean, J. P., Arnould, O., Beauchene, J., & Clair, B. (2012). The effect of the G‐layer on the viscoelastic properties of tropical hardwoods.
Annals of Forest Science, 69, 399–408. https://doi.org/10.1007/
s13595‐011‐0164‐1
McLean, J. P., Zhang, T., Bardet, S., Beauchene, J., Thibaut, A., Clair, B., & Thibaut, B. (2011). The decreasing radial wood stiffness pattern of some tropical trees growing in the primary forest is reversed and in‐ creases when they are grown in a plantation. Annals of Forest Science,
68, 681–688. https://doi.org/10.1007/s13595‐011‐0085‐z
Medhurst, J., Downes, G., Ottenschlaeger, M., Harwood, C., Evans, R., & Beadle, C. (2012). Intra‐specific competition and the radial develop‐ ment of wood density, microfibril angle and modulus of elasticity in plantation‐grown Eucalyptus nitens. Trees‐Structure and Function, 26, 1771–1780. https://doi.org/10.1007/s00468‐012‐0746‐z
Meinzer, F. C., Johnson, D. M., Lachenbruch, B., McCulloh, K. A., & Woodruff, D. R. (2009). Xylem hydraulic safety margins in woody plants: Coordination of stomatal control of xylem tension with hy‐ draulic capacitance. Functional Ecology, 23, 922–930. https://doi. org/10.1111/j.1365‐2435.2009.01577.x
Moles, A. T. (2018). Being John Harper: Using evolutionary ideas to improve understanding of global patterns in plant traits. Journal of
Ecology, 106, 1–18. https://doi.org/10.1111/1365‐2745.12887
Niklas, K. J. (1993). Influence of tissue density‐specific mechanical prop‐ erties on the scaling of plant height. Annals of Botany, 72, 173–179. https://doi.org/10.1006/anbo.1993.1096
Niklas, K. J., & Spatz, H.‐C. (2010). Worldwide correlations of mechanical properties and green wood density. American Journal of Botany, 97, 1587–1594. https://doi.org/10.3732/ajb.1000150
Niklas, K. J., & Spatz, H.‐C. (2012). Mechanical properties of wood dis‐ proportionately increase with increasing density. American Journal of
Botany, 99, 169–170. https://doi.org/10.3732/ajb.1100567
Nogueira, E. M., Fearnside, P. M., & Nelson, B. W. (2008). Normalization of wood density in biomass estimates of Amazon forests. Forest
Ecology and Management, 256, 990–996. https://doi.org/10.1016/j.
foreco.2008.06.001
Osazuwa‐Peters, O. L., Wright, S. J., & Zanne, A. E. (2017). Linking wood traits to vital rates in tropical rainforest trees: Insights from compar‐ ing sapling and adult wood. American Journal of Botany, 104, 1464– 1473. https://doi.org/10.3732/ajb.1700242
Osunkoya, O. O., Omar‐Ali, K., Amit, N., Dayan, J., Daud, D. S., & Sheng, T. K. (2007). Comparative height‐crown allometry and mechanical de‐ sign in 22 tree species of Kuala Belalong rainforest, Brunei, Borneo.
American Journal of Botany, 94, 1951–1962. https://doi.org/10.3732/
ajb.94.12.1951
Pineda‐Garcia, F., Paz, H., & Meinzer, F. C. (2013). Drought resistance in early and late secondary successional species from a tropical dry for‐ est: The interplay between xylem resistance to embolism, sapwood water storage and leaf shedding. Plant Cell and Environment, 36, 405– 418. https://doi.org/10.1111/j.1365‐3040.2012.02582.x
Poorter, L. (2008). The relationships of wood‐, gas‐ and water fractions of tree stems to performance and life history variation in tropical trees. Annals of Botany, 102, 367–375. https://doi.org/10.1093/aob/ mcn103
Poorter, L., McDonald, I., Alarcon, A., Fichtler, E., Licona, J. C., Pena‐ Claros, M., … Sass‐Klaassen, U. (2010). The importance of wood traits and hydraulic conductance for the performance and life his‐ tory strategies of 42 rainforest tree species. New Phytologist, 185, 481–492. https://doi.org/10.1111/j.1469‐8137.2009.03092.x Popper, R., Niemz, P., & Torres, M. (2006). Einfluss des Extraktstoffanteils
ausgewählter fremdländischer Holzarten auf deren Gleichgewichtsfeuchte. Holz als Roh‐ und Werkstoff, 64, 491–496. https://doi.org/10.1007/s00107‐006‐0132‐x
R Core Team. (2017). R: A Language and Environment for Statistical
Computing. Vienna, Austria: R Core Team. https://doi.org/10.1038/
sj.hdy.6800737
Read, J., Evans, R., Sanson, G. D., Kerr, S., & Jaffre, T. (2011). Wood prop‐ erties and trunk allometry of co‐occurring rainforest canopy trees in a cyclone‐prone environment. American Journal of Botany, 98, 1762– 1772. https://doi.org/10.3732/ajb.1100080
Richardson, S. J., Allen, R. B., Buxton, R. P., Easdale, T. A., Hurst, J. M., Morse, C. W., … Peltzer, D. A. (2013). Intraspecific relationships among wood density, leaf structural traits and environment in four co‐occurring species of Nothofagus in New Zealand. PLoS One, 8, e58878. https://doi.org/10.1371/journal.pone.0058878
Ruelle, J., Clair, B., Beauchene, J., Prevost, M. F., & Fournier, M. (2006). Tension wood and opposite wood in 21 tropical rain forest species 2. Comparison of some anatomical and ultrastructural criteria. Iawa
Journal, 27, 341–376. https://doi.org/10.1163/22941932‐90000159
Russo, S. E., Jenkins, K. L., Wiser, S. K., Uriarte, M., Duncan, R. P., & Coomes, D. A. (2010). Interspecific relationships among growth, mortality and xylem traits of woody species from New Zealand. Functional Ecology,
24, 253–262. https://doi.org/10.1111/j.1365‐2435.2009.01670.x
Salmen, L., & Burgert, I. (2009). Cell wall features with regard to mechan‐ ical performance. A review COST Action E35 2004‐2008: Wood ma‐ chining ‐ micromechanics and fracture. Holzforschung, 63, 121–129. https://doi.org/10.1515/hf.2009.011
Sarmiento, C., Patiño, S., Paine, C. E. T., Beauchêne, J., Thibaut, A., & Baraloto, C. (2011). Within‐individual variation of trunk and branch xylem density in tropical trees. American Journal of Botany, 98, 140– 149. https://doi.org/10.3732/ajb.1000034
Scholz, F. G., Bucci, S. J., Goldstein, G., Meinzer, F. C., Franco, A. C., & Miralles‐Wilhelm, F. (2008). Temporal dynamics of stem expan‐ sion and contraction in savanna trees: Withdrawal and recharge of stored water. Tree Physiology, 28, 469–480. https://doi.org/10.1093/ treephys/28.3.469
Telewski, F. W. (1989). Structure and function of flexure wood in
Abies fraseri. Tree Physiology, 5, 113–121. https://doi.org/10.1093/
treephys/5.1.113
Tixier, A., Herbette, S., Jansen, S., Capron, M., Tordjeman, P., Cochard, H., & Badel, E. (2014). Modelling the mechanical behaviour of pit mem‐ branes in bordered pits with respect to cavitation resistance in an‐ giosperms. Annals of Botany, 114, 325–334. https://doi.org/10.1093/ aob/mcu109
Westoby, M., & Wright, I. J. (2006). Land‐plant ecology on the basis of functional traits. Trends in Ecology & Evolution, 21, 261–268. https:// doi.org/10.1016/j.tree.2006.02.004
Wimmer, R., Downes, G. M., & Evans, R. (2002). Temporal variation of microfibril angle in Eucalyptus nitens grown in different irrigation
regimes. Tree Physiology, 22, 449–457. https://doi.org/10.1093/ treephys/22.7.449
Yang, J. L., & Evans, R. (2003). Prediction of MOE of eucalypt wood from microfibril angle and density. Holz Als Roh‐Und Werkstoff, 61, 449– 452. https://doi.org/10.1007/s00107‐003‐0424‐3
Yoshida, M., Ohta, H., Yamamoto, H., & Okuyama, T. (2002). Tensile growth stress and lignin distribution in the cell walls of yellow pop‐ lar, Liriodendron tulipifera Linn. Trees, 16, 457–464. https://doi. org/10.1007/s00468‐002‐0186‐2
Zanne, A. E., Westoby, M., Falster, D. S., Ackerly, D. D., Loarie, S. R., Arnold, S. E. J., & Coomes, D. A. (2010). Angiosperm wood structure: Global patterns in vessel anatomy and their relation to wood density and potential conductivity. American Journal of Botany, 97, 207–215. https://doi.org/10.3732/ajb.0900178
Zheng, J., & Martínez‐Cabrera, H. I. (2013). Wood anatomical correlates with theoretical conductivity and wood density across China: Evolutionary evidence of the functional differentiation of axial and radial parenchyma. Annals of Botany, 112, 927–935. https://doi. org/10.1093/aob/mct153
Ziemińska, K., Westoby, M., & Wright, I. J. (2015). Broad anatomical vari‐ ation within a narrow wood density range—A study of twig wood across 69 Australian angiosperms. PLoS One, 10(4), e0124892. Retrieved from https://doi.org/10.1371/journal.pone.0124892