HAL Id: hal-02296368
https://hal.archives-ouvertes.fr/hal-02296368
Submitted on 25 Sep 2019HAL is a multi-disciplinary open access archive for the deposit and dissemination of sci-entific research documents, whether they are pub-lished or not. The documents may come from teaching and research institutions in France or abroad, or from public or private research centers.
L’archive ouverte pluridisciplinaire HAL, est destinée au dépôt et à la diffusion de documents scientifiques de niveau recherche, publiés ou non, émanant des établissements d’enseignement et de recherche français ou étrangers, des laboratoires publics ou privés.
Impact of local soil and subsoil conditions on
inter-individual variations in tree responses to drought:
insights from Electrical Resistivity Tomography
S. D. Carrière, J. Ruffault, F. Pimont, C. Doussan, G Simioni, Konstantinos
Chalikakis, J.-M Limousin, I Scotti, F Courdier, C.-B Cakpo, et al.
To cite this version:
S. D. Carrière, J. Ruffault, F. Pimont, C. Doussan, G Simioni, et al.. Impact of local soil and subsoil conditions on inter-individual variations in tree responses to drought: insights from Elec-trical Resistivity Tomography. Science of the Total Environment, Elsevier, 2020, 698, pp.134247. �10.1016/j.scitotenv.2019.134247�. �hal-02296368�
1
Impact of local soil and subsoil conditions on inter-individual variations in tree responses to drought: insights from Electrical Resistivity Tomography Accepted in Science of the Total Environment in September 2019
https://www.sciencedirect.com/science/article/pii/S0048969719342305?via%3Dihub
Authors:
S.D. Carrière1, J. Ruffault2, F. Pimont2, C. Doussan1, G. Simioni2, K. Chalikakis3, J.-M. Limousin4, I. Scotti2, F. Courdier2, C.-B. Cakpo5, H. Davi2, N.K. Martin St-Paul2
Abstract:
Inter-individual variability of tree drought responses within a stand has received little
attention. Here we explore whether the spatial variations in soil/subsoil properties assessed through electrical resistivity tomography (ERT) could explain variations in drought response traits among trees.
We used ERT to compute the percent variation in resistivity (PVR) between dry and wet
conditions as an indicator of spatial variability in total available water content. PVR was computed in two different depth ranges (0-2 and 2-5 m) for eleven Quercus ilex stools in a Mediterranean forest stand. PVR values were compared to biological traits, including tree water status (predawn water potential (Ψ)), leaf traits (δ13C, leaf mass area (LMA)), and canopy defoliation measured after intense drought.
We found significant correlations between PVR and biological variables. For Ψ, the nature and strength of the correlations vary according to the level of drought intensity. The correlation between Ψ and PVR was positive during well-watered conditions in the upper layer (0-2 m) and during water-limited conditions in the deeper layer (2-5 m). During most severe droughts, however, the Ψ was negatively correlated with PVR in the upper layer. Trees with lower PVR in the upper layer were also associated with water use efficiency (higher δ13
C), higher LMA, and a lower level of defoliation after extreme drought.
Overall, our results indicate that local differences in soil/subsoil properties affect tree
response to drought and suggest that less favorable soil/subsoil conditions (lower PVR) can lead to lower water stress during the driest period and to lower defoliation after extreme drought. Plausible explanations for this better acclimation include higher stomatal regulation and improved deep soil and subsoil water exploration by trees located in more adverse conditions. We encourage the development of ERT in ecological studies to further explore the interrelated relationships between soil/subsoil, climate, and tree functioning.
Keywords: drought response, tree water status, leaf traits, hydrogeophysics, Mediterranean forests, ERT
Affiliations:
1
INRA, UMR 1114 EMMAH, Domaine Saint Paul, INRA Centre de recherche PACA, 228 route de l'Aérodrome, CS 40509, Domaine Saint-Paul, Site Agroparc, France,
2
INRA, URFM, , Domaine Saint Paul, INRA Centre de recherche PACA, 228 route de l'Aérodrome, CS 40509, Domaine Saint-Paul, Site Agroparc, France,
3
UAPV, UMR 1114 EMMAH, 301 rue Baruch de Spinoza, BP 21239 84911 Avignon Cedex 9, France.
4
CNRS, UMR 5175 CEFE, 1919, route de Mende, sur le campus du CNRS, 34293 Montpellier 5, France.
5
INRA, PSH, , Domaine Saint Paul, INRA Centre de recherche PACA, 228 route de l'Aérodrome, CS 40509, Domaine Saint-Paul, Site Agroparc, France,
2
INTRODUCTION
Anticipating drought impacts on forests represents a crucial challenge in the context of climate change (Anderegg et al., 2016). So far, most modeling and empirical approaches used to study and project drought impact on forests neglect the variability in the tree environment within a stand and the variability of biological responses between individuals of the same species. However, water deficit and subsequent drought-induced damage are often
reported as being heterogeneous at the local scale (Lloret et al., 2004; Cailleret et al., 2014, 2017; Tai et al., 2017). Accounting for stand spatial variability could therefore be crucial to improving our understanding of population adaptation and to implementing new management practices (Oddou-Muratorio and Davi, 2014; Hart et al., 2016; Bontemps et al., 2017).
Two different but interrelated factors might explain why drought-induced damage varies among trees at the stand scale: physiological and morphological differences between trees on the one hand (Cailleret et al., 2017; Voltas et al., 2015; Zribi et al., 2016) and micro-site effects related to total available water (TAW) variability for plants on the other hand (Lloret et al., 2004; Cailleret et al., 2014; Tai et al., 2017). From a functional point of view, drought-induced damage to trees results from soil water deficit, which leads to decreased soil and plant water potential and triggers xylem embolism, the failure of plant water transport, and its desiccation (Cruiziat et al., 2002; Choat et al., 2018). Consequently, individuals located in areas with higher TAW in the upper layer are expected to exhibit higher water potential during drought and therefore show less damage than those located on soil/subsoil with less available water. However, trees can adjust their water use in response to water deficit, and thus alleviate the effects of drought stress. The acclimation of water use occurs at various temporal scales, through a suite of processes that helps to maintain the water potential within a hydraulic safety range during drought (Maseda and Fernandez, 2006; Martin-StPaul et al., 2013). On the short-time scale (days to seasons), stomatal closure is the primary process for reducing transpiration and thus limiting water potential decreases (Martin-StPaul et al., 2017). Moreover, trees shift their active root zone towards deeper layers, as surface soil dries during the summer (Rambal, 1984; Nijland et al., 2010). At the intermediate time scale (seasons to year) structural traits such as leaf mass per area (LMA) can increase (Poorter et al. 2009) as a result of the alteration of growth processes due to drought (Misson et al., 2011; Poorter et al., 2009). To date, these changes in biological response to drought have seldom been studied at inter-individual scale.
A major reason why variability in response to water deficit has been little studied in forest stands is the challenge posed by the acquisition of high-resolution spatial TAW data over the entire soil/subsoil depth explored by roots in forest stands. A standard method for estimating TAW in ecological studies is based on textural information of the soils derived from pedological pits (e.g. Rutter and Fourt, 1965; Bailey et al., 2005; Diochon et al., 2009). This method, however, is destructive, limited in term of spatial representativeness, and cannot assess the dynamics of soil moisture content. Other local measurements of water content (e.g., gravimetric measurements on auger samplings, neutron or time domain reflectometry probes) are commonly used to monitor temporal dynamics of soil moisture in the field, but their spatial representativeness is limited in heterogeneous environments, such as the rocky subsurface of a forest (Robinson et al., 2008).
Electrical Resistivity Tomography (ERT) is a non-destructive geophysical technique that is based on the capacity of the underground to conduct electrical currents (cf. “Electrical Resistivity Tomography background” section). It is well suited to measuring spatial variations
3
in underground physical properties that affect electrical resistivity, such as soil water content. Since the investigation depth of ERT is not limited by the presence of rocks, it can survey large horizontal and vertical extents. For example, a profile extension of 100 m provides an investigation depth of 15 m. Initially developed and used in geological prospecting or geotechnical applications, ERT is also currently used for eco-environmental applications, such as hydrology (e.g. Robinson et al., 2008; Travelletti et al., 2012; Guinea et al., 2018), soil sciences, and agronomy (Al Hagrey, 2007; Samouelian et al., 2005; Srayeddin and Doussan, 2009). The electrical resistivity of the soil/subsoil is affected by various structural factors, which are more or less constant, such as the nature of the substrate (e.g. soil mineralogy, type of rock), the texture and structure. Electrical resistivity is also affected by variable factors, such as temperature, conductivity of the soil solution and water content. In particular, water content is the primary factor for temporal variation in the unsaturated zone (Samouelian et al., 2005), so that time-lapse ERT monitoring can be used for estimating variations in soil water content (e.g. Michot et al., 2003; Srayeddin and Doussan, 2009; Fan et al., 2015; Brillante et al., 2016; Rodríguez-Robles et al., 2017). In this context, factors that affect resistivity, such as the type of substrate and, particularly, its texture and structure, are expected to affect TAW estimations. However, recent work confirms the existence of correlations between electrical resistivity measurements and TAW within agricultural fields and demonstrates the potential of ERT for mapping TAW and delineating management and irrigation zones in precision agriculture (Hezarjaribi and Sourell, 2007; Hedley and Yule, 2009; Haghverdi et al., 2015; Ortuani et al., 2016). In heterogeneous systems such as vineyards, Acevedo-Opazo et al. (2010) suggested that the electrical resistivity signal could be used to predict spatial variability in vegetation greenness, water status, and yields. Other studies reported relationships between water status of individual plants and soil electrical resistivity (e.g. Brillante et al., 2015). However, despite its potential for estimating the spatial distribution of TAW, the application of ERT to heterogeneous ecosystems is still limited (Kurjak et al., 2012; Robinson et al., 2012; Jayawickreme et al., 2014; Nourtier et al., 2014). In order to bypass the complexity of converting the electrical resistivity signal in water content, it has been suggested to use a normalized variation in resistivity, expressed as percent variation in resistivity (PVR), between a wet and a dry period. Indeed, the PVR maximizes the contrast between areas with low or large variations in water content and can thus provide an estimate of TAW (e.g. Carrière et al., 2015; Brillante et al., 2016).
The aim of this study is to explore the impact of spatial variability of soil/subsoil properties estimated with ERT on variations among individual trees in terms of traits that correspond to drought response. The study was conducted on a Mediterranean “garrigue” located in a natural complex karst environment in southern France, in which the geological structure and groundwater dynamics have been intensively studied with various geophysical methods (Carrière et al., 2016). We used resistivity measurements performed on a 126 m transect, along which the physiological traits involved in tree response to drought of eleven mature Quercus ilex stools were measured. These traits included tree water status (Ψ), leaf traits (δ13
C, LMA), and tree defoliation following extreme drought. We then explored the inter-individual variability in drought traits as a function of TAW variations derived from the electrical resistivity survey.
4
MATERIAL AND METHODS Study site
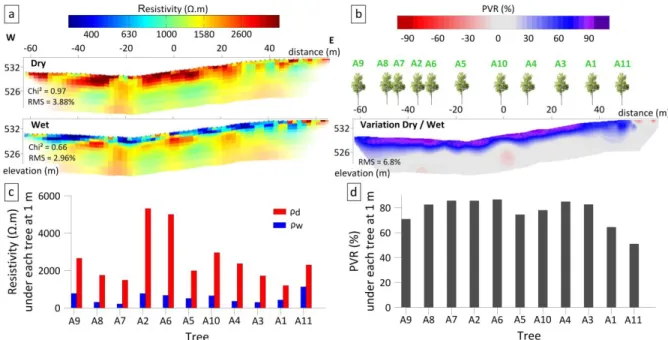
The study site is located in the Rustrel Forest in southern France (05° 27' 57.9'' E, 43° 56' 12.2'' N and elevation 520 m; Figure 1) and within the Fontaine de Vaucluse observatory is part of OZCAR (http://www.ozcar-ri.org/), the French network of critical zone observatories. The climate is Mediterranean, characterized by cool and wet winters, hot and dry summers, and a high inter-annual variability. Between 1970 and 2018, annual rainfalls ranged from 407 to 1405 mm with a mean of 909 mm. The rendzina type soil contains 50 to 60 % of coarse material (> 2 mm) and has a highly variable thickness (from 0 to > 80 cm). The forest has been managed as a coppice for centuries and the last clear cut occurred about 80 years ago. Vegetation is dominated by a sparse evergreen overstory of Quercus ilex L., which represents more than 85 % of the basal area (Figure 1). The dominant tree height is about 4 m. The understory is a sparse shrubby layer, which represents less than 15 % of the basal area and includes Buxus sempervirens, Juniperus communis, Juniperus phoenicea, Quercus pubescens, Amelanchier ovalis, and Rhamanus alaternus (Carrière et al., 2017). The Leaf Area Index (LAI), as measured along the ERT transect with hemispherical photographs following Davi et al. (2008), is about 1.85. The underground (soil and subsoil) is highly complex; the medium is heterogeneous due to numerous vertical fractures and karstified carbonate rock. Carrière et al. (2013) showed that north-south oriented faults impose the general spatial structure on geology and pedology. This is well illustrated by the west-east alternation of areas of low and high electrical resistivity values as shown in Figure 1b.
Figure 1: (a) The study site in the Mediterranean basin; (b) Experimental design: stem map of the stand; Sampled trees are labelled from A1 to A11; geophysical measurements (red crosses). The background is the apparent resistivity map, interpolated from six Electrical Resistivity Tomography cross-sections at pseudo-depth of 1 m in May 2011, (Carrière et al. 2013).
Environmental data
Drought intensity was characterized from 1970 to 2018, by using the standardized precipitation evaporation index at a six-month scale (SPEI6) according to Vicente-Serrano et al. (2010). Climatic data were derived from the French SAFRAN reanalysis (Vidal et al., 2010).
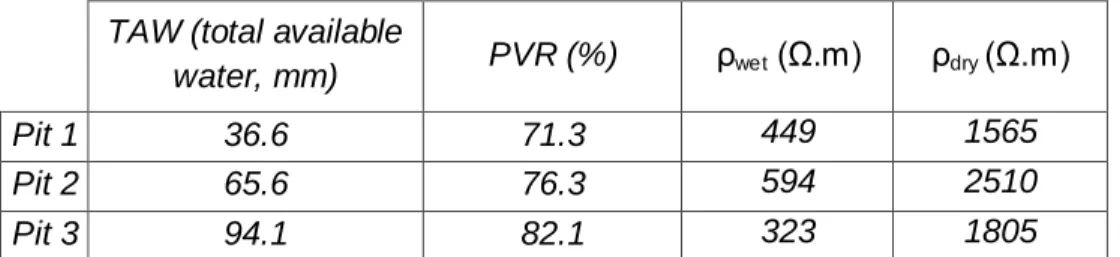
Three pedological pits were dug along the ERT transect (Figure 1). TAW was computed for the whole pit and standardized at 1m depth following Baize and Jabiol (2011) and Cailleret et al. (2014). In brief, TAW of each pit is the sum of the TAW (mm) of each horizon of the pit :
5
where V is volumetric water capacity depending on texture (see Baize and Jabiol, 2011), T is thickness of the horizon, and CE is coarse element content of the horizon (%). The detailed protocol and the description of each pit are given in protocol supplementary material S2. Electrical Resistivity Tomography
Background
ERT is a non-destructive geophysical technique that produces a 2D or 3D map of spatial variations in electrical resistivity of the subsurface below a line (2D) or a grid (3D) of electrodes installed at the soil surface. Measurement is done by injecting electrical current of known intensity into the soil through a pair of electrodes. The difference in electrical voltage generated by the current injection is measured between another pair of electrodes. Measurements are repeated along a line of electrodes at different locations and with different electrode spacing in order to prospect different depths (Dahlin, 2001; Dahlin and Zhou, 2004). This process results in a 2D map of “apparent” resistivity, which corresponds to an integration of the true resistivities of the zones prospected by the current pathways below the electrodes. The spatial distribution of “true” resistivity can then be determined by the inversion of a discretized numerical model of electrical conductivity in the subsurface, based on apparent resistivity measurements (e.g. Loke, 1999; Günther, 2004). The resulting subsurface resistivity map shows electrical resistivity variations in the subsurface.
ERT field measurements and estimation of spatial variability
ERT was conducted along a 126 m transect where apparent resistivity shows spatially marked contrasts (Figure 1b). We used an ABEM Terrameter SAS 4000 system (Dahlin, 2001) with 64 stainless steel electrodes, with a spacing of 2 m, embedded at a depth of approximately 20 cm (brown crosses, Figure 1b). The gradient array was chosen for its robustness and speed (Dahlin and Zhou, 2006). Indeed, these two advantages were important for the ERT monitoring, which allowed us to obtain the dry and wet profiles used in this paper. This protocol totals 1140 measurement points with an "a" value ranging between 2 and 10 and an "n" value ranging between 2 and 20. During acquisition, the sensor repeated and averaged every resistivity measurement several times in order to obtain a Root Mean Square (RMS) <1% at each location. DC2DinvRes software (Günther, 2004), which was designed to process time-lapse data, was used to calculate the inversion and forward simulations of ERT data. The dataset used in the paper was first presented by Carrière et al. (2015); these authors processed data using a time-lapse inversion strategy (Loke, 1999) to minimize artifacts in ERT models. Processing was done with a Gauss-Newton inversion algorithm and a "L2 type" regularization with a lambda factor of 30. Inversion of the initial time step was done in "smooth constraint" and the second time step was constrained with the initial time step using the "minimum length" option. ERT model quality is evaluated from the Chi² and RMS calculated between the raw data and the model (left part of ERT cross section, Figure 2a). The resulting resistivity map exhibited a 2 m lateral resolution and a vertical resolution that ranges gradually from 0.5 m near the surface to 1.5 m at the bottom of the profile. We applied a temperature correction for each pixel of the cross-section, following Keller et Frischknecht (1966):
ρ = ρT [1 + α (T − 25)] (2)
where ρ (Ω.m) is the electrical resistivity at the reference temperature of 25 °C, ρT (Ω.m) is
6
underground temperature, logarithmically interpolated between daily mean air temperature aboveground and water temperature at a depth of 30 m during measurement (°C).
We used the relative difference between electrical resistivities on two dates percent variation in resistivity (PVR) with different water conditions, as a proxy for TAW. The PVR was calculated as the relative resistivity difference (annotated ρ, in Ω.m) between dry (ρdry) and
wet (ρwet) cross-sections, as in Clément et al. (2010) and Robert et al. (2012):
(3)
PVR uncertainty can be estimated from the RMS of the dry and wet resistivity model as follows: Because is higher than , the RMS of is expected to be smaller than 3.88+2.96=6.8% of . Hence, the PVR uncertainties, expressed in % of are then
smaller than ±6.8%. Although these values are reasonable for a remote sensing proxy, it is important to acknowledge that variations in low PVR values (typically lower than 5%) should not be considered significant. Several ERT cross-sections were measured during 2011 at various time intervals (i.e. from monthly to hourly intervals) to capture the water content dynamics in the karst (Carrière et al., 2015). ERT measurements used in the paper were taken from a dataset obtained during a rain event in October 2011. We selected two different dates corresponding to “dry” and “wet” conditions to calculate PVR. We used PVR for the following reasons: (i) the “dry” date came after several months of drought, so that the soil and subsoil were very dry, (ii) the “wet” date was selected 2 days after heavy precipitation (230 mm within a period of 17 days), so that the soil and subsoil were resaturated, (iii) data quality was good (measurement repetition RMS < 1%), (iv) no particular erosion occurred during the rain (clay and rock contents remained stable), (v) the electrical conductivity of groundwater measured below the study site (within Rustrel's underground laboratory -http://lsbb.eu/presentation/- located 33 m below the surface in the same aquifer) was very stable (416 µS.cm-1 before rain event and 420 µS.cm-1 after rain event), (vi) the selected dates were close, separated by 2 days in autumn, thus the air and groundwater temperatures were similar for both dates. As a result, high variations of PVR were mostly related to change in water content.
In addition to PVR, we also used single resistivity profiles. Both metrics were compared to direct estimates of TAW derived from pedological pits.
Biological measurements
1- Tree selection and dendrometric measurements
Eleven Quercus ilex stools were selected along the ERT transect, at less than 3 m from the transect line, so that they were located inside the zone sampled by the ERT (Green crosses, Figure 1b). For each stool, a dominant -or co-dominant- stem, which was representative of the overall condition of the stool, was selected for measurement. Measurements included trait measurements, leaf water potential (measured in 2014 and 2015, see below), diameter at breast height, crown base height, and maximum height. In addition, after the two consecutive extreme drought episodes in 2016 and 2017 (as shown in the results section), the crown condition was estimated in January 2018 through a visual estimation of tree crown defoliation, expressed as a percentage with respect to a reference healthy tree growing on the same site (see Cailleret et al., 2014). Trees were independently inspected by two observers to reduce subjectivity and mitigate the “observer effect”. The number of stems in
7
the stool was counted. Stool leaf area index (LAI) was computed using an allometric relationship calibrated at a nearby site undergoing similar management (Rambal et al., 2004).
2-Water status
The water status of selected stems was measured on nine different dates over two summer seasons (May to October 2014 and 2015), reflecting different precipitation levels, through predawn leaf water potential measurements (Ψ), using a Scholander pressure chamber. On each date and for each tree, at least three leaves were sampled, quickly placed in a plastic bag saturated with water vapor, and stored in a cooler until measurement. Measurements were made less than one hour after sampling. Two leaves were measured and a third one was measured if the difference between the first two leaves exceeded 0.2 MPa.
We studied the relationship between electrical resistivity and predawn leaf water potential for three classes of drought corresponding to differences in ecophysiological functioning with increasing drought. The classes were defined as follows: (i) well-watered (Ψ -0.5 MPa), when species functioning was not affected (Limousin et al., 2009); (ii) Moderate drought (-2 Ψ -0.5 MPa), when leaf level gas exchanges started to decrease and growth stopped (Lempereur et al., 2015); and (iii) severe drought (Ψ - 2 MPa), when the plant was close to turgor loss and when gas exchanges were restricted to very low fluxes (Bartlett et al., 2016; Martin-StPaul et al., 2017).
For each stem, we used differences between the predawn leaf water potential under well-watered conditions and the predawn leaf water potential during driest conditions (w-d), as
an indicator of the tree’s ability to control water deficit progression throughout the summer. 3-Leaf traits
Leaf traits were measured at the beginning of 2016 for all selected stems. Measurements were made on four branches per tree, three from the upper part of the canopy (light-exposed), and the fourth from the lower part (shade branch). Each sample was then cut and separated according to different phytomeres in the laboratory. The leaves of each growth unit were scanned and the leaf area was estimated using the ImageJ software (Abràmoff et al., 2004). Samples were then oven-dried at 65 °C for 48 h, after which the dry masses of the leaves were measured. LMA was calculated as the ratio of dry mass over leaf area (in g/m²). A subsample of 5 to 10 leaves was ground using a ball mill and sent to the “Atelier des Isotopes Stables” B&PMP laboratory (INRA, Montpellier, France), where total carbon and nitrogen contents, as well as carbon isotope compositions (δ13C) were measured using a continuous flow isotope mass spectrometer (Elementar, Hanau, Germany) coupled to an elemental analyzer EA30204 (Eurovector, Milan, Italy). The abundance of 13C/12C was expressed relative to its respective International Atomic Energy Agency (IAEA) standard. Total nitrogen content was expressed either as a dry mass (Nm, g.g
-1
) or on leaf area basis using LMA (Na, g.m
-2
). Data analysis
Our aim was to determine how individual variations in tree traits involved in drought response were affected by tree-scale subsurface properties, characterized by the PVR. The PVR of each stool was estimated by laterally averaging the PVR raster within a distance of 2.5 m (corresponding to crown radius) to the stool center. Since Quercus ilex is a deep-rooted species, we integrated PVR values below each individual stool at two different depth ranges:
8
0 to 2 meters and 2 to 5 meters. Note that we performed a preliminary test using several layers from 0 to 5 meters. The test showed that the two upper layers (from 0 to 1 meter and from 1 to 2 meters) and the two deeper layers (from 2 to 3 meters and from 3 to 5 meters) showed correlation patterns similar to the physiological traits. To simplify our results, we binned together the multiple layers into two: one layer from 0 to 2 meters and a second layer from 2 to 5 meters. The choice of separation at a depth of 2 m is also supported by the results of Carrière et al. (2013) which showed by combining ERT and ground penetrating radar that less-weathered limestone is present near this depth. It should be noted here that changing the size of the lateral buffer and the vertical layer by 1m did not significantly change the results (not shown). We did not use PVR estimations below a depth of 5 m because model uncertainty is greater in the lower part (coverage index from DC2DinvRes < 1; Carrière et al., 2015).
We used Spearman correlations (which are robust to low sample size and for non-linear relationships) to explore the statistical relationship between stool PVR and the traits described above. Relationships between PVR and leaf water potential were analyzed separately in the three drought classes defined above (no drought, moderate drought, severe drought). While the “no drought” and “severe drought” categories correspond to a single date, the moderate drought class is an average of 6 dates. A complementary Bayesian analysis was used to assess the relationships between leaf water potential and PVR.
Figure 2: Electrical Resistivity Tomography (ERT) results. (a) Inverted ERT models for the “dry” and “wet” dates (respectively before and after a rain event in November 2011), involved in PVR computation (equation 2); Gradient arrays, 64 electrodes; ERT model uncertainty, based on current line density, is represented by the color attenuations at the edges and the bottom of the resistivity cross-section. (b) Percent variation in resistivity (PVR) between the two resistivity models (dry/wet). (c)
Resistivity averaged over 1 m under each tree in dry (ρd) and wet period (ρw). (d) PVR averaged over
9
RESULTS
Spatial variability in soil/subsoil properties with ERT
The driest and wettest cross-sections measured during the year 2011 are shown in Figure 2a (Carrière et al., 2015). They reveal broad spatial and temporal variations in resistivity in shallow layers, from less than 300 Ω.m during wet conditions to more than 2500 Ω.m during dry conditions. In contrast, deeper layers (below ca. 2 m) exhibited smaller variations. Accordingly, PVR was smaller in the deeper layer (Figure 2b). PVR computed at the location of pedological pits concurred with total available water estimated from textural information within the pedological pits (Table 1). Also, variability in the depth of the high-PVR region along the transect (in blue and purple in Figure 2b) was consistent with the spatial heterogeneity in soil depth, stone content, and bedrock outcrops observed in pedologic pits. In contrast, a single date resistivity profile (ρwet and ρdry) was not consistent with the TAW
estimated in the three pits (Table 1). This confirms that PVR is an appropriate metric for quantifying TAW.
TAW (total available
water, mm) PVR (%) ρwet (Ω.m) ρdry (Ω.m)
Pit 1 36.6 71.3 449 1565
Pit 2 65.6 76.3 594 2510
Pit 3 94.1 82.1 323 1805
Table 1: Correspondence between pedological and geophysical data. TAW of each pit was obtained following Baize and Jabiol (2011) protocol, using data of soil texture, coarse element content, and thickness of the different soil horizons identified in each pit. The TAW computation was standardized for a depth of 1 meter for all pits. Detailed information is provided for each pit and the TAW computation is included in the supplementary materials (S2). The ρwet, ρdry (Ω.m) and the percent
variation in resistivity (PVR, %) were extracted from the ERT profile corresponding to each pit for 0-1m.
Climate variability and drought
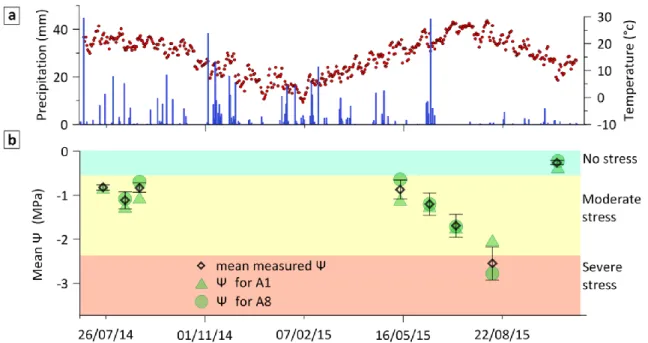
Predawn leaf water potential (Ψ) was highly variable during the study period, as a result of substantial variation in meteorological conditions during the years 2014 and 2015 (Figure 3). The summer of 2014 was relatively wet (within the 30 % wettest years, with a return period of 3.4 years), with regular rainfall events during the summer, so that the leaf water potential (Ψ) remained relatively high. By contrast, the summer of 2015 was dry (within the 40 % driest years, with a return period of 2.2 years), with almost no rain and higher temperatures from late June to late August. This drought led to a marked decline of Ψ between measurement dates (Figure 3b, in which drought classes are identified by different colors). For reference, the SPEI dynamic computed for the 1970-2018 period indicates that the 2015-2017 period was the most severe drought since 1970 (Figure S1). This drought event caused mortality and canopy defoliation events in numerous Quercus ilex stands in the region, including at the study site.
Relationships between tree water status and resistivity
Figure 4 presents the relationships between Ψ at the tree level and PVR in each drought intensity class for the two layers (0 to 2 meters and 2 to 5 meters). We found several significant relationships between PVR and Ψ, but their magnitude and sign depend both on the drought intensity class and on depth layer. For the well-watered class, the correlation
10
between Ψand PVR in the upper layer (0-2 meters) is positive (p-value=0.02, R2=0.41). For moderate drought, the relationship is also positive (p-value=0.001, R2=0.62), but only for the deep layer (2 to 5 meter depth) (Figure 4e). In contrast, for the severe drought class we found a negative relationship between Ψ and PVR in the upper layer (R2 = 0.66; p-value = 0.002, Figure 4c). This suggests that trees with higher TAW in the upper layer experienced higher water deficit during the drought peak (see Discussion below). For completeness, correlations between Ψ and resistivity from single date profiles at the wettest and the driest dates (ρwet, ρdry) are reported in Figure S3, but do not show any consistent
pattern.
Figure 3: Seasonal dynamics for the years 2014 and 2015 of (a) climate (temperature and precipitation); (b) mean leaf water potential (Ψ) and example Ψ for two different trees (A1 and A8). The three classes of water deficit were defined according to the average value of Ψ.
Relationships between traits and PVR
Figure 5 summarizes the most significant relationships between tree traits and PVR in the upper layer (0-2 meters; all correlations are presented in figures S4 and S5). The Ψ variations between the wettest and the driest dates (w-d) are positively correlated with
PVR (Figure 5a, p-value=0.009, R2=0.5), suggesting that trees with more available water in upper layers (0 – 2 m) also exhibit greater variations in Ψ. Consistently, we also found a significant relationship between PVR and the level of tree defoliation after an extreme drought (Figure 5b, p-value=0.007, R2=0.6). However, we did not observe any significant relationships for other dendrometric traits (Figure S5). At the leaf level, we found a significant negative relationship between leaf carbon isotopic composition (δ13C) and PVR in the upper
layer (Figure 5c). This effect is consistent between the two sampling heights (upper canopy leaves: p-value = 0.06, R2=0.3 and lower canopy leaves: p-value = 0.01, R2=0.48). This indicates that trees growing with less available water in the upper layer also exhibit greater water use efficiency. Leaf nitrogen per unit mass (Nm) did not correlate with PVR for any
cohorts (p-value > 0.5). However, nitrogen per unit leaf area (Na) of upper canopy leaves is
significantly and negatively correlated with PVR computed over the 0-2 meter layer (R = -0.6; p-value = 0.03) for leaves that grew during the dry spring (2015), but no correlation was found for leaves that grew during the wetter spring (2014), (p-value = 0.2). Correlations
11
between Na and PVR for 2015 leaves resulted from the correlation between LMA and PVR (r
= -0.88, p-value = 0.0008, Figure S4, upper canopy leaves). The relationship between LMA and PVR is presented in Figure 5. For upper canopy leaves, R2 equaled 0.67 (p-value=0.002), but the relationship was not significant for lower canopy leaves. No significant correlation was found for leaves that grew during the wet spring (2014).
Figure 4: Relationship between leaf water potential (Ψ, in MPa) and the percent variation in resistivity (PVR) of individual stools for three different levels of drought. The PVR was computed for two different layers (0 to 2 meters and 2 to 5 meters). For the “moderate drought” class (b and e), the mean and standard errors are shown over six measurement dates. For the “no drought” (a and d) and “severe drought” (c and f) classes, leaf water potentials were measured at a single date, in October and August respectively. Fitted linear models are shown in black lines when significant (dotted lines otherwise).
12
Figure 5: Relationships between different tree drought response traits and the percent variation in resistivity (PVR) over the two first meters of soil. Fitted linear models are shown in black lines when significant (dotted line otherwise): (a) Difference in predawn leaf water potential between a dry period and a wet date (Ψw-Ψd). (b) Defoliation rate (%) after the 2016-2017 drought episode. (c) Leaf δ13C
(‰) for upper canopy leaves (grey) and lower canopy leaves (black). (b) Leaf mass per area (LMA) for
upper canopy leaves (grey) and lower canopy leaves (black). For LMA and δ13
C, three branches per tree were used for canopy leaves (the mean and SD are shown) and only one branch was used for lower canopy leaves.
DISCUSSION AND PERSPECTIVES
In this study, we explore inter-individual variability in plant traits in relation to subsurface properties assessed with ERT. We applied ERT to compute the percent variation of resistivity (PVR) as an indicator of TAW. We then explored the relationship between tree traits involved in drought response and PVR. In the following, we first discuss variations in tree response to drought in terms of PVR variations. Finally, we discuss the limits and opportunities offered by ERT to improve our understanding of ecosystem functioning.
Ecological insights
Our results point out that trees grown in locations with higher PVR (high TAW) tend to delay the decline in leaf water potential (Ψ) during early drought, but they experience more intense stress during severe drought periods (Figure 3b, Figure 4c). Trees with higher PVR (computed at 0-2m or 2-5 m) experienced less water deficit (i.e. higher Ψ) during well-watered and intermediate drought conditions (Figure 4). This relationship could be expected as a higher PVR should correspond to a higher TAW in the surroundings of tree roots. This is also consistent with the correlation between PVR and tree traits involved in drought responses. Indeed, trees with higher PVR developed leaves with lower LMA during the dry year 2015. Such positive relationship between LMA and water availability has already been
13
reported for this species (Ogaya and Penuelas, 2007). Similarly, the correlation between PVR and δ13C suggests that trees with lower TAW had a significantly higher water use efficiency (i.e. higher leaf δ13
C, Figure 5a), which suggests that these trees had a higher degree of stomatal closure.
It can be noted that during moderate drought conditions, a significant correlation between PVR and predawn leaf water potential was observed only for the deep layer (i.e. 2-5 m, Figure 4b). This suggests that trees take up water below the upper layer and that water uptake displays a downward shift toward deeper layer as the soil dries. This has been previously reported for the Mediterranean evergreen Quercus coccifera (Rambal, 1984) and temperate oak (Breda et al., 1995), in studies based on neutron probe measurements. More surprisingly, we found that trees with higher TAW in the upper layer (i.e. with higher PVR at 0-2 meters) experienced higher water stress during the drought peak (Figure 4c). This response was consistent with the fact that stems with higher PVR in upper layers exhibited stronger variations in Ψ during the dry season (Figure 5a) and experienced higher defoliation rates following the extreme droughts of 2016-2017 (Figure 5b). This finding concurs with the study of Nourtier et al. (2014) on Abies alba, in which they reported a higher mortality rate for trees that had thicker surface soil, and they concluded that “trees were the most vulnerable on soil with higher water storage capacity”. Overall this counterintuitive result suggests that trees with higher TAW in upper layers may be less acclimatized to drought. A possible explanation is that trees with more favorable conditions (high PVR in the 0-2 m layer) have developed a shallow root system and might encounter severe stress because the shallow part of the catena would dry out more quickly during drought. In contrast, trees located in poorer conditions (low PVR in the 0-2 m layer) might have a more developed root system in the deeper layer. Because these trees are more often stressed, they adapt their foliage (Figure 5, LMA and LAI) for recurrent moderate drought and they invest more in deep root system development. Consequently, trees with poor conditions in the upper layer are less affected during severe droughts. In favor of this explanation, a recent dataset of water isotopes (18O/16O) measured in the xylem, the soil, and groundwater on the same experimental site support the idea that trees with lower available water in the upper layer tend to withdraw water from deeper in the karst (data in Carriere et al., accepted). Overall, this supports the idea that adjustments, including root development and a tree’s ability to use deep karst water, may play an important role in such inter-individual differences.
ERT outcomes and limitations for ecological applications
Our study confirms that ERT is a promising tool for estimating variability in the soil/subsoil environment of natural ecosystems. This finding can open up a new research avenue regarding the micro-adaptation and drought vulnerability of plants in heterogeneous ecosystems. As already mentioned, the advantages of the ERT technique are numerous for soil/subsoil water estimations; measurements are quick and non-destructive, and high spatial resolution and considerable investigation depth are achieved. Yet, it can be challenging to estimate water content in natural and heterogeneous environments (such as karst) with resistivity measurements from a single dataset, because resistivity can be greatly affected by the type of media (e.g. rock, clay). Here, we followed the method introduced by Clément et al. (2009) and Robert et al. (2012) and used the variation between a wet and a dry period (PVR) to estimate spatial variations in available water content, while limiting artifacts. This
14
approach increased the contrast between soil/subsoil water reserve, while reducing the impact of confounding factors that vary temporally, such as temperature. We report that relationships between resistivity on a single date (dry or wet) and TAW or leaf water potential were not as consistent as those obtained with PVR, as already observed by Brillante et al. (2016) in vineyards. Overall, our results highlight that in its current form, TAW estimates derived from ERT measurements can already provide a major advantage in drought-related research in forested ecosystems. However, methodological challenges still limit the use of ERT for soil/subsoil water estimations in ecological surveys. For instance, it would be relevant to work in simpler soil/subsoil environments (i.e., porous media) and to conduct high temporal resolution ERT monitoring for a more detailed assessment of the relationship between resistivity and water content, as in agricultural areas (Srayeddin and Doussan, 2009). This would, for example, help clarify interactions between vegetation and underground throughout drought seasons, but more interaction between geophysicists and ecologists will be needed to develop these methods.
ACKNOWLEDGEMENTS
The authors would like to express their gratitude to the CIRAME for meteorological data and to the entire LSBB team for their technical and logistic help. We thank Nicolas Mariotte for field measurements, Arnaud Jouineau for gridding the leaf samples, Olivier Ambrosio and William Brunetto for the measurements of leaf area and weight, and Pascal Tillard and the “Atelier des Isotopes Stables” B&PMP laboratory (INRA, Montpellier, France) for isotopic analysis. This work was supported by the meta-programme Adaptation of Agriculture and Forests to Climate Change (AAFCC) of the French National Institute for Agricultural Research (INRA). This work benefitted from fruitful discussions within the KARST observatory network (SNO KARST) initiative from the INSU/CNRS and OZCAR, which aims to strengthen knowledge sharing and promote cross-disciplinary research on karst systems at the national scale.
15
REFERENCES
Abràmoff, M.D., Magalhães, P.J., Ram, S.J., 2004. Image processing with ImageJ. Biophotonics international 11, 36–42.
Acevedo-Opazo, C., Tisseyre, B., Taylor, J.A., Ojeda, H., Guillaume, S., 2010. A model for the spatial prediction of water status in vines (Vitis vinifera L.) using high resolution ancillary information. Precision Agriculture 11, 358–378. https://doi.org/10.1007/s11119-010-9164-7
al Hagrey, S.A., 2007. Geophysical imaging of root-zone, trunk, and moisture heterogeneity. Journal of experimental botany 58, 839–854.
Anderegg, W.R., Klein, T., Bartlett, M., Sack, L., Pellegrini, A.F., Choat, B., Jansen, S., 2016. Meta-analysis reveals that hydraulic traits explain cross-species patterns of drought-induced tree mortality across the globe. Proceedings of the National Academy of Sciences 113, 5024–5029.
Bailey, S.W., Horsley, S.B., Long, R.P., 2005. Thirty years of change in forest soils of the Allegheny Plateau, Pennsylvania. Soil science society of America journal 69, 681–690. Baize, D., Jabiol, B. (Eds.), 2011. Guide pour la description des sols. 2ème édition revue et
corrigée. Editions INRA, Paris.
Bartlett, M.K., Klein, T., Jansen, S., Choat, B., Sack, L., 2016. The correlations and sequence of plant stomatal, hydraulic, and wilting responses to drought. Proceedings of the National Academy of Sciences 113, 13098–13103.
Bontemps, A., Davi, H., Lefèvre, F., Rozenberg, P., Oddou‐Muratorio, S., 2017. How do functional traits syndromes covary with growth and reproductive performance in a water‐stressed population of Fagus sylvatica? Oikos 126, 1472–1483.
Bréda, N., Granier, A., Barataud, F., Moyne, C., 1995. Soil water dynamics in an oak stand. Plant and Soil 172, 17–27.
Brillante, L., Bois, B., Mathieu, O., Lévêque, J., 2016. Electrical imaging of soil water availability to grapevine: a benchmark experiment of several machine-learning techniques. Precision Agriculture 1–22.
Brillante, L., Mathieu, O., Bois, B., van Leeuwen, C., Lévêque, J., 2015. The use of soil electrical resistivity to monitor plant and soil water relationships in vineyards. Soil 1, 273– 286.
Cailleret, M., Jansen, S., Robert, E.M.R., Desoto, L., Aakala, T., Antos, J.A., Beikircher, B., Bigler, C., Bugmann, H., Caccianiga, M., Čada, V., Camarero, J.J., Cherubini, P., Cochard, H., Coyea, M.R., Čufar, K., Das, A.J., Davi, H., Delzon, S., Dorman, M., Gea-Izquierdo, G., Gillner, S., Haavik, L.J., Hartmann, H., Hereş, A.-M., Hultine, K.R., Janda, P., Kane, J.M., Kharuk, V.I., Kitzberger, T., Klein, T., Kramer, K., Lens, F., Levanic, T., Linares Calderon, J.C., Lloret, F., Lobo-Do-Vale, R., Lombardi, F., López Rodríguez, R., Mäkinen, H., Mayr, S., Mészáros, I., Metsaranta, J.M., Minunno, F., Oberhuber, W., Papadopoulos, A., Peltoniemi, M., Petritan, A.M., Rohner, B., Sangüesa-Barreda, G., Sarris, D., Smith, J.M., Stan, A.B., Sterck, F., Stojanović, D.B., Suarez, M.L., Svoboda, M., Tognetti, R., Torres-Ruiz, J.M., Trotsiuk, V., Villalba, R., Vodde, F., Westwood, A.R., Wyckoff, P.H., Zafirov, N., Martínez-Vilalta, J., 2017. A synthesis of radial growth patterns preceding tree mortality. Global Change Biology 23, 1675–1690. https://doi.org/10.1111/gcb.13535
Cailleret, M., Nourtier, M., Amm, A., Durand-Gillmann, M., Davi, H., 2014. Drought-induced decline and mortality of silver fir differ among three sites in Southern France. Annals of Forest Science 71, 643–657. https://doi.org/10.1007/s13595-013-0265-0
16
Carrière, S.D., Chalikakis, K., Danquigny, C., Clément, R., Emblanch, C., 2015. Feasibility and Limits of Electrical Resistivity Tomography to Monitor Water Infiltration Through Karst Medium During a Rainy Event, in: Andreo, B., Carrasco, F., Durán, J.J., Jiménez, P., LaMoreaux, J.W. (Eds.), Hydrogeological and Environmental Investigations in Karst Systems. Springer Berlin Heidelberg, pp. 45–55. https://doi.org/10.1007/978-3-642-17435-3_6
Carrière, S.D., Chalikakis, K., Danquigny, C., Davi, H., Mazzilli, N., Ollivier, C., Emblanch, C., 2016. The role of porous matrix in water flow regulation within a karst unsaturated zone: an integrated hydrogeophysical approach. Hydrogeology Journal 24, 1905–1918.
Carrière, S.D., Chalikakis, K., Sénéchal, G., Danquigny, C., Emblanch, C., 2013. Combining Electrical Resistivity Tomography and Ground Penetrating Radar to study geological structuring of karst Unsaturated Zone. Journal of Applied Geophysics 94, 31–41. https://doi.org/10.1016/j.jappgeo.2013.03.014
Carrière, S.D., Danquigny, C., Davi, H., Chalikakis, K., Ollivier, C., Martin-StPaul, N.K., Emblanch, C., 2017. Process-Based Vegetation Models Improve Karst Recharge Simulation Under Mediterranean Forest, in: EuroKarst 2016, Neuchâtel. Springer, pp. 109–116.
Carrière, S.D., Martin-StPaul, N.K., Cakpo, B.C., Patris, N., Gillon, M., Chalikakis, K., Doussan, C., Olioso, A., Simioni, G., Babic, M., Jouineau, A., Davi, H., accepted. The role of deep vadose zone water in tree transpiration during drought periods in karst settings – insights from isotopic tracing and leaf water potential. Science of the Total Environment. Choat, B., Brodribb, T.J., Brodersen, C.R., Duursma, R.A., López, R., Medlyn, B.E., 2018.
Triggers of tree mortality under drought. Nature 558, 531.
Clément, R., Descloitres, M., Günther, T., Oxarango, L., Morra, C., Laurent, J.P., Gourc, J.P., 2010. Improvement of electrical resistivity tomography for leachate injection monitoring. Waste Management 30, 452–464. https://doi.org/10.1016/j.wasman.2009.10.002
Clément, R., Descloitres, M., Günther, T., Ribolzi, O., Legchenko, A., 2009. Influence of shallow infiltration on time-lapse ERT: Experience of advanced interpretation. Comptes Rendus Geoscience 341, 886–898. https://doi.org/10.1016/j.crte.2009.07.005
Cruiziat, P., Cochard, H., Améglio, T., 2002. Hydraulic architecture of trees: main concepts and results. Annals of Forest Science 59, 723–752. https://doi.org/10.1051/forest:2002060 Dahlin, T., 2001. The development of DC resistivity imaging techniques. Computers &
Geosciences 27, 1019–1029. https://doi.org/10.1016/s0098-3004(00)00160-6
Dahlin, T., Zhou, B., 2004. A numerical comparison of 2D resistivity imaging with 10 electrode arrays. Geophysical Prospecting 52, 379–398. https://doi.org/10.1111/j.1365-2478.2004.00423.x
Dahlin, T., Zhou, B., 2006. Multiple-gradient array measurements for multichannel 2D resistivity imaging. Near Surf. Geophys. 4, 113–123.
Davi, H., Baret, F., Huc, R., Dufrêne, E., 2008. Effect of thinning on LAI variance in heterogeneous forests. Forest Ecology and Management 256, 890–899. https://doi.org/10.1016/j.foreco.2008.05.047
Diochon, A., Kellman, L., Beltrami, H., 2009. Looking deeper: An investigation of soil carbon losses following harvesting from a managed northeastern red spruce (Picea rubens Sarg.) forest chronosequence. Forest Ecology and Management 257, 413–420.
Fan, J., Scheuermann, A., Guyot, A., Baumgartl, T., Lockington, D.A., 2015. Quantifying spatiotemporal dynamics of root-zone soil water in a mixed forest on subtropical coastal sand dune using surface ERT and spatial TDR. Journal of Hydrology 523, 475–488.
17
Guinea, A., Hollins, S., Meredith, K., Hankin, S., Cendón, D.I., 2018. Characterization of the subsurface architecture and identification of potential groundwater paths in a clay-rich floodplain using multi-electrode resistivity imaging. Hydrological sciences journal 63, 909– 925.
Günther, T., 2004. Inversion methods and resolution analysis for the 2D/3D reconstruction of resistivity structure from DC measurements. University of Mining and Technology, Freiberg, Germany.
Haghverdi, A., Leib, B.G., Washington-Allen, R.A., Ayers, P.D., Buschermohle, M.J., 2015. Perspectives on delineating management zones for variable rate irrigation. Computers and Electronics in Agriculture 117, 154–167.
Hart, S.P., Schreiber, S.J., Levine, J.M., 2016. How variation between individuals affects species coexistence. Ecology letters 19, 825–838.
Hedley, C., Yule, I., 2009. A method for spatial prediction of daily soil water status for precise irrigation scheduling. Agricultural Water Management 96, 1737–1745.
Hezarjaribi, A., Sourell, H., 2007. Feasibility study of monitoring the total available water content using non‐invasive electromagnetic induction‐based and electrode‐based soil electrical conductivity measurements. Irrigation and Drainage: The journal of the International Commission on Irrigation and Drainage 56, 53–65.
Jayawickreme, D.H., Jobbágy, E.G., Jackson, R.B., 2014. Geophysical subsurface imaging for ecological applications. New Phytologist 201, 1170–1175.
Keller, G.V., Frischknecht, F.C., 1966. Electrical methods in geophysical prospecting. International Series of Monographs in Electromagnetic Waves 10.
Kurjak, D., Střelcová, K., Ditmarová, Ľ., Priwitzer, T., Homolák, M., Pichler, V., 2012. Physiological response of irrigated and non-irrigated Norway spruce trees as a consequence of drought in field conditions. European Journal of Forest Research 131, 1737–1746.
Lempereur, M., Martin‐StPaul, N.K., Damesin, C., Joffre, R., Ourcival, J., Rocheteau, A., Rambal, S., 2015. Growth duration is a better predictor of stem increment than carbon supply in a Mediterranean oak forest: implications for assessing forest productivity under climate change. New Phytologist 207, 579–590.
Limousin, J.M., Rambal, S., Ourcival, J.M., Rocheteau, A., Joffre, R., Rodriguez-Cortina, R., 2009. Long-term transpiration change with rainfall decline in a Mediterranean Quercus ilex forest. Global Change Biology 15, 2163–2175. https://doi.org/10.1111/j.1365-2486.2009.01852.x
Lloret, F., Siscart, D., Dalmases, C., 2004. Canopy recovery after drought dieback in holm‐oak Mediterranean forests of Catalonia (NE Spain). Global Change Biology 10, 2092–2099.
Loke, M.H., 1999. Time-Lapse resistivity imaging inversion. Presented at the 5th meeting of the environmental and Engineering Society Section.
Martin‐StPaul, N., Delzon, S., Cochard, H., 2017. Plant resistance to drought depends on timely stomatal closure. Ecology letters 20, 1437–1447.
Martin‐StPaul, N.K., Limousin, J., Vogt‐Schilb, H., Rodríguez‐Calcerrada, J., Rambal, S., Longepierre, D., Misson, L., 2013. The temporal response to drought in a Mediterranean evergreen tree: comparing a regional precipitation gradient and a throughfall exclusion experiment. Global Change Biology 19, 2413–2426.
Maseda, P.H., Fernández, R.J., 2006. Stay wet or else: three ways in which plants can adjust hydraulically to their environment. Journal of Experimental Botany 57, 3963–3977.
18
Michot, D., Benderitter, Y., Dorigny, A., Nicoullaud, B., King, D., Tabbagh, A., 2003. Spatial and temporal monitoring of soil water content with an irrigated corn crop cover using surface electrical resistivity tomography. Water Resources Research 39. https://doi.org/10.1029/2002wr001581
Misson, L., Degueldre, D., Collin, C., Rodriguez, R., Rocheteau, A., OURCIVAL, J., Rambal, S., 2011. Phenological responses to extreme droughts in a Mediterranean forest. Global Change Biology 17, 1036–1048.
Nijland, W., van der Meijde, M., Addink, E.A., de Jong, S.M., 2010. Detection of soil moisture and vegetation water abstraction in a Mediterranean natural area using electrical resistivity tomography. Catena 81, 209–216. https://doi.org/10.1016/j.catena.2010.03.005 Nourtier, M., Chanzy, A., Cailleret, M., Yingge, X., Huc, R., Davi, H., 2014. Transpiration of
silver Fir (Abies alba mill.) during and after drought in relation to soil properties in a Mediterranean mountain area. Annals of forest science 71, 683–695.
Oddou‐Muratorio, S., Davi, H., 2014. Simulating local adaptation to climate of forest trees with a Physio‐Demo‐Genetics model. Evolutionary applications 7, 453–467.
Ogaya, R., Peñuelas, J., 2007. Leaf mass per area ratio in Quercus ilex leaves under a wide range of climatic conditions. The importance of low temperatures. Acta Oecologica 31, 168–173.
Ortuani, B., Chiaradia, E.A., Priori, S., L’abate, G., Canone, D., Comunian, A., Giudici, M., Mele, M., Facchi, A., 2016. Mapping Soil Water Capacity Through EMI Survey to Delineate Site-Specific Management Units Within an Irrigated Field. Soil Science 181, 252–263.
Poorter, H., Niinemets, Ü., Poorter, L., Wright, I.J., Villar, R., 2009. Causes and consequences of variation in leaf mass per area (LMA): a meta‐analysis. New Phytologist 182, 565–588.
Rambal, S., 1984. Water balance and pattern of root water uptake by a Quercus coccifera L. evergreen scrub. Oecologia 8.
Rambal, S., Joffre, R., Ourcival, J., Cavender‐Bares, J., Rocheteau, A., 2004. The growth respiration component in eddy CO2 flux from a Quercus ilex mediterranean forest. Global Change Biology 10, 1460–1469.
Robert, T., Caterina, D., Deceuster, J., Kaufmann, O., Nguyen, F., 2012. A salt tracer test monitored with surface ERT to detect preferential flow and transport paths in
fractured/karstified limestones. Geophysics 77, B55–B67.
https://doi.org/10.1190/geo2011-0313.1
Robinson, D., Campbell, C., Hopmans, J., Hornbuckle, B., Jones, S.B., Knight, R., Ogden, F., Selker, J., Wendroth, O., 2008. Soil moisture measurement for ecological and hydrological watershed-scale observatories: A review. Vadose Zone Journal 7, 358–389. Robinson, J.L., Slater, L.D., Schäfer, K.V.R., 2012. Evidence for spatial variability in
hydraulic redistribution within an oak–pine forest from resistivity imaging. Journal of Hydrology 430–431, 69–79. https://doi.org/10.1016/j.jhydrol.2012.02.002
Rodríguez Robles, U., Arredondo Moreno, J.T., Huber-Sannwald, E., Ramos Leal, J.A., 2017. Application of geophysical tools for tree root studies in forest ecosystems in complex soils.
Rutter, A., Fourt, D., 1965. Studies in the Water Relations of Pinus sylvestris in Plantation Conditions. III. A Comparison of Soil Water Changes and Estimates of Total Evaporation on Four Afforested Sites and One Grass-Covered Site. Journal of Applied Ecology 197– 209.
19
Samouëlian, A., Cousin, I., Tabbagh, A., Bruand, A., Richard, G., 2005. Electrical resistivity survey in soil science: a review. Soil and Tillage Research 83, 173–193. https://doi.org/10.1016/j.still.2004.10.004
Srayeddin, I., Doussan, C., 2009. Estimation of the spatial variability of root water uptake of maize and sorghum at the field scale by electrical resistivity tomography. Plant and Soil 319, 185–207. https://doi.org/10.1007/s11104-008-9860-5
Tai, X., Mackay, D.S., Anderegg, W.R.L., Sperry, J.S., Brooks, P.D., 2017. Plant hydraulics improves and topography mediates prediction of aspen mortality in southwestern USA. New Phytologist 213, 113–127. https://doi.org/10.1111/nph.14098
Travelletti, J., Sailhac, P., Malet, J., Grandjean, G., Ponton, J., 2012. Hydrological response of weathered clay-shale slopes: Water infiltration monitoring with time-lapse electrical resistivity tomography. Hydrological Processes 26, 2106–2119.
Vicente-Serrano, S.M., Beguería, S., López-Moreno, J.I., 2010. A multiscalar drought index sensitive to global warming: the standardized precipitation evapotranspiration index. Journal of climate 23, 1696–1718.
Vidal, J., Martin, E., Franchistéguy, L., Baillon, M., Soubeyroux, J., 2010. A 50‐year high‐resolution atmospheric reanalysis over France with the Safran system. International Journal of Climatology 30, 1627–1644.
Voltas, J., Lucabaugh, D., Chambel, M.R., Ferrio, J.P., 2015. Intraspecific variation in the us e of water sources by the circum-Mediterranean conifer Pinus halepensis. New Phytologist n/a-n/a. https://doi.org/10.1111/nph.13569
Zribi, L., Mouillot, F., Guibal, F., Rejeb, S., Rejeb, M.N., Gharbi, F., 2016. Deep Soil Conditions Make Mediterranean Cork Oak Stem Growth Vulnerable to Autumnal Rainfall Decline in Tunisia. Forests 7, 245.