An Analog VLSI Vocal Tract
byKeng Hoong Wee
Submitted to the Department of Electrical Engineering and Computer Science in Partial Fulfillment of the Requirements for the Degree of
Doctor of Philosophy in Electrical Engineering and Computer Science
at the
Massachusetts Institute of Technology
February 2008
© 2008 Keng Hoong Wee. All rights reserved.
The author hereby grants to MIT permission to reproduce and distribute publicly paper and electronic copies of this thesis document in whole or in part
Signature of Author ... , ;.... ... ...
Departmeit of Electrical Engineering and Computer Science Jan 15, 2008
Certified by...
Rahul Sarpeshkar Associate Professor of Electrical Engineering and Computer Science Thesis Supervisor
Accepted by ... ... ... ...
Terry P. Orlando Chairman, Committee on Graduate Students Department of Electrical Engineering and Computer Science
MASSACHUSMS ISTIN OF TEOHNOLOGY
APR
0
7
2008
LIBRARIES
An Analog VLSI Vocal Tract
by
Keng Hoong Wee
Submitted to the Department of Electrical Engineering and Computer Science on Jan 15 2008, in Partial Fulfillment of the Requirements for the
Degree of Doctor of Philosophy in Electrical Engineering and Computer Science
Abstract
Increasingly, circuit models of biology are being used to improve performance in engineering systems. For example, silicon-cochlea-like models have led to improved speech recognition in noise and low-power cochlear-implant processors for the deaf. A promising approach to improve the naturalness of synthetic speech is to exploit bio-inspired models of speech production with low bit-rate control parameters. In this work, we present the first experimental integrated-circuit vocal tract by mapping fluid volume velocity to current, fluid pressure to voltage, and linear and nonlinear mechanical impedances to linear and nonlinear electrical impedances. The 275 jW analog vocal tract chip can be used with auditory processors in a feedback speech locked loop to implement speech recognition that is potentially robust in noise. Our use of a physiological model of the human vocal tract enables the analog vocal tract chip to synthesize speech signals of interest, using articulatory parameters that are intrinsically compact and linearly interpolatable. Previous attempts that take advantage of the powerful analysis-by-synthesis method employed computationally expensive approaches to articulatory synthesis using digital computation. Our strategy uses an analog vocal tract to drastically reduce power consumption, enables real-time performance and could be useful in portable speech processing systems of moderate complexity, e.g., in cell phones, digital assistants and bionic speech-prosthesis systems.
Thesis Supervisor: Rahul Sarpeshkar
Acknowledgements
An endeavour of this magnitude could not have been accomplished without the help and support of numerous people-my advisor, my Ph.D thesis committee, colleagues, friends, and family-along the way. I would like to acknowledge these people.
I would like to start by acknowledging my thesis committee. I am grateful to my advisor, Professor Rahul Sarpeshkar, for taking me into the Analog VLSI and Biological Systems group at MIT. Rahul is a constant source of inspiration. I have benefited tremendously from his vision and his unrelenting pursuit of truth and real insight. Rahul also instilled in me an attitude to take heart from setbacks and to move on with great enthusiasm. Without doubt, I have acquired knowledge and invaluable research skills from Rahul and I am grateful to him for teaching me to seek out scientific insight.
I am also grateful to Professor Kenneth Stevens and Professor Joel Dawson for serving on my Ph.D thesis committee, and for the numerous discussions and helpful comments. I would also like to thank Joel for being a member of my Ph.D qualification exam committee.
I acknowledge the friends and colleagues, past and present, in the Analog VLSI and Biological Systems group. I am grateful to Lorenzo Turicchia for his invaluable feedback on the thesis. I also benefited greatly from his discerning viewpoints and from our conversations and discussions. I would like to thank Soumyajit Mandal for countless discussions, for spending time to listen and bounce ideas, and for his many helpful suggestions. I am also grateful to Micah O'Halloran and Ji Jon Sit for patiently hearing me out and allowing me to pick their brains on numerous occasions. I thank Michael Baker, Serhii Zhak, Chris Salthouse, Scott Arfin, Ben Rapoport, Woradorn Wattanapanitch, Maziar Tavakoli, Heemin Yang, Tim Lu, and Daniel Kumar for the intellectual and emotional support that I have enjoyed over the years. They have been a major source of inspiration, ideas and help. I have learnt a lot from them and count myself most fortunate to have had the opportunity to work with such a talented group of individuals.
I acknowledge DSO National Laboratories for the opportunity to pursue doctoral research through a study scholarship.
I acknowledge my family who has been most supportive throughout the years. I am grateful to my relatives for pitching in when called upon. Special thanks to my sister, who stepped in for me so willingly and unquestioningly, while I was away from home. To my parents, my gratitude is best portrayed by two verses taken from a beautiful piece of Chinese poetry by the Tang poet Meng Jiao:
!$1I'i-C,
How could a blade of grass
E4L-7Oi Repay the warmth it received from the spring sun
Last but definitely not least, I thank my wife Mei Lin; for her unconditional love and devotion, countless sacrifices and her infinite reserves of patience and understanding. If I may use a circuit analogy, and map her emotional support to a current, and pressure to a voltage, then she is without a doubt an ideal current source. My deepest gratitude to my beloved Mei Lin!
TABLE OF CONTENTS
A cknow ledgem ents... 5
Chapter 1 INTRODUCTION ... 9
1.1 Why a vocal tract: The speech problem... 9
1.2 Overview of the human speech production system ... 11
1.2.1 The subglottal system ... ... 13
1.2.2 The supraglottal vocal tract... .... ... 14
1.2.3 The glottis ... 17
1.3 Overview of speech synthesis... 21
1.3.1 Concatenation synthesis... 21
1.3.2 Formant synthesis ... 23
1.3.3 Linear prediction coding based synthesis ... . 24
1.3.4 Sinusoidal synthesis ... 25
1.3.5 Articulatory synthesis ... ... 26
Chapter 2 ELECTRICAL MODEL OF SPEECH PRODUCTION SYSTEM... 29
2.1 Overview of circuit model ... 29
2.2 M odel of the glottis ... 31
2.2.1 Current source model ... 31
2.2.2 Variable impedance model ... 33
2.3 Model of the supraglottal vocal tract ... ... 37
2.3.1 Pharyngeal and oral cavities ... ... 37
2.3.2 Model of the supraglottal constriction ... .... 39
2.3.3 Model of the nasal cavity ... ... 42
2.4 Model of sound radiation from the lips and nose ... . 42
2.5 Simulation of speech production ... ... 45
2.5.1 Speech production with supraglottal vocal tract... 45
2.5.2 Simulation results... 46
Chapter 3 DRIVING THE ANALOG VOCAL TRACT ... . 53
3.1 Articulatory representation of speech ... ... 53
3.2 The Maeda articulatory model ... ... 54
3.3 The synthesis process... 56
3.4 Building an articulatory codebook through babbling ... 56
3.5 Articulatory trajectory optimization ... ... 58
3.6 Sim ulation results... ... 60
Chapter 4 LINEAR OR NONLINEAR MOS RESISTORS ... 77
4.1 Feedforward biasing technique for electronically tunable MOS resistors... 77
4.1.1 Transistor with constant VGB ... 79
4.1.2 MOS resistor with feedforward biasing technique ... 81
4.2 Feedback biasing technique for electronically tunable linear or nonlinear resistors using MOS transistors ... 88
4.3 Linear MOS resistor...92
4.3.1 Circuit description... 92
4.3.3 AC characteristics ... 100
4.3.4 Temperature characteristics ... 101
4.3.5 Noise analysis and measurements ... 102
4.4 Nonlinear MOS resistor ... 109
4.4.1 Circuit description... 109
4.4.2 Experimental results ... 109
Chapter 5 ELECTRONICALLY TUNABLE TWO-PORT a-SECTION ... 113
5.1 VLSI inductor ... 113
5.1.1 OTA based second order filter structures ... 113
5.1.2 OTA based gyrator ... 116
5.1.3 Operational amplifier based gyrator ... 118
5.2 VLSI two port equivalent of LC it-section ... 120
5.2.1 Two port representation of LC ni-section ... 120
5.2.2 Continuously tunable LC a-section ... 123
5.2.3 Discretely tunable LC a-section ... 129
5.2.4 The supraglottal vocal tract as a cascade of two-port equivalent ir-sections ... 13 0 Chapter 6 VLSI IMPLEMETATION OF VOCAL TRACT... ... 133
6.1 Transmission line vocal tract ... 133
6.2 Subglottal system... 136
6.2.1 Current source circuit model of the glottis ... ... 136
6.2.2 Nonlinear impedance circuit model of the glottis... 137
6.3 Approximate methods for consonant production... 138
6.3.1 "Input refer" noise source to glottis ... 138
6.3.2 Impedance modulation method ... 143
Chapter 7 CON CLU SION S ... ... 155
7.1 Contributions and accomplishments ... 155
7.2 Future directions ... 157
7.2.1 Speech codec... 157
7.2.2 Speech recognition via speech locked loop ... ... 159
7.2.3 Research tool for speech production... 163
Chapter 1
INTRODUCTION
1.1 Why a vocal tract: The speech problem
The problem of representing speech events with robust and compact signals that describe the salient features of speech is an important area of speech communication. For example, in speech codecs and synthetic speech systems, an efficient representation of speech and naturalness of generated speech are important requirements. An emerging approach to improve the naturalness of synthetic speech is to exploit bio-inspired models of speech production with physiological control parameters that are intrinsically robust, linearly interpolatable, and which achieves low bit-rate transmission.
In order to analyze the speech signal and extract its characteristic features, a three dimensional intensity-frequency-time representation known as the spectrogram is commonly used. Spectrogram analysis is a powerful method of speech analysis as it captures and highlights essential features of the speech signal such as frequency content and formant transitions. In fact, the cochlea (inner ear) of the human auditory system performs a similar operation. Input sound waves, converted into mechanical vibrations by the outer and middle ear, impinge on the oval window at the entrance of the cochlea causing the basilar membrane to vibrate at locations as well as at frequencies that reflect the frequency characteristics of the input acoustic wave (e.g., speech formants). Inner hair cells (IHC), distributed along the length of the basilar membrane, sense these vibrations and act as mechanical-to-neural transducers. Vibrations at some point along the basilar membrane activate nerve fibres that innervate the bottom of each IHC at those locations. In this way, the firing activity of the IHC along the membrane provide an indication of the frequency content and formant trajectory of the input acoustic signal.
An important technique employed in speech coding and decoding applications involves analysis-by-synthesis [1]: The speech is analyzed by extracting parameters from it that are used to configure a speech synthesizer to reproduce the speech. More specifically, it is a method of determining the control parameters of speech production-that reproduce desired speech features-in which the consequence of choosing a
particular set of values is evaluated by analyzing the synthesized speech and comparing it to the original input speech signal. The analysis-by-synthesis paradigm employs an active analysis process that is applied to speech synthesized by a generator. The heart of such a system is a speech apparatus that is capable of generating all and only the speech signals of interest.
Fig. 1-1(a) shows an analysis-by-synthesis block diagram that creates what we term a "speech locked loop" (SLL) in analogy with phase locked loops (PLL) used in communication systems. The auditory model and controller are analogous to a phase detector and loop filter in a PLL and the vocal tract model is analogous to a voltage-controlled-oscillator (VCO). Fig. 1-1(b) shows a particular embodiment of the SLL employing an analog vocal tract (AVT) and an analog bionic ear processor [2][3] in a
feedback configuration. Speech input
(a)
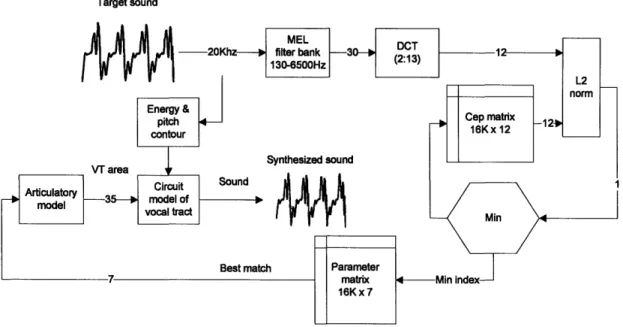
Speech input Speech output Speech output (b)The speech produced by the AVT is analyzed and compared to that of the input, and a measure of the error is computed. The error is derived from the acoustic difference between the vocal tract output and the target speech, e.g., the L2-norm of the difference in the respective mel-frequency cepstral coefficients, taking into account the articulatory dynamics. Using gradient descent techniques with pre-selected initial conditions that ensure global minimum convergence, different sounds are generated until one is found that produces the least error, at which time the SLL locks to the input sound with an optimal vocal tract profile produced by the controller.
In portable systems of moderate complexity, the use of analog processing to reduce power appears to be an emerging technology direction [4]. In particular, circuit models of biology are increasingly being used to improve performance in engineering systems. For example, silicon-cochlea-like models have led to improved speech recognition in noise [5] and low-power cochlear-implant processors for the deaf [2][3]. Silicon models of the retina [6] have been used in machine vision systems and circuit models of the heart have been used to shed insight into cardiac and circulatory malfunction in medicine. In this thesis, we develop an experimental integrated-circuit analog vocal tract by mapping fluid volume velocity to current, fluid pressure to voltage, and linear and nonlinear mechanical impedances to linear and nonlinear electrical impedances. Such silicon vocal tracts can be used with auditory processors in a feedback loop to implement real-time, low-power robust speech recognition in noise via analysis-by-synthesis techniques, and/or find applications in real-time low-power speech production, compression, speaker identification or bionic speech-prosthesis systems.
1.2 Overview of the human speech production system
The human speech production system is illustrated in Fig. 1-2 [7]. It may be broadly classified into a subglottal system of airways, including the lungs and the trachea, extending below the larynx and a supraglottal vocal tract, above the larynx, comprising the pharynx, oral cavity and nasal cavity. The subglottal and supraglottal systems are separated by the glottis, an aperture created within the vocal folds when they open and close. The supraglottal vocal tract extends from the glottis in the throat to the lips in the oral cavity and the nostrils in the nasal cavity. Articulators, namely the soft palate (or
velum), tongue, jaw and lips modify the shape of the vocal tract. The shape in turn determines the transfer function of the vocal tract in response to an excitation. The transfer function is specified by several poles (or formants) and sometimes zeros (or anti-formants). Air pressure produced by the lungs forces air through the vocal folds that when under tension vibrate and produce an airflow which excites the resonances in the vocal and nasal cavities. In general, the excitation can be due to vocal fold vibration at a fundamental frequency, as in the case of voiced speech, and/or from turbulent noise generated at constrictions along the vocal tract, as in the production of unvoiced speech. During speech production, the configuration of the vocal tract varies in a dynamic manner. The source of excitation may also change. It is believed that the state of the articulators is the result of a constant movement towards a sequence of changing targets defined by the phonemes of a given language. Phonemes are basic units of speech produced by a group of vocal tract configurations which are considered to be functionally equivalent in a given language. Two vocal tract configurations represent different phonemes if two words can be found which differ only by the use of these two configurations. Fig. 2-16 shows the classification of phonemes used in standard English.
oJVfikre (If .V-,,d part of
Ant rior arch of-04O0'aid pr"'" of ( e;r -(fary s -'fyPoAl art A ry pig iottic l d -Crieoid crargi 1'o phag•u _
Fig. 1-2: Illustration of the human speech production system (public domain, adapted from [7]).
1.2.1 The subglottal system
The subglottal system is the power source for speech production: it supplies the energy to move air through the trachea, glottis and the supraglottal vocal tract. Fig. 1-3 is a schematic representation of the subglottal system and its equivalent circuit model
[8][9].
(a)
GlottalDiaphragm/ Lungs Bronchi/ Glottis Supraglottal
Thorax Trachea vocal tract
(b)
Fig. 1-3: (a) Schematic diagram of subglottal (and also in part the supraglottal) system (adapted from [9]) and (b) its equivalent circuit model.
In this thesis, we adopt the effort-to-voltage (e--+V) convention to transform the conjugate power variables of pressure (effort) and volume velocity (flow) in the acoustic energy domain to voltage and current, respectively, in the electric energy domain. Consequently, the lungs are represented by an acoustic compliance Cav and the airways leading to it are represented as a distributed transmission line in Fig. 1-3(b). Changes in airflow, represented by the current Uaiv, are effected through changes in lung volume, represented by charge stored on Cal. The latter is controlled by a pressure source PD that
raises and lowers the diaphragm and another pressure source PT that expands and
contracts the thorax cavity. The diaphragm and thorax have impedances ZD and ZT
respectively. The impedance ZD is comprised of a mass MD, a compliance CD, and
damping resistance RD connected in series. Similarly, ZT consists of a thoracic mass, compliance and damping resistance, MT, CT RT respectively. During inspiration, air is drawn into the lungs: at the end of inspiration, an initial condition of Palv=8 cmH20=8000
dynes/cm2 is set on the alveolar compliance Calv by PT and PD. During speech production,
the air is expelled through the glottis, via the bronchi and trachea, and passes into the supraglottal vocal tract, which is modeled by another transmission line in Fig. 1-3(b). As air is expelled, Calv is charged through PD and PT (through contraction of the thoracic cavity and raising of the diaphragm), thereby maintaining a relatively constant alveolar pressure. During speech production, the supraglottal transmission line varies with the configuration of the supraglottal vocal tract and the pressure in the lungs Pal varies about a nominal value of 8000 dynes/cm2 [8]. Consequently, the subglottal source may be approximated as a constant or slowly varying pressure source Pa.v.
1.2.2 The supraglottal vocal tract
Fig. 1-4 [10] illustrates the major regions of the supraglottal vocal tract involved in speech production, namely:
(a) the pharynx (b) the oral cavity (c) the nasal cavity (d) the lips and nostrils
Nasal Cavity
Palate
L
Fig. 1-4: Diagram of the supraglottal vocal tract highlighting the major regions involved in speech production (adapted from [10]).
The physical configuration of the vocal tract is highly variable and is dictated by the positions of the four articulators. The nasal cavity is coupled to the main vocal tract through the velum. The vocal tract can be approximated as a non-uniform acoustic tube, with time-varying cross-sectional areas, that is terminated by the vocal cords at one end, and the lips and/or nose at the other. If the cross sectional dimensions of the tube are small compared to the wavelength of sound, the waves that propagate along the tube are approximately planar. The acoustic properties of such a tube are well approximated by assuming a circular cross section. The wave equation for planar sound propagation (one dimensional) in a lossless uniform tube of circular cross section can be derived as:
ap p U (1)
Ox A Ot
OU A OP
Ox pc2 at
where P is the sound pressure, U is the volume velocity, p is the density of the medium, c is the velocity of sound in the medium and A is the area of cross section. The volume of air in a tube exhibits an acoustic inertance p/A due to its mass (which opposes
acceleration) and an acoustic compliance A/pc2 due to its compressibility (which opposes
changes in volume).
Acoustic wave propagation in a tube is analogous to plane-wave propagation along an electrical transmission line where voltage and current are analogous to sound pressure and volume velocity. The voltage V and current I for a lossless transmission line can be described by the following coupled partial differential equations:
8V =L (2)
8x
8t
8I =C8V
where L and C are the inductance and capacitance per unit length.
The vocal tract is approximately 17.5 cm in length for an average man, which is comparable to the wavelength of sound in air at audible frequencies. Hence, a lumped approximation of the major vocal tract components does not provide an accurate analysis. However, the tube may be discretized in space and the entire tube represented in terms of a concatenation of incremental cylindrical sections. The error introduced by spatial quantization may be kept small if the length, t, of the approximating cylindrical sections are kept short compared to the wavelength of sound corresponding to the maximum frequency of interest.
The electrical analog of a section of a lossy acoustic tube with uniform circular cross sectional area A and length 1, is depicted in Fig. 1-5. The series inductance L and the shunt capacitance C represent the discretized acoustic inertance and compliance of the cylindrical section, respectively. The values of L and C are determined by the length
9,
and cross sectional area A of the section as follows:
L = pl (3)
A
Al
C=
pc2
Assuming that the flow is laminar, R and G models the energy losses due to viscous friction and heat conduction at the walls respectively. Except for the very smallest of areas (A<O.Olcm2), the series impedance, comprising the sum of R and jwL, is dominated by the reactive component in the frequencies of interest. In addition to
conductance G, the walls of the vocal tract also have stiffness, mass and damping. These mechanical properties of the vocal tract walls influence sound production and can be modeled as an impedance Zw in parallel to G, where Zw is approximated by a compliance Cw, a mass Lw and a resistance Rw connected in series as shown in Fig. 1-5. At low frequencies (100-200Hz), Cw, Lw and Rw, can be assumed to be constant [8].
L R
Zw
Fig. 1-5: Equivalent n-circuit model of a cylindrical section of acoustic tube with cross sectional area A.
In summary, the following simplifying assumptions were made in the analysis above:
(a) the vocal tract can be straightened out and approximated as a tube with variable cross sectional areas along its length
(b) the wave motion in the tract is planar (c) the wave equation is linear
Hence, as far as the acoustic properties are concerned, the shape of the vocal tract is completely specified by the cross sectional area of each section. Also, the effects of viscous friction and thermal conduction are accounted for by the appropriate introduction of resistances and conductances.
1.2.3 The glottis
During speech production, the vocal folds vibrate, changing the size of the glottal aperture that connects the subglottal and supraglottal systems. The oscillations of the
vocal folds can be explained in part by a phenomenon known as flow-induced oscillation: a steady stream of air passing by a wall or surface can cause vibrations of that surface. Vocal fold vibrations are the result of aerodynamic forces related to the glottal airflow and mechanical forces associated with the muscular structures. Functionally, during normal phonation, the glottal oscillator can be modeled as shown in Fig. 1-6 where Pal is the alveolar pressure at the lungs, Ps is the subglottal pressure, Pi is the pressure at the glottal end of the supraglottal vocal tract and ZVT is the impedance of the vocal tract load.
ZSGT represents the subglottal network of tubes connecting the lungs to the glottis.
In the simplest case, vocal fold vibration can be approximated as simple harmonic motion in response to an aerodynamic force F due to the Bernoulli effect. F acts perpendicularly to the tissue surface of the vocal folds and depends on the mean intra-glottal pressure P over the medial surfaces of the folds. From Bernoulli's energy law, P is approximated by [11]:
1 A (4)
where Agi and Ag2 are the cross sectional areas at the glottal entry and exit respectively. According to the myoelastic-aerodynamic theory, negative pressure from Bernoulli forces causes the vocal folds to be sucked together, creating a closed airspace below the glottis. Continued air pressure from the lungs builds up underneath the closed
folds. Energy is transferred to the tissue by the air and when this pressure becomes sufficiently high, the folds are blown outward, thus opening the glottis and releasing a single pulse of air. The lateral movement of the vocal folds continues until the natural elasticity of the tissue takes over, and the vocal folds move back to their original, closed position. Then, the cycle begins again with each cycle producing a single pulse of air.
It may be shown that Bernoulli forces alone cannot account for continuous energy conversion from air stream to tissue as the oscillations would die out with time. For the vocal folds to sustain oscillation, there must be a negative pressure within the glottis. As pressure from the lungs is always positive, the inertia of the air column in the vocal tract plays an important role in producing negative glottal air pressure [11]. When the glottis is opening and air from the lungs is moving upward, the air column is accelerated by the increasing glottal flow which creates a positive pressure P that drives the folds apart. When the glottis is closing, the airflow begins to decrease, but the air column above the glottis continues to move with the same speed because of inertia. A condition where air is not coming through from the bottom of the glottis as fast as it is leaving above arises, resulting in a suction region of negative pressure just above the vocal folds where the air pressure is reduced. In other words, when the vocal folds are opening, fluid pressure against the walls is greater than when the vocal folds are close together. Oscillation is sustained by the asymmetric driving force [11], giving rise to a two mass model of the glottis, depicted in Fig. 1-7, that incorporates an acoustic tube representing the vocal tract. The force produced by the glottal airflow when it interacts with the acoustic tube of the glottis sustains glottal oscillations.
Experimental observations of the vocal folds show that the bottom of the folds are farther apart than the upper part of the folds at some points in the cycle [8][11]; the glottal path takes on a convergent shape (Agl<Ag2) with the airflow converging. On the other hand, the airflow diverges when the lowermost parts of the vocal folds are closer together; this is a divergent glottal shape (Agl>Ag2). In order to model the out of phase motions of the upper and lower parts of the folds, the vocal folds are divided into two masses ml and m2 [12] coupled by springs. The pressure drop along the glottis depend on the cross-sectional areas Agi and Ag2. The changes in these cross-sectional areas are the consequence of the motion of masses ml, m2. The displacement amplitude of the
masses is determined by the subglottal pressure Ps, the initial configuration of the folds described by cross-sectional areas Agi, Ag2 at the rest position, the masses ml, m2 and the airflow velocity Ug. The driving pressure also depends on the supraglottal pressures [8][11]. Average air pressures within the glottis tend to be larger in the convergent glottal configuration than in the divergent shape, resulting in the asymmetry of air pressures needed to sustain oscillation.
I
I
I
I
I
L
glonttal
gion
u,•uJL LLCIregion
Fig. 1-7: A two mass model of the glottal oscillator.
Glottal
region
...-..- |~ _ I. _ I
1.3 Overview of speech synthesis
Synthetic speech is produced by several techniques, which may be broadly classified as follows:
(a) Concatenation synthesis, which uses pre-recorded samples from natural speech; (b) Formant synthesis, which uses source-filter models to elucidate the transfer
function of the vocal tract and pole frequencies of the speech signal;
(c) Linear prediction coding (LPC) based synthesis, which like formant synthesis is based on a source-filter model;
(d) Sinusoidal synthesis, which is based on the assumption that the speech signal is represented by a sum of sinusoids with time varying amplitudes, frequencies and phase;
(e) Articulatory synthesis, which directly models the human vocal tract and speech production system.
The various speech synthesis techniques are described below in more detail together with a discussion of their merits and drawbacks.
1.3.1 Concatenation synthesis
In concatenation synthesis, speech is produced by connecting appropriate units of pre-recorded utterances drawn from an inventory of basic synthesis units. The fundamental frequencies and durations of the synthesis units are altered by signal processing. Special algorithms and rules have been developed to ensure that spectral concatenation discontinuities between units are smoothed away. The choice of synthesis units impacts the quality of the synthesized speech and there is usually a trade-off between unit type, speech quality, and memory. The inventory of basic synthesis units is built by first recording natural speech such that all used units are captured. The units are then segmented and labeled. Finally, the most appropriate units are selected. To produce naturally sounding speech, the chosen prototype units must be concatenated in a natural way. To this end, the Pitch Synchronous Overlap Add (PSOLA) algorithm [16] was developed to enable the pre-recorded units to be concatenated smoothly in time and allows control for pitch and duration. It works by using overlapping segments and
smoothing each segment with a Hanning window such that neighbouring segments blend naturally. The Hanning window is centered around successive time instants called pitch marks. On voiced parts of the speech, the pitch marks are set at a pitch synchronous rate. On unvoiced parts, they are set at a constant rate. The pitch can be manipulated through the time intervals between pitch marks and the duration through repetition or omission of segments. A drawback with PSOLA is the presence of tonal artifacts in unvoiced parts of the speech.
Some common basic synthesis units used to form the inventory of utterances are words, syllables, demi-syllables, diphones, phones and sub-phones. Longer basic synthesis units are advantageous over shorter ones as they have fewer concatenation points and thus preserve continuity over a longer time scale. Moreover, it has been found that longer units have relatively smaller discontinuities at concatenation points. With longer basic synthesis units, the trade-off is a larger inventory for a vocabulary of a given size.
Words can be used as the basic synthesis unit for systems with limited vocabulary. The advantage is that intra-word co-articulation effects are captured within the pre-recorded unit. It is not suited for a large vocabulary as the number of words become prohibitively large. Moreover, pitch and formant discontinuities arising at word boundaries, among other things, also contribute to a difference between words spoken in isolation and in a continuous sentence. The result is unnatural sounding continuous
speech. Multiple representations of each unit spoken in various contexts has to be recorded and used in conjunction with sophisticated rules in order for the concatenated
speech to sound natural.
Syllables and demi-syllables are shorter synthesis units derived from words. It has been reported [13] that approximately 1000 demi-syllables are sufficient to obtain the estimated 10,000 syllables in the English language, making the memory requirement feasible. However, co-articulation effects between units is a problem.
Diphones are speech units that comprise the last half of a phone followed by the first half of the next phone. They have the property that they preserve the transition between phones. In general, the middle portion of phones is the most spectrally stable region and relatively spectrally consistent across phonetic contexts. Hence, the use of
diphones as the basic unit of synthesis tend to result in small concatenation discontinuities. Research has been conducted to supplement established diphone inventories with longer units to improve the synthesis of highly co-articulated phone sequences. Several diphone based synthesis systems have been reported [14][15] and augmented diphone systems form the basis of many commercial and research text-to-speech systems.
Phone-based speech segments are difficult to connect in a natural manner because they are subject to contextual variations in the acoustic realization of each phoneme. Sub-phone units have also been proposed for use in speech synthesis. Although sub-Sub-phones also have a degree of contextual variation, it has been observed that speech becomes more acoustically similar on these time-scales. Hence, the synthesis units can now be represented by a single vector of spectral parameters, making it amenable to state based models such as vector quantization (VQ) and hidden Markov models (HMM).
Concatenation synthesis has fundamental limitations. Data collection and segmentation require much time and effort. As the basic inventory is applicable to only one speaker, the synthetic speech cannot be altered to sound like a specific speaker without incorporating that speaker's voice. There is no straightforward means to obtain the optimal set of prototype units from natural speech and rules have to be developed to
concatenate them in a smooth manner.
1.3.2 Formant synthesis
Vocal tract behaviour can be considered in terms of its overall transmission characteristics or its distributed properties. The former is the basis of formant synthesizers while the latter is exploited in articulatory synthesis described later in § 1.3.5. Prior to the advent of concatenation synthesizers, formant synthesizers were probably the most widely used. A formant synthesizer is designed to simulate the acoustic output of the human speech process. Generally, three formants are required to produce intelligible speech. A typical formant synthesis system comprises 3-4 resonant circuits each having a frequency range that corresponds to the first three formants of average human speech and a bandwidth of 70-100Hz. A fourth resonantor provides for a nasal formant. Each formant is usually modeled with a two-pole resonator. A larynx pulse generator provides
the input to the resonators. For fricative sounds, a white noise source is used as the input. The first dynamically controlled formant synthesizers consisted of electronic resonators connected in series or in parallel [17][18]. More modem formant synthesizers employ dedicated digital hardware or simulation in place of analog circuitry [18][19].
1.3.3 Linear prediction coding based synthesis
Linear prediction coding (LPC) [20][21] is one of the most effective techniques for speech coding and is widely used in vocoders. A block diagram of a LPC vocoder is shown in Fig. 1-8. LPC performs linear predictive analysis on a finite number of previous speech frames using an all-pole assumption. It deconvolves the contributions of the source and filter by fitting an all-pole filter to the signal. The resulting spectral representation is constrained to a pth order polynomial form, where p is order of the LP analysis. The output of the LP analysis is a vector of coefficients that generates, within an all-pole modeling constraint, a spectrum that best fits the input spectrum over the speech frame. The input speech waveform is also inverse filtered based on estimated filter coefficients to produce an error signal from which pitch is derived. The source is approximated by either a train of impulse-like spikes from the error signal in the case of the LP vocoder or random noise. The main drawback of the LPC method is its all pole assumption which models nasals and nasalized vowels poorly because coupling of the nasal tract introduces zeros into the spectrum. Stop consonants are also modeled poorly mainly because of the short time-scale associated with such events compared to typical frame sizes.
Synthetic
speech
signal
Fig. 1-8: Block diagram of linear predictive vocoder.
1.3.4 Sinusoidal synthesis
A block diagram showing the concept of sinusoidal synthesis is shown in Fig. 1-9. The system may be divided into a speech analysis section and a speech synthesis section. A target speech waveform (input) is first given a sinusoidal representation by using short-time Fourier transform (STFT) to extract phase, frequency and amplitude information [22]. Sine-wave generators then produce sinusoids with the appropriate phase, frequency and amplitude. All the component sinusoids are summed to produce a synthetic output. While the sinusoidal representation is suitable for representing periodic voiced speech signals, it is unclear how well it could approximate unvoiced speech segments with poorly defined or random phase. Some sort of phase randomization may be required for such speech segments.
Target sound
SPhase-zs DFT -Frequency-*
-Amplitude-*
Synthesized sound
Fig. 1-9: Block diagram of sinusoidal analysis and synthesis system (adapted from [22]).
1.3.5 Articulatory synthesis
Articulatory synthesis is the generation of speech from a bio-physical model of the vocal tract with system parameters that are based on human physiology. It tries to model the human speech production system as closely as possible and hence potentially the most satisfying method for producing natural sounding speech. Potentially, articulatory modeling can also help provide a better understanding of how humans produce speech and thus advance the understanding of speech production. It has also been suggested that incorporating articulatory features in speech parameterization may help to improve recognition. More importantly, an articulatory synthesizer is the crucial link that closes the analysis-by-synthesis feedback loop between auditory processing and
speech production [23][24].
In the past, several approaches to articulatory synthesis have been attempted [25][26][27][28][29]. Stevens et al [26] built a static electrical analog of the vocal tract
using discrete elements. A dynamically controllable electrical analog of the vocal tract is described in [27] using vacuum tube technology. Other methods that involve solving discretized partial differential equations [25][28] or a chain matrix approach [29] are computationally intensive and require the use of high-speed computers to perform in a reasonable amount of time.
In this thesis, we develop an experimental integrated-circuit (VLSI) analog vocal tract by exploiting the analogy between sound propagation in tubes and electromagnetic wave propagation in transmission lines. In our silicon VLSI implementation, we map fluid volume velocity to current, fluid pressure to voltage, and linear and nonlinear mechanical impedances to linear and nonlinear electrical impedances. We drive the analog vocal tract using an area function produced by a physiological model that enables speech signals of interest to be produced using parameters that correspond to elementary articulators and hence functionally related to how the biological vocal tract is articulated.
Chapter 2
ELECTRICAL MODEL OF SPEECH
PRODUCTION SYSTEM
In this chapter, we describe circuit models for the various components of the speech production system. The circuit models are implemented in Matlab (Simulink) and combined to build a dynamic transmission line model of the vocal tract. The vocal tract model consists of 35 cascaded ir-sections whose cross-sectional areas are specified by a vocal tract area profile. As there is a direct mapping between the computational model and analog circuit primitives, an analog integrated circuit implementation is feasible.
2.1 Overview of circuit model
Fig. 2-1(a) [30] shows a cross-section of the speech production system highlighting the three main components namely, the glottis within the larynx, the subglottal system and the supraglottal vocal tract. Fig. 2-1(b) is the corresponding schematic diagram describing it as an equivalent system of connected tubes and cavities.
Fig. 2-1(b) also shows the supraglottal vocal tract subdivided into three regions: the pharynx, the oral/mouth cavity and the nasal cavity. A structure called the velum separates the oral and nasal cavities. As described in Chapter 1, the lungs and respiratory muscles provide the vocal power supply. Voiced speech is produced by air expelled from the lungs causing the vocal folds to vibrate as a relaxation oscillator. The ejected air stream flows in pulses and is modulated by the vocal tract. In unvoiced speech, sounds are created by passing the stream of air through a narrow constriction in the tract. They can also arise by making a complete closure, building up pressure behind it, and then followed by an abrupt release. In the first case, a turbulent flow is produced while in the second case, a brief transient excitation occurs. The puffs of air are shaped into sound waves of speech and eventually, radiated from the lips and/or nose.
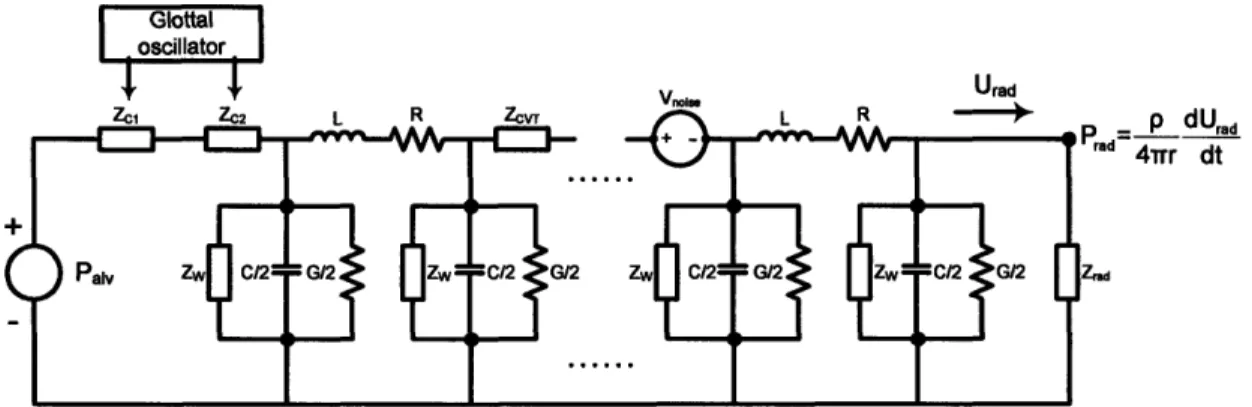
In Chapter 1, we showed that a system of connected acoustic tubes and cavities can be analyzed in the electrical domain using transmission lines. Fig. 2-2 shows our circuit model of the vocal tract. The pharyngeal and oral cavities are modeled as
transmission lines of lengths ýl and £2. The nasal tract is modeled as a third transmission line of length k3 that is coupled to the oral cavity through a velar impedance Zv. The
pharyngeal and oral transmission line parameters vary with time during speech production, corresponding to changes in cross sectional area. With the exception of one or two sections that serve to couple the nasal tract to the main vocal tract, the transmission line parameters of the nasal tract remain relatively fixed and do not change during speech production.
lum al Supra-Mty glottal Sub-glottal
I
(a) (b)Fig. 2-1: (a) Cross-section (adapted from [30]) and (b) schematic diagram of functional components of the speech production system.
The pharyngeal transmission line is terminated at one end by a glottal impedance
ZGc modeling the glottal constriction formed by the vocal cords. ZGC is a nonlinear
impedance that serves to model the constrictions created by the opening and closing of the vocal folds in the glottis and thus model turbulent and laminar flow in the vocal tract. The glottal impedance is modulated by a glottal oscillator to model the opening and closing of the vocal folds. As the bronchial and tracheal tubes are relatively large compared to the glottal constriction, the pressure drop across them is small: The subglottal pressure and the alveolar (lung) pressure Pwa are almost the same. Moreover, the subglottal pressure is maintained nearly constant over the duration of several pitch
periods by the low impedance lung reservoir. In our model, the subglottal source is represented as a voltage source denoted by Paiv.
For consonant production, a supraglottal constriction ZSGc is included within the oral cavity that comprises a constriction impedance and a turbulent noise source. The oral and nasal cavities are terminated by radiation impedances Zrad and Zrad. The radiated sound pressures from the lips and nose, i.e., Prad and Prad in Fig. 2-2, are proportional to the derivative of the current flowing in the respective radiation impedances. The proportionality constant scales inversely with distance from the mouth and nose.
Ul.1
Glott
Palv
Fig. 2-2: Circuit model of vocal tract for speech synthesis.
2.2 Model of the glottis
2.2.1 Current source modelVocal fold vibration produces a periodic interruption of the air flow from the lungs to supraglottal vocal tract. At most frequencies of interest, the glottal source has a high acoustic impedance compared to the driving point impedance of the vocal tract. Consequently a current source may be used as the electrical analog that approximates the volume velocity source at the glottis. Fig. 2-3 shows an example of one period of a volume velocity (flow) waveform, Ugl, and its time derivative, (dUgi/dt) obtained from a typical voiced glottal cycle. Fig. 2-4 shows the spectrum of Ugi. From the figure, we observe that the magnitude of the harmonic components decrease with frequency in an
approximately 1/f fashion. The approximate 1/f spectral roll-off is attributable to the closing of the glottal opening (as the vocal folds adduct) which produces a step-like change in dUgi/dt. For male voices, the fundamental lies in the range of 100-150 Hz.
0 0.001 0.002 0.003 0.004 0.005 0.006 0.007 0.008 0.009 500 0' -500 -1000 -1500 0 0.001 0.002 0.003 0.004 0.005 0.006 0.007 0.008 0.009 0.01 Time [s]
Fig. 2-3: An example of one period of a voiced glottal waveform (with a 10 ms glottal period) and its derivative.
Frequency [Hz]
Fig. 2-4: Spectrum of glottal volume velocity waveform.
... . . . . . .. i.... ... m
..
.
..
....
..
.
..
.
..
..
.
.
..
.
)0 ... · ... .. ... .... .... .... ... .... ... ... .. .. ... .... ... ... ... .. .. .... ... ... . ... ... .... .. .. ... .. ... ..-. .... ... ... ... ... ... ... ...·In the production whispered speech where voicing is absent, the periodic glottal waveform is replaced by turbulent noise. In this case, a random noise current source may be used to excite the vocal tract.
2.2.2 Variable impedance model
Poiseuille's Law states that the pressure difference AP across a uniform cylindrical tube of length 1 and radius r is related to its volume flow rate U as follows:
8
=pl (5)
4r
where g is the viscosity of the fluid in the tube. The viscous resistance 81/h r4 depends linearly with viscosity p. and the length 1, but has a fourth power dependence on the radius. Poiseuille's law is found to be in reasonable agreement with experiment for uniform liquids (Newtonian fluids) in cases where there is no appreciable turbulence.
However, when air flows through a constriction, in addition to the viscous component due to Poiseuille's Law, there are also contributions due to losses at the transitions [8]. These losses arise from eddies that form at the vicinity of the contraction and expansion of the tube and are dissipated as heat. Experimentally, it has been found that the pressure drop due to these losses is related to the dynamic pressure in the
constricted tube:
pU k 2 (6)
AP = kL-P u)
L2
A
Fig. 2-5 illustrates the relationship between volume velocity U and pressure difference AP, with cross sectional area A as a parameter [8]. The dashed lines represent the relation described by (6). The solid lines show the effect of incorporating the losses due to laminar (viscous) resistance, described by (5), with the losses occurring at the expansions and constrictions, described by (6). We observe that viscous losses in the constriction become important at small cross-sectional areas and small airflows where the constriction resistance is larger because the flow is laminar rather than turbulent. Using the electrical analogy V for pressure drop and I for volume velocity, note from the figure that V = I2 in turbulent flow compared with V = I for the laminar case. Thus, the I-V curve looks like a square root in the case of turbulent flow and linear in the laminar case. Hence the turbulent case performs "compressive gain control" at high V's, and reduces
the net current flow compared with the laminar case, but at low V's, the laminar case produces less flow current. In analogy with nonlinear resistor I-V curves, if we think of the turbulent regime as "saturated square root flow" and the laminar regime as "linear flow", and the transition as the saturation voltage, then a small constriction or large resistance has a larger saturation voltage. The I-V curve of an electrical equivalent of a narrow constriction should look like the solid lines in Fig. 2-5. We can think of the electrical equivalent as a linear resistor connected in series with a square-root resistor where the latter is a nonlinear resistor that has an I-V characteristic described by (6).
C.S.
AP
103 10 !11 0.1cm2 0.02cm2'•oi ?o' lel
Pressure AP Idyneslcm2]
Fig. 2-5: Relation between volume velocity U of air and pressure difference AP of constriction [8] with cross sectional area A as a parameter. The dashed lines represent the relation described by (6). The solid lines show the effect of including the viscous resistance. The cross sectional area A of the constriction varies from 0.02 cm2 to 0.1 cm2
in 0.02 cm2 increments.
We approximate a constriction at the glottis as a narrow cylindrical duct. The glottal resistance may then be modeled using a linear resistance in series with a nonlinear resistance as shown in Fig. 2-6. A glottal constriction also has acoustic mass, which may be represented as an inductance that is connected in series to the glottal constriction
....
.... .. ..
.. . . . . .! . . . . ..
resistance described above. As the area of cross section is small, the glottal inertance is dominated by its mass which, according to (3), may be computed as:
L
plgi
(7)
Agl
where Igl is the length of the glottal duct. Fig. 2-7 shows that the glottal impedance is dominated by the linear resistance Rlin for very small cross sectional areas (Agi < 0.005 cm2) and by the nonlinear resistance RnI for moderate constriction areas (Agl > 0.005 cm2). Fig. 2-7 also shows that the ratio of glottal inertance to the total glottal resistance (given by the sum of Rlin and Rn) begins to saturate after Ag, = 0.005 cm2. During a typical glottal period, the glottal area varies from zero (or close to zero) to about 0.2 cm2 (not shown in Fig. 2-7). Hence, the maximum time constant (Lgi/R) is on the order of 0.15 ms, assuming a transglottal pressure of 8000 dynes/cm2. Compared to a typical
glottal period of 10ms for an average male voice, the time constant associated with the glottal inductance is small and may be neglected for most practical purposes. Moreover, we observed in Fig. 2-4 that glottal waveforms typically show a 1/f2 spectral characteristic: most of the glottal energy is concentrated at low frequencies. A resistor-only glottal model does not take into account the effect of acoustic mass. Nevertheless, we note that for frequencies above 1 kHz, the glottal reactance (oLgI becomes comparable to the total glottal resistance.
Glottal constriction
Rlinear
Ug1
Rnonlinear
AP1 AP2
Fig. 2-6: Electrical model of a glottal constriction as a series combination of linear and nonlinear resistors.
1 0.9 0.8 0.7 0.6 S0.5 0.4 0.3 0.2 0.1 n
x 10.3 I ransglonal pressure Ar'g = OUUU
aynesicm-0 0.002 0.004 0.006 0.008 0.01 0.012 0.014 0.016 0.018 0.02 Area [cm2]
Fig. 2-7: Ratios of glottal inertance (Lgi) to linear and nonlinear glottal resistances (Rlin and Ro1).
Fig. 2-8 shows a model of the glottis consisting of two glottal constrictions connected in series to represent the upper and lower part of the vocal folds. There are two glottal constrictions because the upper and lower folds abduct and adduct with a time lag between them. The displacement of the upper and lower vocal folds with time [8] is shown in the upper part of Fig. 2-8, which clearly illustrates a periodic oscillation with a time lag between the opening and closing of the upper and lower folds. In our model of the glottis, the impedance of each glottal constriction is varied by a glottal oscillator in a corresponding manner. The oscillations in a two mass model of the glottal oscillator described in § 1.2.3 are sustained by a force produced by the glottal airflow when there is interaction with an acoustic tube. In our simple first order approximation of the two mass glottal oscillator, the effect of the glottis-vocal tract interaction is not modeled.
rime Isl
Glottal constriction
Glottal constriction
Rlinear
u
Rnonlinear
iinear
nonlinear
Fig. 2-8: Model of the glottis showing two glottal constrictions connected in series. The displacement of the upper and lower vocal folds with time is shown in the upper part of the figure.
2.3 Model of the supraglottal vocal tract
2.3.1 Pharyngeal and oral cavities
In § 1.2.2, we showed that the electrical analog of an acoustic tube is a transmission line, where voltage along the electrical line corresponds to sound pressure while current is analogous to volume velocity. In the circuit model of Fig. 2-2, the supraglottal vocal tract is represented by a spatially varying transmission line, corresponding to a non-uniform acoustic tube. The distributed transmission line may be approximated by a cascade of sections that forms a ladder network. Fig. 2-9 shows such a discrete representation using a cascade of a-circuit equivalents. Assuming that each
individual n-section represents a uniform acoustic tube of length I and cross sectional area A, the values of L and C in each discrete section are determined from (3). Assuming a lossless line, the characteristic impedance Z at a point on the transmission line and the propagation constant y is given by:
z = pc
(8)
A .2nr .wo Y=J -=J-A c Urad _ P dUrad d 4Trr dtFig. 2-9: The electrical analog of an acoustic tube implemented with an equivalent ladder network comprising an electrical analogs of cylindrical acoustic tube.
Practical values of electrical capacitance and inductance for the purpose of implementation in state-of-the-art very large scale integration (VLSI) technology, may be obtained by scaling the impedance level Z of the electrical analog by a factor l/ks with respect to the acoustic network such that the product of the inductance and capacitance per unit length remain unchanged:
= pl ksAl (9)
LS
ks
A
,
Cs
2
ksA Spc2 Ls 1S L 1 pcCs
ks C
ks-
A
I 1c
L s
-i-
,
where the Ls, Cs and Zs denote corresponding inductance, capacitance and impedance
parameters that have been scaled by 1/ks. The LC product, which determines the propagation speed, is unaffected the impedance scaling. Hence, the frequency
The audible frequency range of human speech spans between 100Hz and 7kHz. Consequently, the shortest wavelength of interest is 5cm. To keep the error introduced by spatial discretization small, the length, t, of the approximating n-sections are kept short compared to the wavelength of sound corresponding to the maximum frequency of interest. To model a vocal tract with a length of 17.5cm, we employ a transmission line comprising 35 n-sections (each 0.5cm long) in our model of the vocal tract comprising the pharyngeal and oral cavities.
2.3.2 Model of the supraglottal constriction
A constriction or narrowing of the supraglottal vocal tract occurs during consonant production. A constriction of the vocal tract increases the resistance to air flow and produces a turbulent flow in the vicinity downstream of the narrowing. Turbulence produces random fluctuations in the air pressure. Consequently, a constriction may be modeled by a constriction impedance ZCVT and a turbulent noise voltage source Vnoise.
The noise source is placed downstream of the constriction as illustrated in Fig. 2-10. For simplicity, the nasal tract has been omitted in the illustration of Fig. 2-10. During the production of consonants in standard American English, a constriction is formed in the oral cavity. There is typically only one supraglottal constriction. The constriction may be velar, alveolar or labial, depending on the location where the narrowing occurs. The location of the constriction determines the type of consonant.
We approximate the constriction impedance ZCVT as a resistive component RcVT in series with an inductive component LCVT. The reactive component of ZCVT is determined by the acoustic mass of the corresponding constricted n electrical analog described in previous section. As in the glottal constriction, the resistive component RcVT is comprised of a combination of linear (Riin) and nonlinear (Rnt) resistive elements in series, corresponding to viscous and eddy current losses, respectively. Fig. 2-11 shows a plot comparing the linear and nonlinear elements of RcvT and the reactive (WLcvT) component of ZCVT for a constriction area A = 0.01 cm2.At frequencies above 1 kHz, the reactive component begins to dominate the constriction impedance for most constriction areas of practical interest (0.005 cm2< A < 0.2 cm2).
Fig. 2-12 plots the ratio of the linear and nonlinear resistive components of RCVT.
The resistive component of the constriction resistance is dominated by the nonlinear resistance at moderate constriction areas (0.01 cm2 < A < 0.2 cm2). For smaller areas Rlin
and R1n become comparable and eventually, the linear resistive component dominates for
areas smaller than 0.0005 cm2. Unlike the glottal constriction, the cross sectional area of a supraglottal constriction varies from zero (or close to zero) to areas as large as 5 cm2
when the vocal tract transitions from a consonant configuration to a vowel configuration. As the constricted vocal passage is progressively opened, there comes a point beyond which negligible turbulent noise is generated. Based on the smallest areas for vowel configurations where it is known that the flow is predominantly laminar, we estimate the crossover point to be about 0.3-0.5 cm2. For these areas, the resistive component of the constriction impedance becomes dominated again by the linear resistance, as there is negligible eddy current loss due to turbulence. At audio frequencies, the linear resistance is negligible compared to the reactive component comprising the acoustic inductance of the cylinder.
In summary, the resistive component RCVT is only relevant for small cross sectional areas and does not interfere with the production of vowels. Moreover, the nonlinear element of RCVT is the dominant component for all but the smallest constriction areas.
p dU,,d
4Trr dt
0 0 A=0.01 cm2, Rlin /Rnl=0.0704 --F--- awUR . .. I . . I
..
...
..
..
i..
...
...
...
...
..
....
..
...
..
..
....
..
..
..
..
....
..
..
...
..
...
..
...
...
...
...
...
...
...
..
...
....
....
...
...
...
...
...
...
... ... ... : :· ····· ···...··· ... ... ... .... ... ... ... ... ... ... ...:··· ···· 200 400 600 800 1000 1200 1400 1600 1800 2000 Frequency [Hz]Fig. 2-11: Plot comparing the linear and nonlinear elements of RCVT and the reactive
(wLcvT) component of ZcvT for constriction area A = 0.01 cm2.
0 0.02 0.04 0.06 0.08 0.1 0.12 0.14 0.16 0.18 0.2 Area [cm2]
Fig. 2-12: Ratio of the linear and nonlinear resistive components of RCVT.
41 ...1...;...r... ... '' '... ... ... ...... . .... ... ... ...··· z · · · · ·;·· ... ~ ~~ ~ --- · · · .~... . ...... : ...··'·· ·· · · ··. ~ '' ' '' ' ' '' '' ~'... .. -% ... ...······~· ·· ... .'' .. . ... '' '.:... .. .. ·· ·· . ... ··5 ···· ...···· S. .... ... ··· · ·· ·· · ·... ... .... . ... ···· · · ... ... ... ... ... ... ,
![Fig. 2-1: (a) Cross-section (adapted from [30]) and (b) schematic diagram of functional components of the speech production system.](https://thumb-eu.123doks.com/thumbv2/123doknet/13942782.451875/30.918.202.653.373.694/cross-section-adapted-schematic-diagram-functional-components-production.webp)