WORKING PAPER 2 – 2019/E
THE CIRCULATION OF PEOPLE
Amir H. Delju, Etienne Piguet, Martine Rebetez and Abdullah Ceylan
DROUGHT-INDUCED HUMAN
DISPLACEMENT IN TURKEY
Authors
Amir H. Delju, Etienne Piguet, Martine Rebetez, Abdullah Ceylan
Amir H. Delju, World Meteorological Organization (WMO), Geneva, Switzerland [email protected]
Etienne Piguet, Geography Institute, University of Neuchatel, Neuchatel, Switzerland [email protected]
Martine Rebetez, WSL Swiss Federal Research Institute, Neuchatel, University of Neuchatel, Neu-chatel, Switzerland
Abdullah Ceylan, Turkish State Service (TSMS), Ankara, Turkey [email protected]
1
Abstract
This paper analyses the correlation between drought spells, using the
Standardized Precipitation Index and internal migration in rural communities in
Turkey between 2007 and 2015. It aims to assess the quantified and
evidence-based relationship between the compound effect of drought and migration in
Turkey. As the correlation coefficient between the SPI and the Rate of Net
Migration showed direct links between drought and internal migration, we arranged
the twelve statistical regions of Turkey into three groups: a) magnet for migrants, b)
neutral regions, and c) sources of out-migration. Based on the review of reference
materials, it appeared that economy and security were the most powerful
non-climate factors that affected migration. In our analysis, we demonstrate that the
impact of drought varies across the country depending on each region’s climate
pattern, socio-economic situation, security, and stability. The net impact of drought
and climate variability on migration in Turkey is determining, yet not absolute. It
hides behind non-climatic elements, some of which appear as strong drivers for
migration. The study also revealed that in the regions where security was not an
issue, wet periods coincided with a lower flow of out-migration from rural areas.
Finally, we have noted that the economic diversification of Turkey presents
attractive opportunities and thus affects the preferred choice of rural emigrants for
internal displacement.
Keywords
Drought
Climate
Impact assessment
Agriculture
Internal migration
Turkey
Acknowledgments
The authors are grateful to Turkish State Meteorological Service (TSMS) and the
Turkish Statistical Institute for making meteorological, and demographic and
migration data available to them. We also express our thanks to the Organization
for Economic Cooperation and Development (OECD) for granting the authors
access to its online library in order to obtain socioeconomic and agricultural data,
as well as to Mr. Nirina Ravalitera, Scientific Officer with the World Meteorological
Organization (WMO) for drawing SPI/RNM and rainfall diagrams.
2
1. Introduction
The purpose of this paper is to explore and describe the correlation between drought as a natural climatic “push factor” and human displacement amongst small-holding farmers and rural communities in Turkey. In order to assess the net impact of moderate to extreme droughts as push factor and environmental stressor on internal migration dynamics between 2007 and 2015, we monitored the movement of rural populations in drought periods, particularly in Eastern and Central Anatolia, which are the main croplands of the country. Push factors here refer to those factors that lead populations to leave their homes.
Droughts are classified into four types: meteorological, hydrologic, agricultural and socio-economic (Wilhite D. et al. 1985). There are many ways in which droughts differ from most other climatic events, especially as their onset and end do not occur in a distinct way; they creep in slowly and linger, especially socio-economic droughts until all their multifaceted impacts have faded away (Wilhite D. et al. 1985). According to the Intergovernmental Panel on Climate Change (IPCC)’s Fifth Assessment Report (AR 5) (2013), with high confidence, droughts during the 21st century will have bigger magnitude and longer duration than those observed since the beginning of the 20th century in many parts of the world (Masson-Delmotte, V. et al. 2013, p. 386). Furthermore, under scenario RCP 8.5 of the IPCC (2014), “in presently dry regions, drought frequency will likely increase by the end of the 21st century” (medium confidence) (p.14).
There is no one definition proposed for drought and each type of it has a unique definition, while all are interlinked in one way or another. For the purpose of this study, we have used standardized precipitation (McKee et al. 1993), which is routinely used to characterize meteorological drought. Droughts threaten agriculture and food security globally. According to Wilhite D. & Glantz M. (1985), they develop in slow temporal patterns and underlying impacts may remain for a long period of time, even during wet periods. However, each drought presents a unique set of impacts based on its onset, period, intensity and geographical coverage. These vary according to its severity, length, and spatial extent, as well as on social and economic factors and dynamics (Wilhite D. et al. 1985).
Based on the above considerations, we selected Turkey for a number of reasons: a) the ease of access to high standard meteorological data, b) the availability of a wide range of socio-economic information required for this study, and c) the important contribution of agriculture to Turkey’s GDP.
2. Geography
2.1. GeographyTurkey lies between 39° North and 35° East. It connects Southeastern Europe to Southwestern Asia. Turkey has eight neighboring countries: Armenia, Bulgaria, Georgia, Greece, Iran, Iraq, Nakhchivan, and Syria. This country is surrounded by large bodies of water such as the Mediterranean Sea in the south, the Aegean Sea in the west, and the Black Sea and the Sea of Marmara in the north (CIA 2017).
2.2. Climate
We have used data from the Turkish State Meteorological Service (TSMS) to present the climate of Turkey. According to Sensoy S. et al (TSMS 2008), summers in Turkey are hot and dry, while winters are generally mild to cold and wet. However, winters in the eastern part of the country are severe and temperatures of −30°C to −38°C can be observed in the
3
mountainous areas. In terms of rainfall, Sensoy S. et al (TSMS 2008) have recorded an annual average of 2,200mm in the Black Sea coasts (Ritz and Hopa), and 250mm to 300mm in Konya, Central Anatolia, and in Iğdır, Eastern Anatolia. For the period 1971-2000, TSMS (2008) has reported annual average precipitation in Turkey of about 640mm, showing a decreasing trend of 29mm per 100 years.
2.3. Socioeconomic factors
According to the Investment Support and Promotion Agency of Turkey (hereafter “ISPAT”) (2017), although industry and services are the main drivers of Turkey's economy today, traditional agriculture and the food industry still account for about 20% of the working population. Between 2002 and 2016, ISPAT (2017) data shows that the contribution of agriculture to Turkey’s overall GDP increased by 40% and averaged a contribution of 9% between 2000 and 2010. In 2016, this contribution represented USD 52.3 billion or 6.1% of Turkey’s GDP (Investment Support and Promotion Agency of Turkey 2017; CIA 2017). Moreover, this country has been the world’s 7th largest agricultural producer (OECD 2012; Investment Support and Promotion Agency of Turkey 2017). Over the past decade, however, a number of industrial sectors such as the automotive industry, information, and communication technology (ICT), and tourism, have become more lucrative and profitable than agriculture. As a result, they now play an essential role in the country’s economy, in particular as sources of employment.
Perception of drought period is different in various localities, depending on their climate system, however, in all cases, lower than “normal” precipitation is a prerequisite. For example, in dry regions lack of precipitation or very little rainfall for several months is considered a drought, while in wet regions, the absence of precipitation for two consecutive weeks or so establishes drought condition. After their onset, droughts continue for a much longer period. Beyond these quantitative elements, socioeconomic drought differs markedly from the other types because it associates the supply and demand of some economic good or service with elements of meteorological, agricultural, and hydrological drought. In other words, it implies that the lack of proportion between water supply and corresponding population requirement is one of the indicators in the severity of socioeconomic drought (Wilhite D. et al. 2014).
Drought vulnerability assessment helps better understand a broad range of socio-economic impacts and put it in a conceptual framework (González Tánago I. et al 2016). Vulnerability in drought-stricken areas depends on population, the social condition of people and their dependency on water (Wilhite D. et al. 2014). Drought severity depends not only on natural factors such as the period, intensity and geographical coverage but also on water-intensive human activities and the type of vegetation in the affected region (Sivakumar et al 2002). Nevertheless, in all scenarios, early preparedness against droughts can significantly reduce vulnerability and its impacts (Sivakumar M.V.K. et al 2002). In a comprehensive approach to drought early warning, a combination of physical elements from precipitation to other data such as water supply and soil moisture are considered all together with social indicators (Wilhite D. et al. 2014).
2.4. Demographics
Since 2007, Turkey has established the Address-Based Population Registration System (ABPRS) to implement more efficient public services and to obtain updated information on population, localities and population movements. Before 2007, in and out-migration in provinces and regions were not available to the authors of this paper.
4
According to the ABPRS and TurkStat (TurkStat 2015), the country's population was 77.7 million as of 31 December 2014. The percentage of people living in the province and district centers increased from 77.3% in 2012 to 91.3% in 2013 (TurkStat 2015). Looking at TurkStat (2015) data, one can see that this sharp increase is linked to the establishment of fourteen new metropolitan municipalities and the enlargement of municipal areas by the merging of towns and villages in all of the country’s thirty metropolitan provinces. In 2014, the percentage of people living in the province and district increased again to reach 91.8% (TurkStat 2015).
In 2014, according to TurkStat (2015), İstanbul was the most populated province with 18.5% of the total population. Other provinces, in order of population magnitude, were: Ankara (6.6%), İzmir (5.3%), Bursa (3.6%) and Antalya (2.9%). The least populated province was Bayburt, in Northeast Anatolia, with 80,607 inhabitants.
3. State of the Art
Direct and indirect studies of drought-related migration have been conducted in various regions of the world; many of which may be used for developing insights into future trends. Although most of these studies focus on cross-border migration, they confirm that drought indirectly affects household income and triggers in-country human displacement, particularly among younger inhabitants, who are potentially more able to look for job opportunities in major cities and provinces. For example, Dell M. et al. (2012) show that in poor countries, “a 1°C rise in temperature in a given year reduces economic growth that year by about 1.3 percentage points” (p.67). Furthermore, Dell M. et al. (2012) argue that higher temperatures in poor countries not only reduce agricultural output, they also lead to “reductions in industrial output and political stability” (pp. 92-93).
In terms of resilience and adaptability to drought, climate and weather conditions such as drought and flood appear to be natural threats to agricultural production and have the potential to disrupt feedstock prices (Deloitte 2010). Other researchers further show that income level and poverty play a determining, yet not absolute, role in migration from rural areas (Leighton M. 2011; Janvry de A. et al. 1997, in Piquet E. eds. 2011).
Researchers such as Afifi T. et al. (2015) have mostly focused on another climatic parameter, rainfall, and related climatic events including floods, drought, seasonal shift, and dry spells. They consider rainfall to be one of the most important climate variables affecting the livelihoods of farmers and pastoralists in rural areas worldwide (Afifi et al. 2015).
While drought episodes can lead to migration, not all of them do. In most vulnerable communities, migration is the last option to cope with food insecurity, which can be caused by drought (Afifi T. et al. 2015). This simple fact, noticeable in rural areas, leads to a range of theoretical, conceptual and empirical challenges for those who work with environment and migration issues. The livelihoods and well-being of populations in rural areas, villages and towns are closely tied to agriculture and other natural resource-based activities. Such activities are intrinsically sensitive to climatic variability.
As a number of regions may become more frequently exposed to severe drought conditions, the net effect of climate-induced changes in the agricultural sector is likely to generate more migration out of the agricultural sector and into non-farming opportunities. As employment opportunities further decline, there would be an increase in rural out-migration from more marginal areas “exacerbating urbanization and long-term, more distant patterns of migrations for those who are able” (Black R. et al. 2008, p. 56). It is interesting to consider this trend in conjunction with the key role played by natural
5
population increase in urbanization (Cohen B. 2003) and the establishment in Turkey of fourteen new metropolitan municipalities and the enlargement of municipal areas in 2014. Furthermore, beyond unemployment, which can be an important factor in migration decision, cultural variables, such as common languages and shared history, also play an important role in decisions to migrate (Afifi T. et al. 2008). This is probably the case in Turkey, where industry and tourism are two growing sectors, which serve as population magnet and revenue diversification sources in different geographical regions of the country. This might increase the pace of domestic rural-urban migration, and, to a lesser extent, international migration. According to the World Bank, “this increased migration will likely follow well-established migration networks, making it hard to isolate the extra migration due to climate change” (Haddad M. and Shepherd B. 2011, p.293)
When considering the impact of drought-induced economic pressures, Chen Y. et al. (2009) use a Coupled Regional Economy-Ecology Model to draw a two-way interaction between the ecosystem and a regional economy with consumption and production pattern. In contrast, the economic gap can also stand as a key factor for one-way migration. Collier et al. (2011) argue that “higher incomes in destination countries provide a strong ‘pull’ factor, while low incomes in the countries of origin exert a ‘push’ to migrate” (p. 3). However, in terms of vulnerability on an international scale, purely economic aspects aside, low- and lower-middle-income countries are less resilient to climate change than high-income countries and their livelihoods are more vulnerable (Stern N. 2007).
In contrast to the purely economic argument on migration, other groups of scientists focus on vulnerable communities’ access to vital resources, such as water and soil. For example, Grey at al. (2011) has looked at the effects of soil quality on population mobility, aiming to understand better the correlation between soil condition, especially soil moisture and “human migration or other social outcomes for potentially vulnerable households” (p. 1). A further interesting concept here is that of natural capital. According to research by Ellis F. (2000), in agricultural households, soils can be regarded as a form of natural capital. Natural capital also includes land, water, and wildlife. It supports rural livelihoods and complements reserves of human, social and physical capitals (Ellis F. 2000; Nawrotzki R. J. et al. 2012).
Further to the above-mentioned approaches, researchers argue that, except in extreme cases, population displacements are always the result of a multi-causal relationship between environmental, political, economic, social, and cultural dimensions (Piguet E. et al. 2010, p. 1). It is indeed undeniable that climate change has a range of diverse impacts across countries (Black R. et al. 2011). In fact, according to Warner K. et al. (2014), the question is not whether environmental drivers are the sole factors triggering human displacement, but rather how the interactions of these factors lead to migration choices. Another possible interpretation of such results is that climatic impacts are so complex that they cannot be entirely explained by a single aspect. However, we believe that the physical and social impacts of drought are more clearly observed and tracked in climate-sensitive sectors, particularly in water and agriculture.
We have noted through our analysis that most of the studies on drought and migration did not conduct an independent analysis of climatic parameters; rather they have based their interpretations and conclusions on overall global and regional climate change reports, which were intended for other purposes. Additionally, in the majority of cases, calculations of the climatic parameters, particularly temperature and rainfall, are conducted separately and without making meaningful linkages. In the case of drought, there are standardized methodologies which factor in either rainfall or additional parameters such as temperature,
6
evaporation and soil moisture - depending on the availability of such datasets, as well as on climatic patterns and geographical circumstances. These methods help draw quantified values for the intensity and frequency of droughts. Furthermore, the results produced following such methods can be compared across different regions with markedly different climates.
Research on migration patterns, which used non-climatic data, often faces issues of lack of consistent and comparable indicators such as time-series data on net migration (Sherbinin A. D. et al. 2012). Analysis of time-series is an ideal way to capture climate-induced consequences. Recent research by Dallmann I. et al. (2017) focused on India has used the Standardized Precipitation Index (SPI) for their study in combination with census data to analyze bilateral migration rates. The results in their paper show that drought frequency acts as a push factor on “inter-state migration in India”. There are other case studies such as Kadirbeyoglu Z. (2009)’s EACH-FOR Turkey Case Study Report, which are based on interviews of local communities by a team of experts, that show that in certain cases (e.g. Suruç district, Urfa city), long drought periods combined with groundwater depletion have led to forced migration. Such extreme cases are very few and cannot be attributed to the whole country.
4. Hypothesis
Based on the existing literature, our overall assumption for this case study is that drought is a natural push factor and environmental stressor only in synergy with socioeconomic parameters. Furthermore, it acts as a multiplier of pressure on local water access, agricultural productivity and employment (Delju A. H. et al. 2012), which in turn might lead to internal migration. This is especially the case in the agricultural sector where the impact on living conditions could be such that a proportion of the farmer community might be forced off their land. We assume that drought and desertification threaten rural households directly by affecting resources such as land and water and indirectly by contributing to the decline of agricultural income or rural employment (Leighton M. 2011; Piguet E. et al. 2010). Figure 1 identifies a number of direct and indirect parameters, which play a role in the drought-induced migration process. The indirect impacts of drought were not in the scope of this paper. This figure shows that migration should not only be seen as a short-term escape strategy, but also as a long-short-term adaptation strategy to reduce vulnerability to income fluctuation and security instability. Nevertheless, obviously, a more in-depth understanding of how climatic factors affect migration choices will help to shape adequate policies and investments strategies (Warner K. et al. 2014).
7
Figure 1: A conceptual model of physical and social factors in drought-induced migration
5. Data and methods
5.1. Climate DataWe have used the monthly mean precipitation data of two hundred and ten synoptic and climatological stations in Turkey for the period of 1971 to 2015. A distribution map of these stations is given in figure 2. Although this period was much longer than the demographic data available to authors, we have chosen the longest period and a maximum number of stations with reliable data to provide a full understanding of the frequency and intensity of drought spells in Turkey. In climatology, the general recommendation by the World Meteorological Organization (WMO)- (WMO 2011, No. 100) to show secular trends is to use at least thirty-year periods of reference. The data used in this study was made
8
available by the Turkish State Meteorological Service (TSMS). As a WMO operational standard, TSMS historical data archives and climatological time series are quality controlled and calibrated to be free from spurious data and bias, in the case of change of instruments or relocation of the stations. The randomness of the annual data sets of monthly mean precipitation for 1971 to 2015 was investigated by TSMS through tests for homogeneity. The stations with complete time series were selected for data analysis.
Index Climate condition
[+] 2.0 extremely wet [+] 1.5 to [+] 1.99 very wet [+] 1.0 to [+] 1.49 moderately wet [-] 0.99 to [+] 0.99 near normal [-] 1.0 to [-] 1.49 moderately dry [-] 1.5 to [-] 1.99 severely dry
[-] 2.0 and less extremely dry
Table 1: SPI values, Source: WMO 1090, 2012, p4
Figure 2: Distribution of synoptic and climatological stations in Turkey. Courtesy of the Turkish State Meteorological Service (TSMS)
9
SPI/RNM CORRELATION COEFFICIENT PER YEAR AND REGIONS
Year 2007-2008 2008-2009 2009-2010 2010-2011 2011-2012 2012-2013 2013-2014 2014-2015
Region SPI RNM SPI RNM SPI RNM SPI RNM SPI RNM SPI RNM SPI RNM SPI RNM Correlation Coefficient/Region Istanbul -0.46 2.10 1.7 3.06 2.14 7.77 0.48 8.98 0.06 2.20 0.581 4.7 -1.129 1.0 0.966 3.5 0.57 Western Marmara -0.86 9.73 0.56 4.03 2.22 4.62 0.75 4.95 0.31 7.74 0.702 5.9 -0.278 14.0 1.673 6.1 -0.68 Aegean -1.24 3.70 0.79 1.74 1.104 0.10 0.06 0.13 0.55 2.60 0.999 1.6 -0.466 4.6 1.286 3.2 -0.50 Eastern Marmara -0.86 12.57 0.56 6.37 2.22 5.51 0.75 6.18 0.31 5.27 0.702 6.6 -0.278 7.7 1.673 9.7 -0.47 Western Anatolia -0.83 2.98 0.86 4.60 1.25 5.59 1.47 7.05 0.105 3.62 0.702 3.8 -0.278 5.2 1.673 6.6 0.79 Mediterranean -1.06 2.15 0.41 0.52 1.016 0.58 0.12 -1.24 0.86 -1.09 0.293 -0.7 -1.403 0.3 0.463 0.0 -0.49 Central Anatolia -0.83 -9.00 0.86 -4.99 1.25 -8.95 1.47 -8.78 0.105 -4.11 -0.251 -4.8 -1.079 -6.6 1.598 -6.5 -0.16 Western Black Sea 0.66 -4.35 1.1 -2.40 1.36 -11.16 0.39 -8.80 0.51 -3.20 -0.358 -5.7 -0.792 -7.7 0.33 -4.4 0.00 Eastern Black Sea 0.66 -2.24 1.1 0.63 1.36 -8.98 0.39 -9.88 0.51 7.29 -0.358 -3.6 -0.792 -1.8 0.33 -5.9 -0.10 Northeastern Anatolia -0.83 -26.12 0.86 -14.72 1.25 -13.58 1.47 -12.46 0.105 -15.35 -0.225 -19.2 -1.783 -19.3 -0.475 -21.0 0.78 Central-eastern Anatolia -0.91 -10.89 0.04 -9.09 1.3 -9.08 0.25 -16.49 -0.29 -7.19 -0.225 -7.1 -1.783 -12.2 -0.475 -12.6 0.15 Southeastern Anatolia -2.06 -7.56 -0.97 -7.12 0.09 -3.80 -1.07 -4.11 0.005 -7.55 0.271 -5.7 -1.69 -6.1 -0.053 -8.4 0.12 Correlation Coefficient/Yr. 0.017 0.34 0.45 0.05 0.41 0.75 0.83 0.84 0.26
10
5.2. Demographic and Socioeconomic data
Table 3 provides definitions of the demographics related terms used in this paper, as defined by the TurkStat Online Portal (www.turkstat.gov.tr).
Key Definitions of Migration-Related Terms by TurkStat
Internal migration
Internal migration is defined as changes in usual residence
addresses of a population within one year in the specific
areas (region, province, district, etc.) within the country.
In-migration
Migrants who arrive in a specific area from other areas
within the country.
Out-migration
Migrants who depart from a specific area to the other areas
within the country.
Net migration
The difference between in-migration and out-migration for a
specific area. If in-migration is more than out-migration, net
migration is positive. If out-migration is more than
in-migration, net migration is negative.
The rate of Net
Migration (RNM)
The Rate of Net Migration (RNM) is the number of net
migration per thousand (‰) persons who are able to
migrate.
Source: Online http://www.turkstat.gov.tr
Table 3: Key Definitions of Migration-Related Terms
The following socioeconomic data presented in this paper was obtained from the TurkStat online portals. The Demographic data comprises annual internal migration (in and out-migration) in provinces from 2007 to 2015 in the twelve statistical regions (Figure 3), which compose the Nomenclature of Territorial Units for Statistics (NUTS) (Eurostat Statistics Explained, Glossary, 2017) in Turkey. We have calculated the annual Rate of Net Migration (RNM) based on the above-mentioned data.
11
Figure 3: Twelve statistical regions in Turkey - Reproduced on the basis of Eurostat 2017
The data used excludes the rate of international migration because it is not considered as a possible outcome of environmental consequences in Turkey. This obviously is a limitation of our study. However, the scientific literature generally considers that the main migratory consequences of environmental changes are internal rather than international (Piguet E. 2013). The supplementary socioeconomic data in this paper includes the annual share of agriculture in the GDP of Turkey. This data is used merely to construct a theoretical framework.
5.3. Methods
5.3.1. Standardized Precipitation Index (SPI) for drought monitoring
We have used the Standardized Precipitation Index (SPI) for monitoring meteorological drought based on the long-term precipitation data for the period 1971-2015. However, due to limited demographic data, only the period 2007-2015 was chosen to study the correlation between drought and the net rate of migration. We have calculated 1-month aggregation of drought magnitude per year and got mean annual SPI index for the mentioned period. We have followed the WMO methodology (WMO No. 1090, 2012), according to which “the SPI calculation for any location is based on the long-term precipitation record for the desired period” (p. 9). This calculation can result in either positive or negative values, which in this case, correspond to either greater than annual median precipitation, or less than mean annual precipitation. According to the SPI methodology, “drought starts when the SPI value is equal or below -1.0 and ends when the value becomes positive” (WMO No. 1090, 2012, p. 9).
According to McKee et al. (1993), the advantage of the SPI method is that it defines peak intensity and the accumulated magnitude of the drought. We have calculated 1-month aggregation of drought magnitude per year and got mean annual SPI index.
They express Drought Magnitude (DM) as (p. 2): 𝐷𝑀 = −∑ 𝑆𝑃𝐼𝑖𝑗
𝑥 𝑗−1
12
A further advantage of the SPI is that it provides a better representation of anomalies for wet and dry spells than the Palmer Drought Severity Index (PDSI) (Guttman, N.B. 1998, pp 113–121).
However, the SPI is sensitive to the quantity and reliability of the data used to fit the distribution. Researchers recommend using at least thirty years of high-quality data (McKee T.B. et al. 1993). We have chosen to use the SPI for drought monitoring because it is a preferred index for regions with reasonable precipitation patterns. The SPI is more applicable to regions where the volume, seasonality, and form of precipitation differ widely between each of the locations (WMO No. 1090, 2012). In addition, the WMO methodology presents it as effective in analyzing both wet and dry periods/cycles (WMO, 2012).
5.3.2. Rate of Net Migration (RNM)
According to the definition by TurkStat (TurkStat 2017), the Rate of Net Migration is “the number of net migration per thousand persons who are able to migrate”. Its calculation is shown in table 4.
The Rate of Net Migration (RNM)
The Rate of Net Migration (RNM) is calculated by the following formula:
m
(.i-i.) =[(M
.i- M
i.)/(P
i,t+n-0,5*( M
.i-M
i.))]*k
Where:
m
(.i-i.):
Net migration rate
M
.i:
In-migration
M
i.:
Out-migration
M
.i- M
i.:
Net migration
Pi,t+n:
Population residing in "i" at the time "t+n"
i:
The place in which migration is defined
k:
Constant (k=1000)
13
5.3.3. Correlation coefficients between drought indices and Rate of Net Migration (RNM)
We have applied statistical correlation coefficients to find out whether two variables, namely the mean annual drought indices in the SPI and the annual Rate of Net Migration (RNM), are meaningfully correlated or not. The following equation is used for the correlation coefficient:
𝐶𝑜𝑟𝑟𝑒𝑙(𝑋, 𝑌) = (𝑥 − 𝑥̅)(𝑦 − 𝑦̅) √(𝑥 − 𝑥̅)2 (𝑦 − 𝑦̅)2
Since the period of the RNM demographic data available to the authors was limited to 2007-2015, we had to limit the SPI analysis at the regional level to 2000-2015 as well, to be consistent. We deliberately chose to focus our empirical analysis on simple statistical methods as the lack of control variable impaired the building of a multi-variant model.
6. Results
The SPI analysis is based on observed precipitation data. Figure 4 shows the anomalies of annual average precipitation from 1950 to 2015 compared to the 1971-2000 base period. The charts in figure 5 represent mean annual values of SPI for the different regions of Turkey for the period 2000-2015. Although we would have preferred to run calculations of the SPI values at the regional level for the period 1971-2015, from a practical standpoint, we chose the recent decade as it matched the demographic data available to us more accurately and allowed establishing a more meaningful correlation between findings of drought analysis and internal migration. The SPI values in Figure 5 show a constant dry period starting in 2004, which reached an extremely dry level in 2008, particularly in Marmara, Aegean and Southeastern Anatolian regions. This was immediately followed by a particularly wet year in 2009, which caused widespread flooding in the Black Sea, Marmara, and Mediterranean regions. In 2013, the case of extreme drought shifted Eastward, affecting predominantly the Central and Eastern Anatolia regions. The accumulation of these extreme conditions has had a severe negative impact on the agricultural sector and has put additional pressure on already burdened farmers and herders. A comparison between the SPI values and share of agricultural sector in the gross domestic product (GDP) in figure 6 (Statista 2018) from 2007 to 2015 shows that the mentioned share decreases in 2007 and 2008 followed by 2013-2015, inclusive and it increases in wet years, from 2009-2012.
The annual rate of net migration for the period 2007-2015 (Figure 7) shows a relatively low level of temporal variability. Despite climatic variations, the regions that are gaining or losing migrants remained largely the same during the selected period. Along with table 2, Figure 7 shows that the correlation coefficients for a given year and for the years after a drought spell are discernibly larger than for wet years; yet, not strong enough to relate them exclusively to drought. For example, coefficients for 2012-2013, 2013-2014 and 2014-2015 are bigger than in preceding years: this can be attributed to post-drought migratory behavior in the impacted regions.
14
Figure 4: Anomaly of annual average precipitation for 1950-2015 as compared to the 1971-2000 base period -150 -100 -50 0 50 100 150 200 19 50 19 55 19 60 19 65 19 70 19 75 19 80 19 85 19 90 19 95 20 00 20 05 20 10 20 15 A n o m al ly
15
Figure 5: Annual mean values of Standardized Precipitation Index, Turkey (2007-2015) - (Charts by A. Ceylan, TSMS)
16
Figure 7: Annual Rate of Net Migration (‰) per year at twelve statistical regional levels (data source: TurkStat) -30.00 -25.00 -20.00 -15.00 -10.00 -5.00 0.00 5.00 10.00 15.00 20.00
Rate of Net Migration (‰) by Statistical Regionsp per year
2007-2008 2008-2009 2009-2010 2010-2011
17
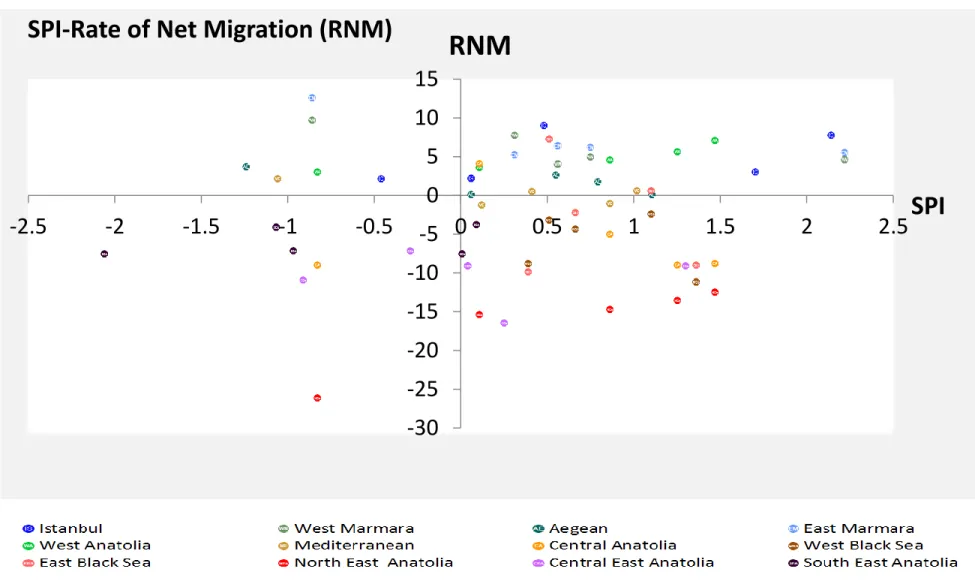
It is interesting to note at this point that, as shown in Figure 8, in some regions such as Northeastern Anatolia, wetter periods are associated with lower levels of emigration. To shed light on this, we computed a series of correlation coefficients (Table 2). Although we conducted a significance testing of the correlation coefficient, we did not report it in the table as our data represents the whole population and not a random sample. The first series of coefficients (bottom line of the table) allows answering the question: “during a certain year, are wetter region attracting more migrants?” Whereas the second series of coefficients (last column of the table) allows answering the question: “is there an impact of the SPI on net migration over the years?” Both positive and negative values for the correlation coefficients between the SPI and the RNM can be observed in Table 2. The difference between negative and positive correlations is stronger in dry years such as 2008, 2013 and 2015. Although there is no systematic and strong direct link between drought and migration on a year-region basis, according to the findings available to us, we can still draw some interesting facts. As a result, we have classified the twelve statistical regions of Turkey in three groups by the typology of drought-migration-economy-security nexus:
Group 1: Magnet for internal migrants: mainly western parts of Turkey, including Istanbul, Western and Eastern Marmara, and Western Anatolia.
Group 2: Neutral: mainly central parts of Turkey, including Central Anatolia, Aegean, and the Mediterranean. The rate of net migration in these Regions has remained nearly stable both in dry and wet periods.
Group 3: Source of out-migration: mainly eastern parts of Turkey, including Southeastern, Centraleastern and Northeastern Anatolia.
According to this classification, the regions in Group 1 are major economic hubs in the country. On the other extreme, the regions in Group 3 have recorded the highest rate of out-migration. This is particularly the case for Anatolia, which faces security instability.
18
Figure 8: Scattered distribution of regions per annual mean values of drought index and rate of net migration (SPI/RNM)- Turkey (2007-2015)
-30
-25
-20
-15
-10
-5
0
5
10
15
-2.5
-2
-1.5
-1
-0.5
0
0.5
1
1.5
2
2.5
RNM
SPI
SPI-Rate of Net Migration (RNM)
19
7. Discussion
In this study, we have identified two sets of polarized regions in the east (group 3) and west (group 1), and a neutral region in the central part of Turkey (group 2). The least developed areas with a high level of instability (group 3), such as Eastern and Southeastern Anatolia, are more vulnerable to drought occurrences than other regions and are a clear source of migration. In these regions, where traditional agriculture remains the main source of income, the Gross Domestic Product (GDP) is below the national average and unemployment is also higher than in the western, more urban regions. Additionally, the socio-economic vulnerability in these regions is combined with deep security concerns. As a result, even in wet periods and appropriate climatic conditions, out-migration flow does not cease.
Regions in group 1 however, such as Istanbul, Western/Eastern Marmara, and to some degree Western Anatolia, serve as population magnet and hubs. The correlations for Western and Eastern Marmara were negative, even though the above-mentioned Regions are among the top four GDP per capita (Eurostat 2017). This is probably due to the wider economic effect of neighboring Istanbul. However, both mentioned regions may require further socio-economic study, beyond drought impact. These areas, with more metropolitan cities, offer better job opportunities and wider settlement options. Therefore, these regions have a more diversified economy and drought does not disrupt their socio-economic stability. This confirms the notion that annual or biennial drought by itself cannot stand as a sole push factor for migration. This conclusion is somehow different if the drought persists over a number of years and is amplified by one or more pull factors, such as economic growth in the tourism and industry sectors, which might trigger population movements. The above considerations have played a determining factor in the establishing of new metropolitan municipalities and the required enlarging of municipal areas of the past ten years.
Turkey has a heterogeneous geographical, economic, and social landscape. Internal migration thus affects population distribution and dynamics. Geographical heterogeneity might in some cases support economic diversity and opportunities for localities, which are more exposed to droughts, floods, and other climate extremes. Although these findings provide meaningful quantifiable information rather than categorical types of data, we found out that, due to the multi-causal nature of migration, especially east-west migration, the relation between drought and migration is neither simple nor direct.
In social systems, the predominant reaction of human beings to physical changes in the environment is complex and includes both direct and indirect aspects. Nevertheless, it is clear that the intensity and duration of drought has a counter effect on agricultural production, GDP, and employment in this sector.
In this study, we show that climate and environmental impacts are intrinsically combined with economic and social impacts. Historical trends show that migrants, in the case of droughts, prefer to move internally with the aim of moving back to their homes and communities once the drought is over. However, the surveillance of population migration out of the Northeastern and Southeastern regions of Turkey shows that security issues play a stronger role than drought and associated social and financial factors in migration decisions and clearly contribute to the east-west internal movement of populations.
20
8. Conclusion
This study has explored the correlation between drought and the rate of net internal migration at the regional level in Turkey. Our study shows that drought slowly brings about direct impacts. Though not in the scope of this paper, obviously, subsidiary implications are generally observed, such as poverty and unemployment, which influence a household’s decision on migration, particularly during extreme and prolonged droughts. It should, however, be noted that economic aspiration and security instability concerns are the main drivers for internal migration in Turkey. This is especially the case for people living in rural areas, attracted by neighboring urban life, which offers more diversified job opportunities, public support facilities, and stable living conditions. In fact, the sharp rise in the growth of metropolitan municipalities and the enlargement of the municipal borders in Turkey over the past ten years support the findings of this study. These findings are applicable to the country under study, Turkey, and cannot be translated to other countries without a similar analysis or extrapolated to a global discussion on the complicated interaction between drought and migration. We have noted that ultimately, migratory behaviors may differ from one city and region to another, depending on the overall climatic and socioeconomic situation.
We finally conclude that natural sciences alone are not likely to provide all the needed answers and insights in the drought-migration nexus, and thus interdisciplinary research on drought impact assessment will be critical to future socio-economic studies.
21
9. References
Afifi T., Warner K. 2008 The Impact of Environmental Degradation on Migration Flows across Countries. UNU Institute for Environment and Human Security (UNU-EHS).
Working paper No. 5/2008. Available online at
http://www.risk-award.org/dms/MRS/Documents/WorkingPaper2008_Warner_AfifiEnvironmentalDegradati onAndMigration.pdf. Retrieved at 18:15 on 22 March 2015.
Afifi T., Milan A., Etzold B., Schraven B., Christina Rademacher-Schulz, Sakdapolrak P., Reif A., Geest K. van der, and Warner K. 2015. Human mobility in response to rainfall variability: opportunities for migration as a successful adaptation strategy in eight case
studies. Migration and Development. Routledge, Taylor and Francis Group. doi:
10.1080/21632324.2015.1022974. Retrieved by [37.201.214.164] at 01:13 on 08 May 2015.
Black, R., Kniveton, D.R., Skeldon, R., Coppard, D., Murata, A., and Schmidt-Verkerk, K. 2008. Demographics and Climate Change: Future trends and their policy implications for migration. Issued by the Development Research Centre on Migration, Globalisation and
Poverty, University of Sussex. Working Paper T-27. Available online at
https://www.unicef.org/spanish/socialpolicy/files/Demographics_and_Climate_Change.pdf. Retrieved at 22:40 on 24 September 2017.
Black R., Arnell N., Dercon S., Geddes A., Thomas D. 2011. The effect of environmental
change on human migration. Global Environmental Change, Vol. 21, Sup. 1, 3-11.
The Central Intelligence Agency (CIA). 2017. Turkey. The World Factbook. Available online at https://www.cia.gov/library/publications/the-world-factbook/geos/tu.html
.
Accessed on at 8:12 on 29 September 2017.
Chen, Y., Irwin, E.G. and Jayaprakash, C. 2009 Dynamic modeling of environmental
amenity-driven migration with ecological feedbacks. Ecological Economics, Vol. 68, issue
10, 2498-2510. doi:10.1016/j.ecolecon.2009.01.012
. Retrieved at
10:41 on 6 April 2015.Cohen, B. 2003 Urban growth in developing countries: A review of current trends and a
caution regarding existing forecasts. World Development, Vol. 32, no. 1, 23–51.
doi:10.1016/j.worlddev.2003.04.008
. Retrieved at
21:49 on 22 September 2017.Collier, P. and Hoeffler, A. 2011 Quantitative analysis of determinants of international migration. Migration and Global Environmental Change, Government Office for Science, Foresight, UK. Retrieved at 15:11 on 6 September 2017.
Dallmann I. and Millock K. 2017: Climate Variability and Internal Migration: A Test on Indian Inter-State Migration, Working Document from the Centre d’Economie de la
Sorbonne, Université Paris 1, France
. Retrieved at
22:40 on 23 May 2015.Delju, A. H., Rebetez, M., Ceylan A., Piguet E. 2012 Observed Climate Variability and
Change in Urmia Lake Basin, Iran. Theoretical and Applied Climatology, Springer- Verlag.
doi 10.1007/s00704-012-0651-9. Retrieved at 15:51 on 9 May 2012.
Dell M., Jones, B. F. and Olken B. A. 2012 Temperature Shocks and Economic Growth:
Evidence from the Last Half Century. American Economic Journal: Macroeconomics, Vol.
4, no. 3, 66–95. http://dx.doi.org/10.1257/mac.4.3.66
. Retrieved at
16:43 on 5 October 2015.22
Deloitte 2010 Turkish Agriculture Industry Report, Republic Of Turkey Prime Ministry,
Investment Support and Promotion Agency of Turkey
. Retrieved at
22:37 on 13 May2013.
Ellis F. 2000 Rural livelihood and diversity in developing countries. Oxford University Press. The UK.
Eurostat 2017 Glossary: Nomenclature of territorial units for statistics (NUTS), Statistics Explained, Eurostat. Available online at
http://ec.europa.eu/eurostat/statistics-explained/index.php/Glossary:NUTS
. Retrieved at 20:50 on 03 October 2017.Gray, C. 2011 Soil quality and human migration in Kenya and Uganda. Global
Environmental Change, Issue 21, Vol. 2, 421-430. oi:10.1016/j.gloenvcha.2011.02.004
.
Retrieved at
21:23 on 15 August 2015.González Tánago I. 2016 Learning from Experience: A Systematic Review of
Assessments of Vulnerability to Drought, Natural Hazards DOI 10.1007/s11069-015-2006-1. Retrieved at 11:47 on 19 July 2018.
Guttman, N.B. 1998 Comparing the Palmer drought index and the Standardized
Precipitation Index. Journal of the American Water Resources Association, Vol. 34, No.1,
113–121. Retrieved at 21:55 on 5 September 2017.
Haddad M. and Shepherd B. 2011,
Managing Openness: Trade and Outward-orientedGrowth After the Crisis, © World Bank,
p.293.
https://elibrary.worldbank.org/doi/book/10.1596/978-0-8213-8631-6
IPCC 2014 Summary for policymakers. In: Climate Change 2014: Impacts, Adaptation, and Vulnerability. Summaries, Frequently Asked Questions, and Cross-Chapter Boxes. A Contribution of Working Group II to the Fifth Assessment Report of the Intergovernmental Panel on Climate Change, Field, C.B., V.R. Barros, D.J. Dokken, K.J. Mach, M.D. Mastrandrea, T.E. Bilir, M. Chatterjee, K.L. Ebi, Y.O. Estrada, R.C. Genova, B. Girma, E.S. Kissel, A.N. Levy, S. MacCracken, P.R. Mastrandrea, and L.L.White (eds.), World Meteorological Organization, Geneva, Switzerland, pp. 1-32. Available online at
https://www.ipcc.ch/pdf/assessment-report/ar5/wg2/WGIIAR5-IntegrationBrochure_FINAL.pdf
- Retrieved at 09.13 on 09 September 2017.Investment Support and Promotion Agency of Turkey (2017), Invest in Turkey website. Available at http://www.invest.gov.tr
Janvry de A., Key N., Sadoulet E. 1997 Agricultural and rural development policy in Latin America: New directions and new challenges. University of California at Berkeley, USA.
Working Paper No. 815.
Kadirbeyoglu Z. 2009 Turkey Case Sturdy Report. EACH-FOR Environmental Change and Forced Migration Scenarios Specific Targeted Project Scientific support to policies – SSP.
Each-FOR Deliverable D.2.1.1.1. Retrieved at 16:09 9 on February 2017
Leighton, M. 2011 Drought, Desertification and Migration: Past Experiences, Predicted Impacts, and Human Rights Issues. In Migration and Climate Change, Piguet, E., Pécoud,
A. and de Gutcheneire, P. (eds.), Cambridge University Press, Cambridge, United
Kingdom, and New York, NY, USA. Retrieved at 15:29 on 4 September 2017.
Masson-Delmotte, V., Schulz, M., Abe-Ouchi, A., Beer, J., Ganopolski, A., González Rouco, J.F., Jansen, E., Lambeck, K., Luterbacher, J., Naish, T, Osborn, T., Otto-Bliesner, B., Quinn, T., Ramesh, R., Rojas, M., Shao, X., and Timmermann, A. 2013: Information
23
from Paleoclimate Archives. In: Climate Change 2013: The Physical Science Basis.
Contribution of Working Group I to the Fifth Assessment Report of the Intergovernmental Panel on Climate Change, Stocker, T.F., Qin, d., Plattner, G.-K., Tignor, M., Allen, S.K., Boschung, J., Nauels, A., Xia, Y., Bex, V., and Midgley, P.M. (eds.). Cambridge University Press, Cambridge, United Kingdom and New York, NY, USA. Available online at http://www.ipcc.ch/pdf/assessment-report/ar5/wg1/WG1AR5_Chapter05_FINAL.pdf. Retrieved on 16 September 2017.
McKee T.B., Doesken N.J. and Kleist H. 1993 The relationship of drought frequency and
duration of time series. Eighth Conference on Applied Climatology, American
Meteorological Society, January 17-23 1993, Anaheim, CA, pp. 179-186
. Retrieved at
15:43 on 18 January 2014.
Nawrotzki, R.J., Hunter, L. M., Dickinson, T. W. 2012 Rural livelihoods and access to natural capital: Differences between migrants and non-migrants in Madagascar.
Demographic Research, Vol. 26, Article 24, 661-700, Max Planck Institute for
Demographic Research, DOI: 10.4054/DemRes.2012.26.24.
Retrieved at
15:31 on 5September 2017.
The Organisation for Economic Co-operation and Development (OECD) 2012 Agricultural
Policy Monitoring and Evaluation 2012: OECD Countries. OECD Publishing. http://dx.doi.org/10.1787/agr_pol-2012-en. Retrieved at 10:24 on10 July 2013.
The Organisation for Economic Co-operation and Development (OECD) 2012 Agriculture
and food: Key tables from OECD. OECD Library - ISSN 2075-5104.
Retrieved at
10:24 on10 July 2013.
Piguet E., Pécoud A., de Guchteneire P. 2011 Migration and Climate Change. Editions de
l’UNESCO,Paris.
Piguet E. 2010 Linking Climate Change, Environmental Degradation, and Migration: A Methodological Overview. Climate Change, Wiley Interdisciplinary Reviews 1, issue 4,
517-524.
Retrieved at
20:01 on 15 August 2015.Piguet, E. 2013 Environmental change and migration in developing countries. Swiss
Academies of Arts and Sciences, Bern. Available online at
www.akademien-schweiz.ch/de/factsheets
. Retrieved at
21:33 29 on September 2017.Sensoy S., Demircan M., Ulupinar Y., Balata I. 2008 Climate of Turkey. Internal Report by
the Turkish State Meteorological Service (TSMS), P.O. Box: 401, Ankara, Turkey. Retrieved at 13:32 on 7 October 2015.
Sherbinin, A.D., Levy, M., Adamo, S., MacManus, K., Yetman, G., Mara, V., Razafindrazay, L., Goodrich, B., Srebotnjak, T., Aichele, C. and Pistolesi, L. 2012 Migration and risk: net migration in marginal ecosystems and hazardous areas.
Environmental Research Letters, Vol. 7, Issue 4. doi:10.1088/1748-9326/7/4/045602. Retrieved on 16/12/2013 at 19:39
Sivakumar M.V.K. Wilhite D. 2002, Drought preparedness and drought management,
https://www.researchgate.net/publication/267362571,
Retrieved at 20:59 on 20 September 2018.Stern N. 2007: The Economics of Climate Change. The Stern Review, UK. Retrieved at 19:08 on 10 September 2017.
Svoboda M. and Fuchs B. A. (eds.) 2016 Handbook of Drought Indicators and Indices. World Meteorological Organization (WMO) and Global Water Partnership (GWP), Geneva,
24
Switzerland. WMO No. 1173. Available online at
http://www.droughtmanagement.info/literature/GWP_Handbook_of_Drought_Indicators_an
d_Indices_2016.pdf. Retrieved at 12:31 on 19 July 2013.
Statista- World Bank,
https://www.statista.com/statistics/255494/share-of-economic-sectors-in-the-gross-domestic-product-in-turkey/
. Retrieved at 21:05 on 01 August 2018.Turkish Statistical Institute (TurkStat) 2015, Press Release - No: 18616. Turkish Statistical Institute, Ankara, Turkey. Retrieved at 10:00 on 28 January 2015.
Turkish Statistical Institute (TurkStat) 2017, Definition of migration-related terms. Available
online at
http://www.turkstat.gov.tr/VeriBilgi.do;jsessionid=lcpLZ01K34G56wLCvxzfXzrhJ50nGJdGX
zwMTLWncM9kYpnCrqgb!213544638?alt_id=1067.
Retrieved
at
09:34
on
29
September 2017.
Warner, K., Afifi, T. 2014 Where the rain falls: Evidence from 8 countries on how vulnerable households use migration to manage the risk of rainfall variability and food
insecurity. Climate and Development, Vol. 6, Issue 1, 1–17.
http://dx.doi.org/10.1080/17565529.2013.835707. Retrieved at 3:25 on 19 May 2015. Wilhite, D. A., and Glantz, M.H. 1985 Understanding the drought phenomenon: The role of definitions. Water International, Vol. 10, Issue 3, 111-120.
Retrieved at
13:46 on 9September 2017.
Wilhite, Donald A., "Chapter 1 Drought as a Natural Hazard: Concepts and Definitions",
2000. Drought Mitigation Center Faculty Publications.
http://digitalcommons.unl.edu/droughtfacpub/69 . Retrieved at 20:50 on 13 October 2018. Wilhite Donald A., Sivakumar M.V.K.M Pulwarty R., 2014 – Managing drought risk in a
changing climate: The role of national drought policy.
https://www.researchgate.net/publication/262879312. Retrieved at 20:44 on 13 October 2018.
The World Development Indicators 1960-2016. Based on the data set released
2016-05-01 and accessed 2016-06-07. Available online at
http://elibrary.worldbank.org/action/showDataView?region=AF. Terms of
use http://go.worldbank.org/OJC02YMLA0
.
World Meteorological Organization (WMO) 2012, Standardized Precipitation Index User
Guide. © World Meteorological Organization, Geneva, Switzerland. WMO No. 1090.
Available online at http://www.wamis.org/agm/pubs/SPI/WMO_1090_EN.pdf
.
Retrieved at22:29 on 19 January 2014.
World Meteorological Organization (WMO) 2011, Guide to Climatological Practices. ©
World Meteorological Organization, Geneva, Switzerland, WMO No. 100. Available online at
http://www.wmo.int/pages/prog/wcp/ccl/guide/guide_climat_practices.php
. Retrieved at 15:01 on 19 January 2014.25
List of Tables
Table 1: SPI values, Source: WMO 1090, 2012, p4
Table 2: Mean annual SPI and Annual Rate of Net Migratıon (RNM) correlation
coefficients in 12 Statistical Regions in Turkey
Table 3: Key Definitions of Migration-Related
Table 4: Rate of Net Migration Calculation (Source: TurkStat)
Figure Captions
Figure 1: A conceptual model of physical and social factors in drought-induced
migration
Figure 2: Distribution of synoptic and climatological stations in Turkey. Courtesy of the Turkish State Meteorological Service (TSMS)
Figure 3: Twelve statistical regions in Turkey - Reproduced on the basis of Eurostat 2017
Figure 4: Anomaly of annual average precipitation for 1950-2015 as compared to the
1971-2000 base period
Figure 5: Annual mean values of Standardized Precipitation Index, Turkey
(2007-2015) - (Charts by A. Ceylan, TSMS)
Figure 6: Share of Agriculture in Turkey's GDP (2007-2017), Statista, 2018
Figure 7: Annual Rate of Net Migration (‰) per year at twelve statistical regional levels (data source: TurkStat)
Figure 8: Scattered distribution of regions per annual mean values of drought index and rate of net migration (SPI/RNM)- Turkey (2007-2015)
Electronic Reference
Delju, Amir; Piguet, Etienne; Rebetez, Martine; Ceylan, Abdullah. « Drought-Induced Human Dis-placement in Turkey », Working Paper series MAPS [online], 2 | 2019, https://www.unine.ch/files/live/ sites/maps/files/shared/documents/wp/WP_2_2019_Delju_Piguet_Rebetez_Ceylan.pdf
Contact :
MAPS - Maison d’analyse des processus sociaux Rue A.-L. Bréguet 1 CH - 2000 Neuchâtel Tél. +41 32 718 39 34 www2.unine.ch/maps
La reproduction, transmission ou traduction de tout ou partie de cette publication est autorisée pour des activités à but non lucratif ou pour l’enseignement et la recherche.
Dans les autres cas, la permission de la MAPS est requise.