Working Paper #22
May, 2019
Segregation Patterns among
Foreigners in Switzerland:
Jonathan Zufferey
(University of Geneva)
Segregation Patterns among
Foreigners in Switzerland:
A Multi-Scalar Approach (1990 – 2014)
The National Centres of Competence in Research (NCCR) are a research instrument of the Swiss National Science Foundation
The nccr – on the move is the National Center of Competence in Research (NCCR) for migration and mobility studies. It aims to enhance the understanding of contemporary phenomena related to migration and mobility in Switzerland and beyond. Connecting disciplines, the NCCR brings together research from the social sciences, economics and law. Managed from the University of Neuchâtel, the network comprises fourteen research projects at ten universities in Switzerland: The Universities of Basel, Geneva, Lausanne, Lucerne, Neuchâtel, Zurich, ETH Zurich, the Graduate Institute Geneva, the University of Applied Sciences and Arts of Western Switzerland, and the University of Applied Sciences and Arts of Northwestern Switzerland.
The Working Papers Series is an online platform for academic debates by members and cooperating partners of the nccr – on the move. The authors are responsible for the analyses and arguments, which do not necessarily reflect those of the nccr – on the move.
nccr – on the move, University of Neuchâtel, Rue Abram-Louis-Breguet 2, 2000 Neuchâtel, Switzerland Contact for the Working Paper Series: [email protected]
Abstract
This ‘nccr on the move’ working paper examines the settlement and segregation of foreigners in Switzerland between 1990 and 2014. Based on a novel approach that addresses the modifiable areal unit problem common in most of the research on the topic, this paper compares 12 groups of
foreigners at the regional, cantonal and neighborhood levels for the years 1990, 2000 and 2014. The methodological approach relies on ego-centered neighborhoods of various sizes, independently of administrative boundaries, and assesses foreigner spatial distribution in a multi-scalar way. Although foreigners taken together appear to be well disseminated in the country, the results demonstrate high regional concentrations of each foreigner community, which can be explained mainly by historical, cultural and linguistic proximities. At a smaller scale, patterns of segregation are lower, but communities associated with a low-skilled workforce are more segregated at the neighborhood level. Cantonal analysis of segregation highlights the fact that segregation patterns differ considerably depending on the context. Over time, the trends of concentration or
dissemination vary greatly from one foreigner group to another.
Keywords
Segregation, migrant settlement, multi-scalar approach Acknowledgments
This work was supported by the nccr –on the move, which is financed by the Swiss National Science Foundation. I thank Philippe Wanner and Marco Pecoraro for their comments and Christoph Freymond from the Swiss federal statistical office for his collaboration in the data transmission.
Contact
Contents
1 Introduction 5
2 Segregation: Definition and Measurements 5
2.1 Migrant Spatial Segregation: A Review 5
2.2 Research Objectives and Questions 7
2.3 Methodological Issues 8
2.4 A Multi-Scalar Approach of Segregation 11
3 Data Preparation and Measures of Segregation 13
3.1 Censuses and Population Register 13
4 Migrant Populations in Switzerland 16
5 Localization of Foreigners in 2014 18
5.1 Regional Segregation Pattern 19
5.2 Cantonal Segregation 24
5.2 Neighborhood Segregation 27
6 Segregation Changes (1990-2000-2014) 28
7 Conclusions 30
1
Introduction
In recent decades, European economies have experienced profound changes due to
internationalization and globalization processes. Societies have evolved to a post-industrial phase defined by a change in the production system: the rise of white-collar workers, replacing blue ones. Western countries have relied on low-qualified immigrant workers to undertake the low-qualified occupations needed by their economies (Sassen 1988). These evolutions have fostered low-qualified migration flows, settling mostly in the main urban areas, and thus contributing to the growth of the largest agglomerations (Rérat 2012). Although there is no academic tradition of studying segregation in the European context, the issue of migrant spatial localization, and particularly of low-qualified immigrant workers, arises necessarily in societies that host diverse populations in terms of origin and social classes. Where do immigrants settle? Do they concentrate and live segregated from the host community? Or do they disseminate in the host country? How has the spatial differentiation evolved over time? And how does it vary by origin?
These questions will be addressed in this on the move working paper using the Swiss case for the 1990 to 2014 period. The study is based on a new methodological approach that allows first a proper measurement of spatial segregation, and second an analysis of segregation at different scales. We will disentangle patterns of migrant clustering at the macro (regional segregation), the mezzo (cantonal segregation) and the micro levels (neighborhood segregation). Switzerland is an
interesting case for a study of segregation because it hosts a large foreigner population, and its migration flows have evolved at the end of the 20th century. As an aging society with a dynamic labor market, Switzerland has recently been confronted by highly-qualified professional shortages, and thus attracts the highly-qualified workers needed by its economy. At the same time, the country has continued to host low-qualified workers.
In the following pages, a brief review of recent findings on migrant spatial segregation is presented that brings us to the research question of the paper and its main contributions. We then discuss segregation in a methodological perspective and present the nearest neighbors’ approach and its use in studying segregation. Section 3 presents the data used and an example of a multi-scalar
segregation approach in the Zurich area. Section 4 portrays the migrant population living in Switzerland during the 1990 to 2014 period. In section 5, a first overview of migrant location and spatial segregation in 2014 is presented. Section 6 presents the evolution between 1990 and 2014. Finally, section 7 discusses the main results and concludes the paper.
2 Segregation: Definition and Measurements
2.1 Migrant Spatial Segregation: A Review
A high level of segregation is often seen as a problem. In fact, the terminology refers both to a pejorative political notion that indicates inequalities and to a statistical and descriptive concept of population spatial distribution (Genestier 2005). Segregation can be defined as the result of a
process of location of an individual, or a group of individuals, and indicates an idea of enforcement, which is due to a lack of residential choices or too constrained choices. However, in this research, the term segregation will be used in its descriptive sense, a statistical measure, synonym to spatial
Segregation processes can be analyzed through three different lenses which together explain the phenomenon. From an individual viewpoint, one is likely to be willing to live in a valued
environment that corresponds to one’s aspirations (neighborhood, type of habitat, distance to the city center, etc.). However, every territory has geographical inhomogeneities, so that valued
resources are placed unequally in space, and not everyone can live in the best locations (Mazza and Punzo 2016). Although preferences are subjective, and the value of an environment depends on one’s aspirations, individuals’ locations are linked with economic and social resources: only the wealthiest individuals can afford to live in the better-situated and most expensive places. On the other hand, individuals with low economic resources have constrained choices and tend to live in the most deprived areas. Furthermore, these populations – and ethnic minorities in particular – are confronted by discrimination in the housing market which restricts their settlement in some neighborhoods (Massey, Gross and Shibuya 1994). Hedman, van Ham and Manley (2011) also observe a strong pattern of social reproduction in location choices, motivated by a reproduction of individual preferences. The work of Schelling (1971), based on individual propensity to live surrounded by similar populations in terms of social classes, origins, and share values, has shown how the preference for living close to a black or a white majority is sufficient by itself to produce strong segregation patterns. Among migrant communities, this effect may be amplified by family and social networks which help new immigrants to settle in already dense neighborhoods (Zorlu and Mulder 2008).
A society lens reveals how the social and economic division of space pushes certain categories of individuals to do specific tasks and to live in stratified places according to their economic position. Broadly speaking, the division of space applies first at a larger scale: it creates a dichotomy between dynamic and less dynamic regions, and particularly between urban areas and the countryside. Thus, low-qualified migrants often settle in large urban areas where they can find job opportunities conforming to their skills, but they are relegated in the poorest suburbs (Sassen 1988). Ethnic segregation is thus often seen as a problem when it is cumulated with a concentration of poverty. Musterd (2005) observed that not every poor neighborhood is ethnically segregated, but every ethnically segregated neighborhood is poor. However, previous studies in Switzerland have demonstrated concentration patterns in highly-qualified populations (Heye and Leuthold 2004). Through the third lens, housing policies can play an important role in reducing spatial inequalities and uneven population distributions. According to Musterd and De Winter (1998), liberal housing forces contribute to deepening the gap between rich and poor, which active state housing policies can buffer. Researchers have noticed a profound divide between the policies of Anglo-Saxon and European countries. In the United States, the liberal system of laisser-faire perpetuates a racial segregation system that has not been erased in a century. These inequalities are exacerbated by housing market discriminations that push segregated blacks to be economically and socially isolated (Massey, Gross and Shibuya 1994). In Europe, the welfare state, which aimed at reducing housing inequalities, thus brought immigrant segregation down to a low level with a quasi-absence of mono-ethnic enclaves (Musterd 2005), although significant spatial concentrations of poor immigrants can be found in most European cities (Musterd and Ostendorf 1998).
Most of this research has been conducted, unsurprisingly, in the American context, where racial segregation has a long political history and where inequalities between ethnic groups remain large although anti-discrimination laws have been implemented since 1964. On the European continent,
research on ethnic/migrant segregation is relatively scarce, probably because concentration patterns are low. However, in a time of increasing migration flows, there is a growing interest in this topic (Andersson, Lyngstad and Sleutjes 2018). In Switzerland, there are only a few studies on
segregation at the national level. The Swiss federal statistical office computes yearly indicators of spatial differentiation within cantons or within the largest agglomerations of the country. These measures offer first insights into the broad dynamics, which academic research has completed. According to Schuler and Dessemontet (2009), spatial differentiation in Swiss cities is comparable with other countries such as Germany, Belgium, and the Netherlands, but appears to be lower than in the United Kingdom and the United States.
At the regional level, the largest cities attract more migrants: the bigger the size of the city, the larger the share of foreigners. Small migrant communities, in particular, tend to be concentrated in the largest urban areas (Huissoud et al. 1999). Due to cultural proximities, and social, family and historical networks, migrant subpopulations tend to concentrate in some cantons and some regions. Although foreigners are more concentrated in the Latin part of Switzerland (French and Italian) than in the German one, differentiation according to the spoken language is higher in the German part of the country (Hermann et al. 2005).
At a smaller scale, researchers have observed an important heterogeneity in the patterns of migrant segregation according to origin and context. The research project of Huissoud et al. (1999)
demonstrated however that socioeconomic segregation is higher than migrant/foreigner segregation. Thus, in a stratified society, where migrants tend to be low-qualified, they concentrate particularly in suburban areas that attract low-income individuals. Social homogeneity also occurs among the higher social classes. In the Zurich agglomeration, Heye and Leuthold (2004) observed patterns of concentration of highly-skilled foreigners in high-status neighborhoods. In France and in the United States, segregation of high-income individuals is even stronger than among low-income individuals (Quillian and Lagrange 2016). Looking at the evolution of segregation over time in Switzerland, Huissoud et al. (1999) observe no changes between 1970 et 1990, but Schuler and Dessemontet (2009) indicate a move towards the mean in the 1990s, with the most segregated cities showing a decrease in segregation, and the less segregated ones showing an increase.
2.2 Research Objectives and Questions
In a time of increasing migration flows, there is a growing feeling within western societies that migration disrupts local environments and inhabitants’ quality of life (Robinson and Walshaw 2012). Do new migration flows contribute to putting pressure on a delicate balance? To answer this question, there is a need for better understanding and documentation of the consequences of
migration for the local environment. This research offers a wide comparative and exhaustive
overview of segregation processes in Switzerland. It compares various migration groups across time and uses several scales to portray the specificities of spatial localization of migrants. The study is based on an original methodology that uses flexible and precise indicators (see next subsection). The results presented here remain at the descriptive level, but they offer a better understanding of the dynamics of migrant settlement in the whole country and can be used as a reference in further research. This paper contributes to a better understanding of the social and cultural geography of the Swiss population. It aims in particular at answering the three following research questions:
- How are migrant groups spatially located in Switzerland? Are migrants from Southern, i.e.
low income, countries more segregated than those from the North?
- To what extent do segregation dynamics differ by scale? Are migrant groups more
segregated at the regional or the neighborhood level?
- How has segregation evolved in the last three decades? Has Switzerland seen an increase in
migrant concentration in parallel with an increase in migration flows? 2.3 Methodological Issues
Segregation is generally measured by the dissimilarity index of Duncan and Duncan (1955) which compares two populations (X and Y) across areas i (i.e. neighborhoods or municipalities) of a large geographic entity (i.e. a city or a region). The dissimilarity index D ranges between 0, which indicates an even distribution between the two populations, and 1, which indicates absolute segregation. The number D can also be interpreted as the share of individuals of the group X that needs to move in order to obtain an even distribution in the whole area of study. It is computed as followed:
𝐷𝐷 = 12 �𝑛𝑛 | 𝑥𝑥𝑋𝑋 −𝑖𝑖 𝑦𝑦𝑌𝑌 |𝑖𝑖 𝑖𝑖=1
Where:
xi = The population of group X in the ith area. X = The total population in group X
yi = The population of group Y in the ith area Y = The total population in group Y
Despite its wide use, the dissimilarity index has three important deficiencies in approaching segregation. It has been criticized for not being able to reveal the spatial dimension of segregation, and for the arbitrary definition of the areas under study.
“The most widely used segregation measures, such as the Dissimilarity Index, are signally aspatial in that they are global in nature and simply not able to capture local variation” (Brown and Chung 2006, pp.125-126).
The first issue with the dissimilarity index is that it considers each area as independent from the others, and thus does not reveal geographical patterns of concentration within a city. Figure 1 presents four hypothetical population distributions having the same dissimilarity index; for more examples see Brown and Chung (2006). In these examples, the minority (in red) lives absolutely segregated from the majority (in white) according to the dissimilarity index. The patterns are
however not the same and express divergent situations that should not be given the same value D: in a) the minority lives concentrated in the city center; in b) the minority lives concentrated in a
decentralized area; in c) the minority lives in a ring around the city center; in d) the minority lives sparsely in small clusters.
Figure 1: Hypothetical spatial configurations of two populations. They all have the same Duncan dissimilarity index.
Meanwhile, many alternative measures of dissimilarity, which aim to take into account spatial patterns of segregation, have been developed. Among these, it is worth mentioning Morrill’s
dissimilarity index, which considers the population distribution in the adjacent areas (Morrill 1991). Although Morill’s D is more precise, it has been sparsely used in practice, probably because it is more complex to compute. Moreover, Morrill’s D does not solve the other criticisms of the dissimilarity measure, which are as follows.
A second issue intervenes when comparing segregation patterns between delineated areas, due to the fact that the boundaries of the areas under study are partially arbitrary and considered as impenetrable barriers (Wong 2016). This issue, called the modifiable areal unit problem (MUAP) has important consequences:
“The results depend on the delineation of the areal units into which the data are aggregated. Therefore, a particular aggregation at a specific scale can yield an arbitrary result that is valid only for that specific delineation”
(Hennerdal and Nielsen, 2017, p. 2).
The MUAP is inherent to any definition of space and raises the question of how neighborhoods should be conceptualized in order to avoid affecting the measurement of segregation (Fotheringham and Wong 1991). This issue is particularly pertinent for Switzerland, where segregation is often measured using the municipalities of a canton, or the administrative neighborhoods of an agglomeration that do not delineate coherent areas. Schuler and Dessemontet (2009) consider
a) b)
d) c)
indeed that the segregation process matches the urban building structure and not municipality boundaries. Moreover, in recent years, many municipalities have merged for administrative and management purposes; the number of municipalities has decreased from 2’899 to 2’222 between 2000 and 2018, affecting not only the objects under study but also the comparisons across time. To solve this issue, Reardon et al. (2008) dispense with geographical boundaries and measure ego-centered neighborhoods with a radius of a size m. This approach, which implies as many floating neighborhoods as individuals under study, solves the MUAP, but produces heterogeneous
neighborhoods: for a radius of 1’000 meters, some would include thousands of individuals and others only a few, depending on the population density. Östh, Clark and Malmberg (2015) move a step forward in defining ego-centered neighborhoods not according to a distance radius but
according to a number of individuals. Their approach, called the k-nearest neighbors, presumes that the underlying social processes that define an environment vary according to a population size rather than the size of the area. For example, the 1’000 nearest neighbors are those one meets at a local shop or at the bus station, the 5’000 nearest those one meets at school or at a sport club, the 10’000 those one meets at the mall or at a larger city event, etc. Thus, the k-nearest neighbors approach offers comprehensive areas that are flexible, and whose size can be defined by researcher interests.
The third issue when using dissimilarity measures is related to the delineation of the area of study, namely its scale. In 1997, Wong showed that the value of a dissimilarity index tends to decrease with an increasing size of the area of study, because larger areas include more heterogeneous individuals and smooth out local variations (Wong 1997). The larger the units, the smaller the segregation would appear. Therefore every comparison of areas of different sizes can be
problematic (Krupka 2007). This is particularly true for Switzerland where the municipalities, and even the administrative neighborhoods, used in most studies are heterogeneous in size. For
example, measuring segregation within Zurich canton results in comparing municipalities that are so different – the largest, Zurich, has more than 400’000 inhabitants and the smallest, Volken, less than 400 – that the index would hardly represent the patterns of spatial differentiation. However and beyond this statistical artefact, the scale determines also the interpretation and the meaning of the segregation process. Living in a strongly segregated neighborhood of a city, or in a segregated municipality compared to its region, or in a segregated region compared to the whole country does not signify the same underlying process. Very often, the scale on which segregation is computed does not come under discussion, and depends on the available data (census block, neighborhood, municipality, etc) although the scale reveals the underlying processes of segregation. When
comparing populations at a large scale, factors such as job market, social and family networks, and cultural proximity play an important role. But at a local scale, the factors explaining population concentrations are more linked with the housing market and reveal socioeconomic position, individual preferences, and/or discriminations. Low segregation at a large scale can go with high segregation at a smaller scale, or vice versa: the inequalities at a fine scale are embedded in larger spatial contexts. For example, one can live in a segregated block but not in a segregated
neighborhood. For all these reasons, some scholars have called for measuring segregation at more than one scale (Andersson, Lyngstad and Sleutjes 2018, Fowler 2016).
2.4 A Multi-Scalar Approach of Segregation
In order to solve the three issues presented in the last subsection, Hennerdal and Nielsen (2017) propose an innovative approach to measure segregation in a multi-scalar way. Their S index is based on the k-nearest neighbors’ approach of Östh, Clark and Malmberg (2015), and compares floating spatial units (areas of study) embedded in larger floating spatial units (areas of reference). Researchers can, therefore, select the scale for the areas of study (according to a number k of individuals) and for the areas of reference (according to a number K of individuals) and thus
capture segregation in a multidimensional way. The global index of segregation S for a user-defined scale works as follows.
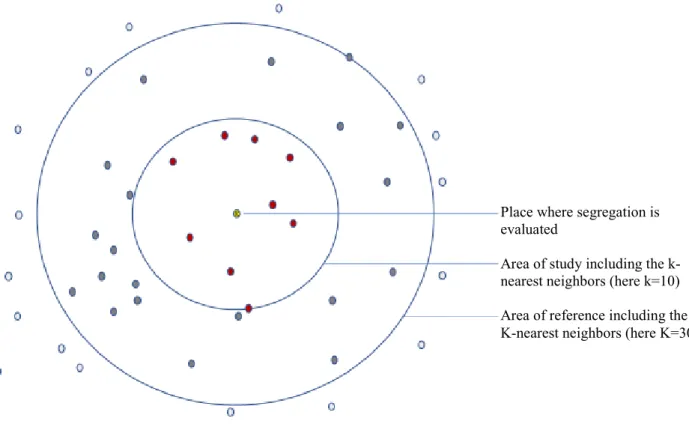
For each populated place, it computes the ratio of the share of a population with a specific
characteristic in the area of study among the k nearest neighbors on the share of the population with the same characteristic in a larger area of reference (see Figure 2 or Nielsen and Hennerdal (2017) for more details). This ratio, also called the location quotient, is a floating measure and varies across space, depending on the nearest neighbors of a specific place. For computation purposes,
inhabitants are generally placed into a grid (for example at the hectare level) in order to facilitate the computation of millions of ego-centered neighbors (Östh 2012).
Figure 2: The level of segregation is evaluated for each populated location by identifying the population that includes the k-nearest neighbors
Then a global index of segregation S is built for the whole space, which expresses the mean under- or over-representation between each area of study and its reference. The result is weighted
according to the size of the population in each populated place and only considers statistically Place where segregation is evaluated
Area of study including the k-nearest neighbors (here k=10) Area of reference including the K-nearest neighbors (here K=30)
significant differences of the area of study compared to the area of reference. Consistently with most segregation measures, it ranges between 0 and 1 and its construction is briefly presented in the following lines according to the work of Hennerdal and Nielsen (2017).
Given 𝑘𝑘, the number of nearest neighbors of a location 𝑗𝑗, and 𝐾𝐾 the larger number of nearest neighbors around 𝑗𝑗, let be:
𝐹𝐹𝑗𝑗,𝑘𝑘: the number of individuals with a property 𝑓𝑓 among the 𝑘𝑘 nearest neighbors of location 𝑗𝑗 𝑇𝑇𝑗𝑗,𝑘𝑘: the total number of individuals1 among the 𝑘𝑘 nearest neighbors of location 𝑗𝑗
𝐹𝐹𝑗𝑗,𝑘𝑘 𝑇𝑇𝑗𝑗,𝑘𝑘
� : the share of individuals with a property 𝑓𝑓 among the 𝑘𝑘 nearest neighbors of location 𝑗𝑗 The location quotient 𝑞𝑞𝑗𝑗,𝑘𝑘,𝐾𝐾 is expressed as the ratio between the share of the population with the property 𝑓𝑓among the 𝑘𝑘 nearest neighbors at location 𝑗𝑗 in comparison with the corresponding share among its 𝐾𝐾 nearest neighbors:
𝑞𝑞𝑗𝑗,𝑘𝑘,𝐾𝐾 = 𝐹𝐹𝑗𝑗,𝑘𝑘 𝑇𝑇𝑗𝑗,𝑘𝑘 � 𝐹𝐹𝑗𝑗,𝐾𝐾 𝑇𝑇𝑗𝑗,𝐾𝐾 �
This ratio reveals an over- or under-representation of a specific population in a specific place for specific 𝑘𝑘 and 𝐾𝐾. For example, if the share of foreigners is twice as big among the 1’000 nearest neighbors in comparison to the 10’000, the quotient would equal 2; the quotient would equal 0.5 for a twice smaller share. In order to express with same values similar under- and over-representation, values of the quotient 𝑞𝑞 smaller than one are transformed into 1/𝑞𝑞.
Only significant variations in the share among the k nearest neighbors and its K nearest neighbors are kept. Significativity, for a level 𝛼𝛼, of over- or under-representation is defined according to a geometric distribution; for more details, see Hennerdal and Nielsen (2017, p. 9). Non-significant values of 𝑞𝑞 are put to 1. This avoids computing estimates on random variations when the numbers are small.
The 𝑆𝑆 index for a location 𝑗𝑗 is a transformation of the location quotient and ranges from 0 to 1, where 0 measures an absence of differentiation between the share of the population with the
property 𝑓𝑓 among the 𝑘𝑘 nearest neighbors in comparison with the corresponding share among its 𝐾𝐾 nearest neighbors, and 1 an infinitely large difference between the shares. It is defined as follows:
𝑠𝑠𝑗𝑗,𝑘𝑘,𝐾𝐾 = 1 −𝑞𝑞1 𝑗𝑗,𝑘𝑘,𝐾𝐾
1 The total number of individuals is not always exactly equal to 𝑘𝑘 since a few more individuals may be included due to the aggregation.
A global index for a whole territory 𝐴𝐴 can then be estimated as a population-weighted mean of the 𝑠𝑠𝑗𝑗,𝑘𝑘,𝐾𝐾 for a level of significativity 𝛼𝛼:
𝑆𝑆𝐴𝐴,𝑘𝑘,𝐾𝐾,𝛼𝛼 =∑𝑗𝑗∈𝐴𝐴∑𝑆𝑆𝑗𝑗,𝑘𝑘,𝐾𝐾,𝛼𝛼𝑡𝑡 ∗ 𝑡𝑡𝑗𝑗 𝑗𝑗 𝑗𝑗∈𝐴𝐴 where 𝑡𝑡𝑗𝑗 is the number of individuals at location 𝑗𝑗.
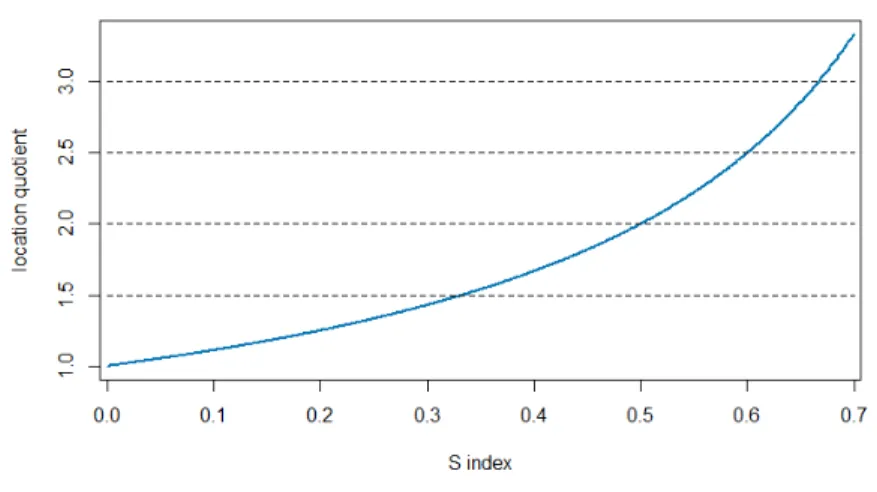
This index 𝑆𝑆 expresses for an area under study the mean over- and under-representation of a sub-population among the 𝑘𝑘 neighbors nested in larger 𝐾𝐾 neighbors. As already mentioned, a value of 0 indicates no segregation and a value of 1 an absolute segregation. A value of 0.5 means that the location quotients are on average twice as big or twice as small among the population; 0.33 (one third) means that the mean location quotient is equal to 1.5. Figure 3 expresses the relation between the mean location quotient value and the corresponding level of segregation according to the S index.
Figure 3: relation between the S index and the location quotient
3 Data Preparation and Measures of Segregation
3.1 Censuses and Population Register
The data used in this study are cross-sectional information about the whole resident population living in Switzerland: the 1990 and 2000 population censuses and the 2014 population register2. For the analysis, the individuals living in collective households3 (such as hospitals, retirement homes, prisons, etc.) and those whose residence has not been assigned to an existing building were excluded. The data comprises geocoded localization at the hectare level. Between 1990 and 2014, the number of inhabited hectares rises from 310’000 to 340’000.
2 The data are exhaustive but there is a slight difference in the definition of the population: in the censuses, the respondents have answered about their economic residence, and the population registers are about the main residence. They nevertheless both include the whole resident population, i.e. the permanent and non-permanent populations according the SFO definitions.
3 In the population register, the definition of collective households does not exclude workers who live in collective professional households or those who are registered at the address of their company for practical reasons (i.e. living first in a hotel or a temporary room). For example, the employees of a tourist resort hosted in an adjacent building, or the workers who dug the Gotthard tunnel in Ticino and were located in temporary houses close to their work are kept in the 2014 data. This may as a consequence have increased some local foreigner concentrations in 2014 compared to 2000 and 1990.
For each hectare and year under study, we computed the number of individuals, by nationality, among the nearest 1’000, 10’000 and 100’000 neighbors. The computation of the nearest neighbors was done using the equipop software (Östh 2012). The data preparation and all subsequent analysis have been done with R (R Core Team 2017).
Segregation Measures
To measure segregation processes within Switzerland, this research proposes three indicators whose scale varies in order to reflect national, cantonal, and local dynamics of spatial differentiation. S indexes of Hennerdal and Nielsen (2017) have been computed for the whole Swiss territory as described in the methodological section with a level of significativity 𝛼𝛼 of 0.1 for the 3 years under study and 12 groups of nationalities (see section 4).
National Segregation (100’000 Clusters Compared to the Swiss Population)
The first indicator is built on the comparison of the share of a sub-population among the 100’000 nearest neighbors with its share in the whole Swiss population. It indicates the propensity of a community to cluster within the Swiss territory and expresses regional dynamics of settlement, as 100’000 individuals is comparable to a large Swiss city4.
Cantonal Segregation (10’000 Clusters Compared to the Cantonal Population)
The second indicator is similar to the first one but is located at a lower administrative level, the 26 Swiss cantons. For each canton, it compares the share of a community among the 10’000 nearest neighbors with its share in the whole cantonal population. It indicates the tendency of a sub-population to cluster within the cantonal borders. This indicator allows comparison with other studies because most previous work on segregation in Switzerland has been done at the cantonal level. Switzerland is a highly decentralized country with strong regional policies and cultural backgrounds; the cantonal differentiation is, therefore, an interesting level for understanding how some communities tend to concentrate or disseminate.
Neighborhood Segregation (1’000 Clusters Compared to 10’000 Clusters)
The third indicator stands for smaller scales and aims at revealing neighborhood concentration patterns. It compares the share of a sub-population among the 1’000 nearest neighbors with its share among the 10’000. It indicates a propensity to cluster at a local scale, and thus enters at the intra-urban level (even if we consider the whole Swiss territory).
An Example of Segregation in the Zurich Area
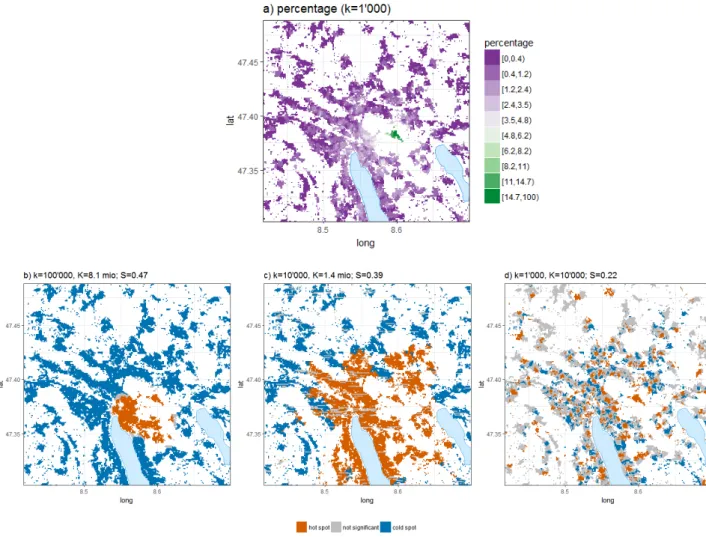
These three indicators are used in the next sections to compare groups of nationalities across years in a multi-scalar approach. To illustrate their spatial impact, we present a small example of the situation of the French nationals in the Zurich agglomeration in 2014 (see figure 4). The first graphic (a) gives a smoothed distribution of the share of French nationals in the area, such that for
each inhabited hectare, it maps the percentage of French among the 1’000 nearest neighbors. We can see that French nationals are very concentrated in an area (Gockhausen) where a French school stands in particular, and are sparser around the east side of the lake of Zurich. In the other areas, there are some variations but the share of French is very low.
This first figure illustrates the population distribution, but to measure spatial inequalities, unequal population distributions should be compared. For each inhabited hectare of Figure 4a, we computed the three S indexes, at the national, cantonal and neighborhood levels. The figures 4b to 4d present the significant under- and over-representation of the French in the Zurich area, the so-called cold and hot spot clusters. A global S index is then built as a population-weighted mean of the under- and over-representations mapped here.
Figure 4: Distribution of French nationals in Zurich area in 2014. a) Percentage among the 1’000 nearest neighbors
b) Hot and cold spots for 10’000 nearest neighbors in comparison with the whole resident population of Switzerland
c) Hot and cold spots for 10’000 nearest neighbors in comparison with the resident population of Zurich canton
Interestingly, the three figures give a quite different appreciation of how spatial differentiation takes place in this area. It should be noticed that over-representation (hot spots) and under-representation (cold spots) vary dramatically from one scale to another. At a national scale, which represents the large dynamics of population settlement, the S index is high (0.47) meaning that on average, the share of French nationals in this area is twice as small or twice as big among the 100’000 nearest individuals as its share in the whole population (1.43% of French). Figure 4b shows a small area of over-representation of French nationals around Gockhausen and close to the city center when compared to their settlement in the whole country. Most French nationals live in the French-speaking part of Switzerland and are therefore dramatically underrepresented in the German part. This is also true for the Zurich urban area, except around the Gockhausen neighborhood.
When comparing clusters of 10’000 nearest neighbors to the distribution of French in Zurich canton (Figure 4c), we can see that the area of over-representation has grown massively around the lake of Zurich due to the change of the area of reference, the canton of Zurich, which hosts 0.52% of French nationals. Thus, compared to its share in the whole canton, French migrants tend to
concentrate in Zurich agglomeration, not only in Gockhausen but all around the city center close to the lake. The size of the area of study (10’000 individuals) expresses the settlement dynamics of an area the size of a small city and overrides the municipality delineations. Overall, the segregation measure for the space in Figure 4c decreases to 0.39; the differences are smaller than at the national scale. The cantonal scale is an interesting measure to compare population distributions between cantons and contexts.
At the level of intra-urban dynamics (Figure 4d), segregation processes appear sparser in space because the area of reference is smaller, and concentrations are relative: over-representation can arise in areas where French are not so numerous and, vice-versa, under-representation can arise in areas where there are high shares of French. Thus, the map 4d is more difficult to decrypt and reveal local features. The global index S of segregation stands for this scale at 0.22: on average, there are 1.28 times more or less French around the 1’000 nearest neighbors compared to the 10’000. However, the spatial differentiations in figure 4d are not always statistically significant, either because the differences are not big enough or because there are too few French residents. Compared to the Duncan dissimilarity index, this approach has three main advantages. First, it allows the analysis of how spatial differentiation develops according to the scale of analysis. Thus, this research distinguishes the dynamics of settlement at the national, cantonal and neighborhood levels. Second, it overrides the delineations of an area and gives a spatial meaning to the
measurement of segregation. Third, it applies to the whole territory, quantifying segregation not only in urban areas. In the rural areas, with low population densities and low shares of foreigners, the relative measures of segregation used here are still effective and relevant.
4
Migrant Populations in Switzerland
Switzerland is a country of migration: with around 8 million inhabitants today, more than 24% of the resident population has a foreign nationality. After World War II, Switzerland set up a model of seasonal guest workers from southern European countries to answer to the need of the Swiss
economy for a low-skilled workforce for the agriculture, building, hotel, and catering sectors. Between 1945 and the beginning of the 1980s, the migrant workers and their families came mainly
from Italy, but since the 1980s Portuguese, Turkish and Yugoslavian immigrants have gradually exceeded the Italians (Piguet 2009). In the 1990s, the flows and the intentions of migrants have diversified, with refugees looking for a safe home and the early stages of global migrations. In the mid-1990s, a new change occurred, the gradual increase in highly qualified migrants who
responded to labor market shortages in highly qualified occupations. This trend was fostered after 2002 and the agreement on the free movement of persons between Switzerland and the European Union (Piguet 2009).
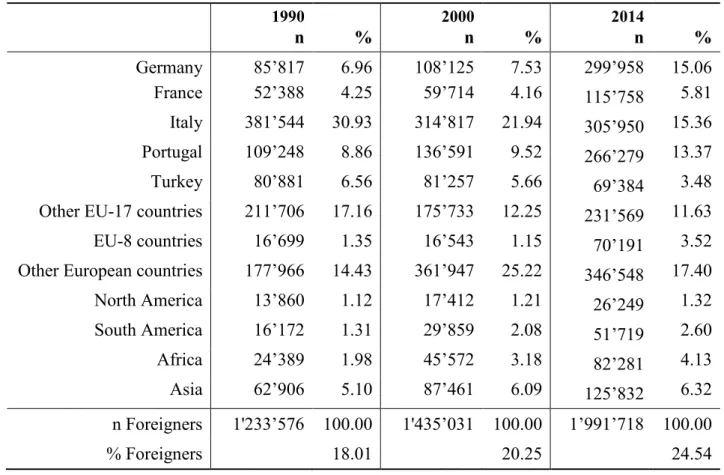
In this paper, we compare twelve migrant communities (German, French, Italian, Portuguese, Turkish, Other EU17/EFTA countries, EU8 countries, other European5, North American, South American, African, Asian-Oceanian). Their characteristics are briefly described in the following lines, and their demographic evolution across the years is presented in Table 1.
Table 1: Distribution of the population under study per year according to the country of origin, Switzerland 1990, 2000, and 2014 1990 2000 2014 n % n % n % Germany 85’817 6.96 108’125 7.53 299’958 15.06 France 52’388 4.25 59’714 4.16 115’758 5.81 Italy 381’544 30.93 314’817 21.94 305’950 15.36 Portugal 109’248 8.86 136’591 9.52 266’279 13.37 Turkey 80’881 6.56 81’257 5.66 69’384 3.48
Other EU-17 countries 211’706 17.16 175’733 12.25 231’569 11.63
EU-8 countries 16’699 1.35 16’543 1.15 70’191 3.52
Other European countries 177’966 14.43 361’947 25.22 346’548 17.40
North America 13’860 1.12 17’412 1.21 26’249 1.32 South America 16’172 1.31 29’859 2.08 51’719 2.60 Africa 24’389 1.98 45’572 3.18 82’281 4.13 Asia 62’906 5.10 87’461 6.09 125’832 6.32 n Foreigners 1'233’576 100.00 1'435’031 100.00 1’991’718 100.00 % Foreigners 18.01 20.25 24.54
Because of its proximity, Germany has a long history of migration with Switzerland. German migration flows have undergone a dramatic increase after 2002 and the agreement on the free movement of persons, so that German nationals have become the second largest foreigner community in 2014, reaching almost 300’000 individuals (15% of the foreign population). This increase is due to the need of the Swiss economy for highly qualified workers and to their facilitated access to the Swiss labor market because of the cultural and geographic proximities (Steiner 2014).
French nationals have a similar history of migration and share cultural and geographic proximities with the French-speaking part of Switzerland: their population almost doubled between 2000 and 2014.
Italy, which is also a Swiss neighboring country and shares a common language with the canton of Ticino, was the main provider after World War II of the low-qualified workers that booming Switzerland was looking for. The migratory balance of Italian workers become negative in the 1970s after the oil shocks, and since then, the number of Italians living in Switzerland has decreased slowly but remained over 300’000 in 2014. Portuguese6, Turks and individuals from former-Yugoslavia (category “other European countries”) have partly replaced Italian low-qualified workers since the 1980s (Piguet 2009). These three groups have taken different migration paths in subsequent years. Portuguese flows have continually increased, and, at the end of 2014, 265’000 Portuguese lived in Switzerland (13.4% of the foreign population). In the 1990s, the war in Yugoslavia accentuated the flows of former workers: in a single year 1999, 35’000 former
Yugoslavians sought asylum in Switzerland (Piguet 2009). But at the beginning of the 21st century, the migratory balance became negative. The Turkish population stabilized in the 1980s around 80’000 individuals and slowly decreased in the 2000s. For these three communities and for the Italians, the decrease in the number of foreigners during the last three decades is partly explained by the naturalization of the second or third generation.
The EU17 group includes all the other EU-15 members after the fourth enlargement plus Cyprus and Malta and the three other members of the EFTA (Iceland, Liechtenstein, and Norway). These populations come from Western Europe and are entitled to facilitated access to Switzerland since the entry into force of the free movement of persons in 2002. Although their number increased from 212’000 to 232’000 between 1990 and 2014, their relative size has decreased from 17.2% to 11.6% because of the general increase in migration flows. EU8 defines the Eastern Europe countries that joined the European Union in 2004 but only got access to the free movement of persons in
Switzerland in 2011. Historically they were not numerous until 2000 (less than 17’000 individuals) but have increased rapidly to reach 70’000 persons in 2014. Their evolution, in terms of spatial differentiation, is therefore interesting to study because of the absence of strong historical communities, social and family networks.
Most migration flows to Switzerland have come from the European continent. In 1990, extra-Europeans represented only 10.5% of all foreigners, but this increased to 14.3% in 2014 as the globalization processes intensified. These non-EU migrants came mostly from Asia (6.3% of all foreigners in 2014) or Africa (4.1%) and somewhat less from North and South America (1.3% and 2.6%).
5 Localization of Foreigners in 2014
Previous research on migrant spatial localization has established that migrants tend to locate in urban municipalities, where both the labor market and social integration are easier (Huissoud et al. 1999). Figure 5 shows for each inhabited hectare the location of the foreigner population as the
6 Spanish migrants also had quite similar migration paths to those of Portuguese. Although large migration flows had already arrived in the 1970s, their numbers reduced by half between 1990 and 2010 (see Piguet 2009). However, in order to have a limited number of groups analyzed in the working paper, Spanish migrants have been included in the other EU17 countries category.
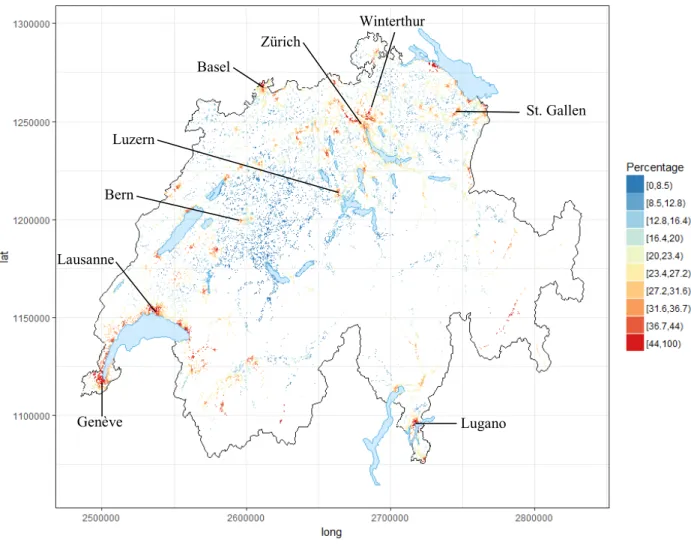
share of foreigners among the 10’000 nearest neighbors. This smoothed visualization of migrant spatial location confirms the urban/rural differences and allows us to look at spatial dynamics without administrative borders. The share of foreigners among the 10’000 nearest neighbors ranges from 2.1% in the Röthenbach im Emmental municipality (South-East of Bern) to 62.4% in Crissier near Lausanne. The map highlights foreigner spatial concentrations in cities but also demonstrates settlement logics that go beyond municipality borders, such as for the Lake Geneva area or the Zurich agglomeration. More generally, it shows heterogeneity in location choices in Switzerland, with some more attractive regions and others less, for example, East of Bern where there is little implantation of foreigners outside cities. The map also shows important foreigner concentrations in the Alpine valleys (Valais and Graubünden in particular) where the foreign workforce is needed in the tourism sector and where rich foreigners like to settle in cities like Verbier, Zermatt or St-Moritz.
Figure 5: Percentage of foreigners among the 10‘000 nearest neighbors, Switzerland 2014
5.1 Regional Segregation Pattern
This sub-section aims to understand regional patterns of foreigner localization in comparing over- and under-representations of the 100’000 nearest neighbors compared to the whole Swiss
population. To do this we first assess where large migrant populations locate regionally, and second, measure the intensity of the concentration patterns. The maps presented here do not show shades of concentration but map regional areas of favored settlement (hot spots) and those that are
Genève Basel Zürich Lausanne Bern Lugano Winterthur St. Gallen Luzern
not attractive (cold spots). The S index of segregation according to Hennerdal and Nielsen (2017) has been computed and is presented in each title graphic.
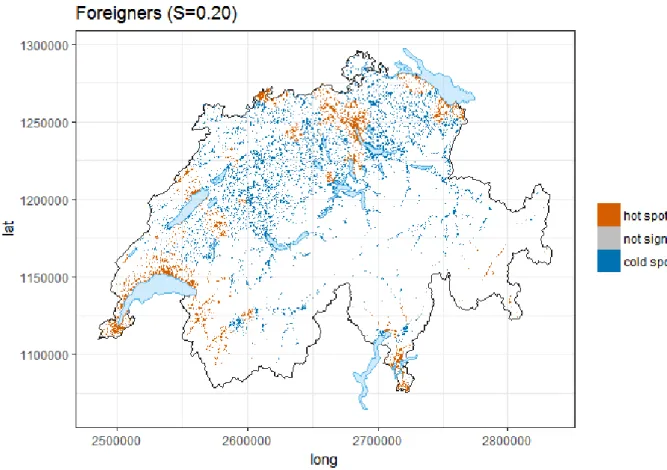
Figure 6: Over- and under-representations of foreigners among 100’000 nearest neighbors in comparison with the whole resident population of Switzerland, 2014
For all foreigners taken together, the level of regional segregation appears to be moderate with a S index of 0.2. This means that on average there is an over- or under-representation of foreigners among the 100’000 nearest neighbors of 25% compared to the whole population. Figure 6 illustrates spatially these areas of under- and over-representation and basically results in the same picture as Figure 5, with foreigner concentrations in the Lake Geneva area, in Zurich and Basel
agglomerations, in the northeast close to the German border and in South-Ticino. Smaller concentrations can also be found around the 15 largest cities of the country and in some Alpine touristic areas.
There are however large differences in location choices between nationalities. Figure 7 shows the cold and hot spots by group of nationalities ordered from the more regionally segregated to the less segregated. Figure 7, which allows us to compare groups with a common measure, shows that the Swiss territory is partitioned as each community fills the space in its own way. There appears to be more segregation for each foreigner subgroup analyzed separately than for all foreigners pooled together.
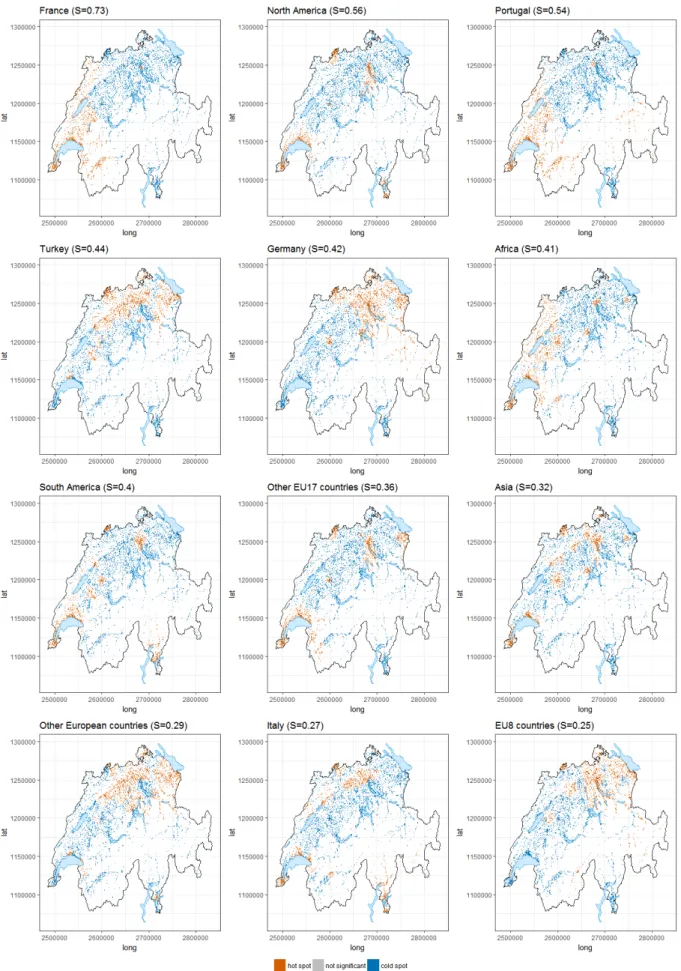
Figure 7: Over- and under-representations of foreigner groups among 100’000 nearest neighbors in comparison with the whole resident population of Switzerland (ordered from the most to the least segregated), 2014
Extreme Regional Segregation
- French nationals are the most segregated community with an index of 0.73. This means that on average the French are 3.7 times over- or under-represented among the 100’000 nearest neighbors compared to their distribution in the country. The spatial representation shows a clear settlement of French nationals in the west only (with the exception of a part of Zurich), which is the French-speaking part of Switzerland. Their hot spots of settlement include both urban and countryside, following a clear cultural, i.e. language, spatial distribution. Because the French-speaking part represents only a quarter of the whole population, the strong concentration in this region and, even more, its absence in the rest of the territory, explains such a high degree of regional segregation.
- North Americans, the second largest segregated group at the regional level (index of 0.56), are concentrated almost solely in the largest urban areas of the country: the Lake Geneva area, Zurich, and Basel. They also have small hot spots in Southern Ticino, Luzern, and Bern.
- With approximately the same level of segregation as North Americans, Portuguese (index of 0.54) have a very different settlement pattern. Portuguese live almost exclusively in the Latin part of Switzerland (French, Italian, and Romansch) and are quasi-absent from the German part due to a cultural affinity and language proximity. Similarly to the French, they also have a strong penetration outside the cities.
Very High Regional Segregation
- Turks (index of 0.44) have predominantly settled in the North/North-Eastern part of Switzerland. This geographical concentration began in the 1980s, when Turkish workers, who did not have access to seasonal guest worker permits, settled largely in the industrial regions of the cantons of Aarau and Solothurn to work in the secondary sector (Huissoud et al. 1999). Since then, their settlement has extended around the agglomerations of Basel and Zurich.
- German nationals (index of 0.42) are over-represented in the German part of Switzerland, but surprisingly only on an East to Northeast axis. With the exception of the city of Bern, they have not really settled in the whole space between Bern and Zurich.
- Individuals with African citizenship (index of 0.41) are more concentrated in the Western part of Switzerland where French is spoken. In the cantons of Jura, Neuchatel, Fribourg, and Vaud, they also penetrate in less dense areas in the countryside. Africans also strongly locate in large cities of the German part (Zurich, Luzern, Basel, St Gall, and Bern).
- South Americans (index of 0.40) are over-represented in the French part of Switzerland but also in the Italian speaking part, probably due to Latin proximity. Compared to Africans, South Americans are more concentrated in cities. They also show over-representation in a few German-speaking urban areas (Zurich, Basel, Bern, and Biel).
- Other European Union 17 country nationals (index 0.36) have settled almost exclusively in and around the largest urban areas of the country: the Lake Geneva area, Zurich, and Basel. Compared to other populations, their settlement in these agglomerations extends to a large periphery around the city center. Foreigners from other European Union countries are also over-represented in an area close to the Austrian border (a concentration almost exclusively of Austrian citizens) and in the city of Bern.
High and Moderate Regional Segregation
- Asian foreigners (index of 0.32) do not present a divide between the language regions and are sparse in the country. They however only concentrate in the urban areas of the country. - Other European country nationals, mostly from former Yugoslavian countries, have almost the same pattern of location as Turks, i.e. a strong presence in the north-eastern part of the country. They, however, present a lower level of segregation (index of 0.29) than Turks do. - Italian nationals (index of 0.27) are naturally concentrated in the Italian part of Switzerland
but also in the largest cities of the country. Their lower level of segregation compared to the other communities can be explained by a strong global settlement in the whole country, and thus, lower differences in over and under-representation.
- Finally, EU8 nationals who have experienced migration to Switzerland only recently are the least segregated group (index of 0.25). They appear to settle particularly in the eastern part of Switzerland and in the German-speaking largest cities.
The analyses in this section have shown an overall moderate level of foreign regional segregation in Switzerland. The generally well-distributed foreign population (Figure 6) actually hides large subpopulation dynamics with high, and even extreme, segregation patterns. At the regional level of population distribution, we can distinguish two kinds of segregation patterns: communities of origin who mostly concentrate in the largest urban areas (North America, Africa, South America, Other EU17, Asia), and those groups who are located in specific parts of the country because of cultural links or historical migration flows (France, Portugal, Turkey, Germany, Other European countries, EU8 countries).
As described earlier, regional foreigner settlement patterns are ruled in particular by labor market demand as most migrants move for a new job opportunity or to accompany a migrant worker (see for example Wanner (2019)). The largest urban areas, where employment opportunities develop in the tertiary sector, are therefore the places where most recently arrived foreigners concentrate. This is particularly true for the highly qualified North American, German, French and other EU17 country nationals who have settled in major cities where they can find a job corresponding to their skills. This also applies to extra-Europeans (Asian, South American, and African), who arrived in Switzerland as highly qualified migrant workers, for family reunion, or as asylum seekers. For those who have a low qualification, the urban proximity offers enough employment opportunities in the
Turks and former Yugoslavians who began to migrate in the 1980s, as low-qualified workers, settled in industrial regions of the cantons of Aarau and Solothurn, or close to the large urban areas where they can find work in the construction, agriculture and service sectors. Their flows perpetuate and develop in the north-eastern part of Switzerland. The demand for a similar workforce in the south-western part of Switzerland has been filled by Portuguese and Spanish migrants who have also arrived since the 1980s. The Italian migration, which began as the exclusive low-qualified workforce at the end of World War II, extended to the whole territory and, thus, appears today as low segregated.
The analysis of regional dynamics of segregation also shows different patterns of rural penetration. It is generally the communities with the closest language proximity (German, French, and Italian), or the ones who have had a large presence in Switzerland since the 1980s, who have settled outside the main cities. Thus, Portuguese, Turkish and other European migrants and their descendants have extended their settlement to the countryside.
This first section on spatial regional pattern of settlement paves the way for further analyses. It has mostly demonstrated the strong regional linkages among migrant communities, which has as a consequence, that the local realities presented in the next sub-sections are embedded in peculiar regional and spatial contexts.
5.2 Cantonal Segregation
In this subsection, we analyze segregation levels between foreigner groups across cantons in 2014. The cantonal level is very important for a decentralized country such as Switzerland. In fact, most previous research in Switzerland has uses the cantonal scale and compares the distribution of foreigner populations between municipalities. The main aim here is to propose a more precise overview of cantonal dynamics in comparing cantonal segregation indexes. These indexes are built on the share of a foreign population in the 10’000 nearest neighbors relative to its share in the whole canton.
The results are presented with Treemaps (Tennekes 2017) by group of nationalities (see Figure 8): for each foreign group, the relative size of the canton is represented by the size of the area – the more populated cantons are bigger and the less populated are smaller. The colors indicate the level of segregation: the gradient moves from blue, the less segregated, to red, the more segregated. For example, 28% of the German population has settled in Zurich; Zurich is, therefore, the largest area of the German Treemap. The light blue indicates a level of segregation between 0.2 and 0.25. By contrast, only 6% of French nationals live in Zurich; Zurich is therefore represented with a much smaller relative size, but the red indicates a high level of segregation (between 0.45 and 0.5). For French, the largest canton is Vaud where 36% of the French live, with a moderate level of segregation (between 0.2 and 0.25).
In the following results, there will be no detailed description of the levels of segregation of each population in each canton because there are too many combinations that often reveal cantonal specificities, but the interested reader can easily find his way in Figure 8. However, overall, the cantonal segregation patterns bring some interesting conclusions.
- The color shade of each Treemap is relatively uniform: there is a kind of homogeneity in the levels of segregation by group of nationality between the 26 cantons. Some groups tend to be moderately segregated in all cantons (German, and EU8 countries for example), while others tend to be highly segregated (North American or Turkish for example).
- Although there are some global trends of segregation by nationality, there are always exceptions of lower or higher concentrations so that a generalization is not possible. Thus, every foreign community has a settlement behavior that depends upon the context. For example, EU8 country nationals, who appear to be disseminated in most cantons, are highly segregated only in the Graubünden, Valais and Uri cantons. Those cantons are situated in the Alps and include tourist resorts where a migrant workforce is recruited. Furthermore, Germans, who are well disseminated in most cantons, are highly concentrated in Thurgau (most Germans there actually live close to the German border) and in the bilingual cantons of Valais, and Fribourg. French tend to be segregated in bilingual cantons too, but also in the Zurich canton as shown in Figure 4. Turks, on the contrary, are segregated in most cantons with the exception of Geneva.
Figure 8: Treemaps of segregation levels in the Swiss cantons by nationality group. The index is computed around the 10’000 nearest neighbors compared to the share of the group in each canton, 2014. The color gradient illustrates the level of segregation, and sizes of the rectangles are
- Interestingly, no relation can be found between the size of the community and the level of segregation. In some situations, a very high level of segregation occurs where the
subpopulation is well represented (South American in Zurich or African in canton Vaud), while in other situations, segregation is at its highest when a subpopulation is less
represented (Italian in Bern or EU8 in Graubünden).
- As shown in previous research, there are large differences between cantons. The small cantons of central Switzerland (Schwyz, Obwald, Nidwald, Glarus) are characterized by a pattern of low foreigner concentrations. The urban canton of Geneva, whose population counts around 40% of foreigners, also shows moderate levels of segregation for almost all communities. On the opposite side, cantons Bern and Valais have very high levels of segregation except for German and EU8 countries populations in Bern. This can be explained by the fact that the canton is mostly rural with few cities where migrants concentrate.
Compared to the k-nearest neighbors approach, the Duncan dissimilarity index (cantonal
segregation between municipalities) underestimates spatial differentiation occurring in Switzerland. This particularly happens when urban agglomerations expand beyond the borders of a municipality. For example, for Turks, the indexes are similar in Appenzell-Ausserrhoden, Graubünden, and Valais, but the Duncan dissimilarity index compared to the 10’000 nearest neighbors is 5 times underestimated in the canton of Basel City, 2.3 times in canton of Geneva, and 1.8 in the canton of Zurich. The approach based on the nearest neighbors is better suited to understanding forms of spatial differentiation in the largest agglomerations, and can generally highlight local specificities and nuances (Sleutjes, de Valk and Ooijevaar 2018).
5.2 Neighborhood Segregation
In this last section analyzing foreigner segregation in 2014, we open the door to local dynamics of spatial differentiation. For each foreigner subpopulation, this subsection proposes a measure of segregation at the neighborhood level (comparison of the 1’000 with the 10’000 nearest neighbors) for the whole Swiss territory.
This measure is more difficult to grasp with any kind of visualization or map because the
underlying dynamics are local (see Figure 4d). Thus, one can live concentrated in a neighborhood (i.e. around one’s 1’000 nearest neighbors) even if the area of reference (i.e. 10’000 nearest
neighbors) includes only a low share of individuals of the same group. The underlying processes of spatial segregation do happen, even if the sub-group is not numerous. The results of the
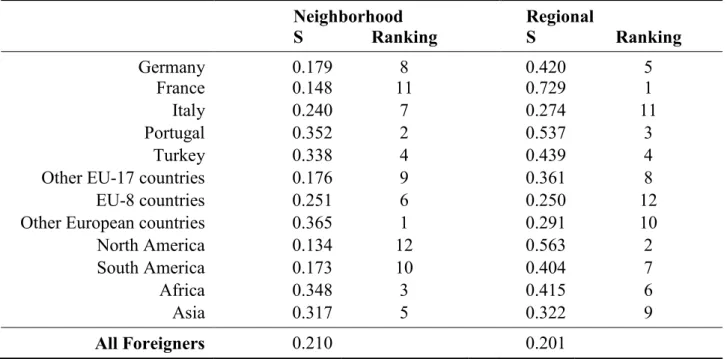
neighborhood level segregation by group are presented in Table 2, which also includes the regional index for comparison purposes.
Table 2: Segregation and rankings by group of nationalities at the neighborhood and regional level, Switzerland 2014 Neighborhood Regional S Ranking S Ranking Germany 0.179 8 0.420 5 France 0.148 11 0.729 1 Italy 0.240 7 0.274 11 Portugal 0.352 2 0.537 3 Turkey 0.338 4 0.439 4
Other EU-17 countries 0.176 9 0.361 8
EU-8 countries 0.251 6 0.250 12
Other European countries 0.365 1 0.291 10
North America 0.134 12 0.563 2
South America 0.173 10 0.404 7
Africa 0.348 3 0.415 6
Asia 0.317 5 0.322 9
All Foreigners 0.210 0.201
- For all foreigners taken together, the index of segregation does not differ much between the neighborhood and regional levels. However, looking at groups of nationalities, there is less spatial segregation at the neighborhood level than at the regional one. Although this result is not generalizable for all subpopulations, it demonstrates the prominence of the regional inking on local rules of subpopulation settlement in Switzerland.
- There is a shift among the most segregated populations at the regional level (French and North American) who become the least segregated at the neighborhood level; they both have S indexes above 0.15. Although French and North Americans have diverging types of
regional settlement, they are well distributed at the local level in the regions where they have settled.
- Similarly to the French, Germans, who hold a large regional space due to cultural and language proximities, also appear as low segregated at the neighborhood level (S=0.18). - Similarly to North Americans, other EU17 citizens and South Americans, who mostly
settled in the largest urban areas of the country, have a low level of local segregation (below 0.18).
- Italian and EU8 citizens have a moderate level of local segregation (around 0.25). Even if they have a similar level of regional segregation, they do not share a common migration and settlement pattern.
- Other European, Portuguese, African, Turkish, and Asian nationalities show a particularly high level of neighborhood segregation (between 0.37 and 0.31). Those populations are associated with low-qualified occupations and probably face difficulties in accessing some places due to the costs. Portuguese, Turks and other Europeans have strong regional links (see Figure 7) and a long history of migration. They thus also concentrate in particular neighborhoods or parts of the cities where they live. By contrast, African and Asian migration flows arrived recently and are found mostly in large or middle size cities where they also tend to concentrate.
These results show a large heterogeneity in settlement patterns between groups with different origins. The underlying causes of population concentrations are therefore complex and are not related to the degree of regional segregation. For example, most EU subpopulations demonstrate a low segregation profile at the neighborhood level although they were highly segregated at the regional one.
Interestingly, the most segregated populations at the neighborhood level come from low-income regions or from migration countries which have a tradition of low-qualified immigrants to
Switzerland. Italians are an exception as they were the main provider of a low-qualified workforce in the second half of the 20th century, and appear at relatively low concentration levels within cities and neighborhoods. The long Italian history of migration – and integration – and its large second generation population may explain why Italians are sparser than Portuguese or Turks for example.
6 Segregation Changes (1990-2000-2014)
In section 5, based on the latest available data, we have shown how spatial segregation differs by group of nationalities and scales. We propose now to look at the temporal evolution in order to understand how those indicators have evolved over time at the regional and the neighborhood levels. The results are shown in table 3, which includes an arrow (or two for stronger effects) indicating the change (in points) of segregation between two decades. Once again, a diversity appears in the segregation processes and no global temporal trends for all subpopulations can be found.
For all foreigners taken together, there is an obvious decrease in segregation between 1990 and 2014 at both the regional and neighborhood scales. Foreigners are better distributed in the Swiss territory at the macro and micro levels in 2014 than in 1990. However, this increase in migrant dissemination hides a diversity among subpopulations: there is no foreigner subpopulation that
experiences a decrease of both regional and local segregation between 1990 and 2014; some groups even experience a strong increase in segregation in the 1990s and in the 2000s.
Table 3: Segregation levels by group of nationalities, at two scales, Switzerland 1990-2014
Regional Neighborhood 1990 2000 2014 1990 2000 2014 Germany 0.353 0.374 0.420 0.196 = 0.190 0.179 France 0.743 = 0.749 0.729 0.116 = 0.114 0.148 Italy 0.269 = 0.275 = 0.274 0.344 0.305 0.240 Portugal 0.592 0.546 = 0.537 0.365 0.375 0.352 Turkey 0.420 0.437 = 0.439 0.426 0.404 0.338
Other EU-17 countries 0.341 = 0.348 0.361 0.268 0.209 0.176
EU-8 countries 0.343 0.274 0.250 0.203 0.158 0.251
Other European countries 0.340 0.272 0.291 0.363 0.397 0.365
North America 0.529 0.539 0.563 0.114 0.124 0.134 South America 0.516 0.415 0.404 0.144 0.170 = 0.173 Africa 0.565 0.522 0.415 0.168 0.268 0.348 Asia 0.270 0.306 0.322 0.397 0.358 0.317 All foreigners 0.232 0.219 0.201 0.267 = 0.266 0.210 0.05 0.02 0.01 = 0.00 -0.01 -0.02 -0.05
At the regional level, there is a trend of dissemination of foreigner subpopulations between 1990 and 2014. There is a higher penetration of foreigner populations in the whole territory, as they increase their presence in areas where they were previously strongly under-represented. As seen earlier for 2014 (Figure 7), foreigners also settle outside the largest agglomerations and thus tend to spread in new areas. The dissemination process is particularly strong among African and EU8 groups (decrease of segregation of 17%) and among South Americans (decrease of 12%). With the new asylum law of 1999, asylum seekers are spread between cantons on arrival, proportionally to the cantonal population size. This partly explains the decrease of segregation of African
nationalities, but changes in the labor market demand and a stronger spatial integration probably explain the decrease of segregation for the other groups.
In the opposite way, Germans, Asians, and citizens from North American countries gradually concentrate their presence regionally between 1990 and 2014. With rising German migration flows at the end of the 20th century, Germans concentrate in the North-Eastern part of Switzerland. Asians