In
Vivo Function of the Lipid Raft Protein Flotillin-1 during
CD8
+
T
Cell–Mediated Host Surveillance
Xenia
Ficht,* Nora Ruef,
†Bettina
Stolp,*
,‡Guerric
P. B. Samson,
xFederica
Moalli,*
,{Nicolas
Page,
‖Doron
Merkler,
‖Ben
J. Nichols,
#Alba
Diz-Mun˜oz,** Daniel F. Legler,
xVerena
Niggli,
††and
Jens V. Stein
†Flotillin-1 (Flot1) is an evolutionary conserved, ubiquitously expressed lipid raft–associated scaffolding protein. Migration of Flot1-deficient neutrophils is impaired because of a decrease in myosin II–mediated contractility. Flot1 also accumulates in the uropod of polarized T cells, suggesting an analogous role in T cell migration. In this study, we analyzed morphology and migration parameters of murine wild-type and Flot12/2 CD8+T cells using in vitro assays and intravital two-photon microscopy of lymphoid and nonlymphoid tissues. Flot12/2 CD8+T cells displayed significant alterations in cell shape and motility parameters in vivo but showed comparable homing to lymphoid organs and intact in vitro migration to chemokines. Furthermore, their clonal expansion and infiltration into nonlymphoid tissues during primary and secondary antiviral immune responses was comparable to wild-type CD8+ T cells. Taken together, Flot1 plays a detectable but unexpectedly minor role for CD8+ T cell behavior under physiological conditions.
N
aive CD8+ T cells (TN) actively migrate in lymphoid tissue interstitium and use their unique TCR to scan dendritic cells (DCs) for cognate peptide presented on MHC class I (pMHC). Upon activation, CD8+T cells undergo clonal expansion and give rise to cytotoxic effector T cells (TEFF). TEFFspread from lymphoid organs to infected tissue where they kill host cells presenting cognate pMHC to eliminate the pool of intracellular pathogens, in particular, viruses. After clearance of infections, long-lived memory T cells persist to provide continu-ous immune surveillance and rapid effector functions in the event of a secondary infection with the same pathogen. Distinct sub-populations of memory CD8+T cells are categorized according to their functions and tissue homing properties: CD62L+ CCR7+ central memory T cells (TCM) recirculate through lymphoid or-gans similar to TN, whereas CD62L2 CCR72 effector memory T cells (TEM) recirculate through nonlymphoid organs and blood. In recent years, a novel subset of tissue-resident memory T cells (TRM) was identified. TRM do not recirculate but permanentlyreside in peripheral organs, including the epidermis and the sub-mandibular salivary gland (SMG). In these organs, TRMmediate rapid recall responses to prevent pathogen spread (1–7).
Studies using intravital two-photon microscopy (2PM) of lymphoid and nonlymphoid organs have uncovered a remarkable motility of TN, TEFF, and memory CD8+ T cells in all tissues analyzed thus far. This behavior is explained by their pMHC re-striction, imposing the need to physically interact with DCs and target cells. Thus, the ability of CD8+T cells to scan their envi-ronment through active migration is a key feature maintained throughout all phases of adaptive immune responses. Active movement of T cells requires polarization and constant cytoskel-etal rearrangement, most importantly the treadmilling of F-actin and its contraction by nonmuscle myosin IIa (Myo IIa) (8–12). Thus, isolated TN cells are round and unpolarized, but rapidly form a polarized amoeboid shape after chemokine stimulation. This shape is characterized by a protrusive leading edge and a contractile cell rear called uropod. Uropod contractility is
*Theodor Kocher Institute, University of Bern, 3012 Bern, Switzerland; †
Department of Oncology, Microbiology and Immunology, University of Fribourg, 1700 Fribourg, Switzerland; ‡Department
for Infectious Diseases, Integrative Virology, Center for Integrative Infectious Disease Research, University Hospital Heidelberg, 69120 Heidelberg, Germany; xBiotechnology Institute Thurgau at the University of Konstanz, 8280 Kreuzlingen, Switzerland; {Scientific Institute for Research and Healthcare, San Raffaele Scientific Institute, 20132 Milan, Italy; ‖Department of Pathology and Immunology, University of Geneva, 1211 Geneva, Switzerland; # Med-ical Research Council Laboratory of Molecular Biology, Cambridge CB2 0QH, United Kingdom; **Cell Biology and Biophysics Unit, European Molecular Biology Laboratory, 69117 Heidelberg, Germany; and ††Institute of Pathology, University of Bern, 3008 Bern, Switzerland
ORCIDs: 0000-0001-5211-3363 (N.R.); 0000-0002-4505-6409 (G.P.B.S.);
0000-0002-8426-2571 (F.M.); 0000-0001-6864-8901 (A.D.-M.);
0000-0001-8610-4764(D.F.L.);
This work was supported by Swiss National Foundation Project Grants 31003A_135649, 31003A_153457, and 31003A_172994 (to J.V.S.), and 31003A_169936 (to D.F.L.), the European Molecular Biology Laboratory (to A.D.-M.), Leopoldina Fellowship LPDS 2011-16 (to B.S.), and SFB1129 funded by the Deutsche Forschungsgemeinschaft (to B.S.).
X.F. performed imaging, atomic force microscopy, transwell, and flow cytometry experiments. N.R. performed atomic force microscopy and rechallenge experiments.
B.S. performed chemotaxis and flow cytometry experiments. G.P.B.S. performed immunofluorescence and analyzed Flot22/2cells under supervision of D.F.L. F.M. assisted with skin imaging. V.N. performed Western blots and measured p-ERM capping. N.P. and D.M. provided vital material. A.D.-M. provided critical assistance for membrane tension measurements. B.J.N. generated the Flot12/2mouse line. X.F. and J.V.S. designed experiments and wrote the manuscript with input from all coauthors.
Address correspondence and reprint requests to Prof. Jens V. Stein, Department of Oncology, Microbiology and Immunology, University of Fribourg, Chemin du Muse´e 5, 1700 Fribourg, Switzerland. E-mail address: jens.stein@unifr.ch
The online version of this article contains supplemental material.
Abbreviations used in this article: CM-R, complete medium–RPMI 1640; DC, dendritic cell; Flot1, Flotillin-1, Flot2, Flotillin-2; HSVTOM-OVA, Tomato- and OVA-encoding HSV-1; IS, immunological synapse; LCMV-OVA, OVA-encoding lymphocytic choriomeningitis virus; LN, lymph node; MPEC, memory precursor cell; Myo IIa, nonmuscle myosin IIa; NA, numerical aperture; o.n., overnight; p.i., postinfection; pLN, popliteal LN; 2PM, two-photon microscopy; pMHC, peptide presented on MHC class I; RNAseq, RNA sequencing; RT, room temperature; SLEC, short-lived effector cell; SLO, secondary lymphoid organ; SMG, submandibular salivary gland; TCM, central memory T cell; TEFF, effector T cell; TN, naive CD8
+ T cell; TRM, tissue-resident memory T cell; WT, wild-type.
CopyrightÓ 2019 by The American Association of Immunologists, Inc. 0022-1767/19/$37.50
http://doc.rero.ch
Published in "The Journal of Immunology doi: 10.4049/jimmunol.1900075, 2019"
which should be cited to refer to this work.
important for detachment from adhesive substrates and for creat-ing force to squeeze the biggest organelle of a cell, the nucleus, through narrow pores encountered during migration (8, 13, 14). In addition to the Myo IIa activity for actomyosin contraction, the uropod is rich in phosphorylated membrane-to-cytoskeleton-linker proteins of the ezrin/radixin/moesin family (p-ERM), adhesion receptors such as CD44 and PSGL-1, and cholesterol-rich mem-brane microdomains, the lipid rafts (15). The tip of the uropod of polarized leukocytes also contains flotillin-1 (Flot1; also known as Reggie2) and flotillin-2 (Flot2; Reggie1), evolutionary conserved, ubiquitously expressed, membrane-associated scaffolding proteins (16–21). Both flotillins possess N-terminal fatty acid modifica-tions next to or within their prohibitin homology domain (PHB) that target them to lipid rafts (18–21). In leukocytes, C-terminal interactions lead to the hetero-oligomerization of Flot1 and Flot2, which is required for mutual stabilization and targeting to lipid rafts (19, 22). Flotillins have been implicated in a variety of cel-lular functions, including cell-cell adhesion (19), endocytosis (19), regulation of G-protein–coupled receptor signaling (23), and modulation of the actomyosin cytoskeleton of leukocytes (24). Flot12/2mice show deficient recruitment of immune cells to in-flammatory sites due to a decreased migratory capacity of neu-trophils and monocytes (24). Flot-12/2 neutrophils display reduced levels of phosphorylated myosin regulatory chain, which in turn leads to a defect in Myo IIa activity and cell migration (24). Similarly, Flot1 and Flot2 interdependently cap at uropods of primary human T cells, and expression of a dominant-negative Flot2 mutant or reduced expression of Flot1 impair uropod for-mation (18, 22, 25). In vitro experiments suggest that organization of membrane microdomains by flotillins is required for optimal T cell migration (26). Furthermore, flotillin-containing lipid rafts assemble at immunological synapses (IS) and have been proposed to serve as scaffold for the TCR signaling machinery (27–29). Yet, there is no evidence to date on how Flot1 affects CD8+T cell– mediated organ surveillance in vivo, nor how it impacts T cell activation during adaptive immune responses against microbes.
In this study, we analyzed in vitro properties and in vivo behavior of Flot12/2CD8+T cells using functional readouts under physi-ological conditions in mouse models. Our data suggest that Flot1 is involved in regulating the shape and speed of migrating CD8+ T cells in lymphoid and nonlymphoid tissues but has only a minor impact on their ability to expand, differentiate, and surveille dis-tinct microenvironments. Taken together, our data shed light on the physiological impact of this conserved protein during adaptive immunity mediated by CD8+T cells.
Materials and Methods
Mice
OT-I TCR transgenic mice (30) were crossed to Tg(UBC-GFP)30Scha Ubi-GFP (31) (GFP+ OT-I), hCD2-dsRed (32) (DsRed+ OT-I), or tdTomato-expressing Ai14 x ZP3 (33, 34) (tdTom+ OT-I) mice on the C57BL/6J background. GFP+OT-I mice were crossed with Flot12/2mice
(24). All mice were bred at the animal facility of the University of Bern and Fribourg, Switzerland and were used as lymphocyte donor mice at 6–20 wk of age. Six- to ten-week-old sex-matched C57BL/6J mice (Janvier Labs, Le Genest-Saint-Isle, France) were used as re-cipient mice. All experiments were performed in accordance to federal animal experimentation regulations and approved by the cantonal committees.
Reagents
Sodium Pyruvate (100 mM; no. 11360-039), HEPES buffer (1 M; no. 15630-056), RPMI 1640 (no. 21875-034), L-Glutamine (200 mM, no. 25030-024), MEM nonessential amino acids (MEM NEAA, no. 11140-035), and Pen Strep (no. 15140-122) were purchased from Life Technol-ogies. FBS (FCS, no. SV30143.03) was obtained from HyClone.
Cell polarization and p-ERM capping
Flot1 staining was performed as described (18). Cell polarization and p-ERM capping experiments were performed as described (35). In brief, naive T cells were isolated from spleen and purified by negative selection. Cells were then incubated for 15 min without or with 200 ng of CCL19 at 37˚C in suspension followed by fixation with 10% TCA, staining for p-ERM (Cell Signaling technologies), and evaluation of cell morphology and p-ERM caps. Only cells with p-ERM staining were evaluated (100 cells counted per sample). For activated T cells, T cells were isolated from spleen and incubated for 2 d with 1mg/ml ConA, then 4 d with IL-2 (100 U/ml). Cells were then incubated for 15 min without or with 200 ng of CCL19 at 37˚C in suspension followed by fixation with 10% TCA, staining for p-ERM, and evaluation of cell morphology and p-ERM caps. Only cells with p-ERM staining were evaluated (100 cells counted per sample).
For Flot2 staining, CD8+T cells were isolated from spleen and lymph node (LN) of Flot12/2and wild-type (WT) mice using the EasySep Mouse CD8+T Cell Isolation Kit (STEMCELL Technologies). Cells were incu-bated for 4 d with 20 ng/ml IL-7 before use in immunofluorescent staining. Cover glasses were coated with 10mg/ml fibronectin and 1 mM CCL21. Cells were added and incubated for 1 h at 37˚C and fixed with 10% TCA for 5 min at 37˚C. Cells were washed twice with PBS, permeabilized with 0.1 mg/ml lysolecithin 10 min at room temperature (RT), and washed again twice with PBS. Cover glasses were blocked with PBS/5% BSA for 1 h and stained overnight (o.n.) with anti-Flot2 Ab (1:100 in PBS/0.5% BSA; BD Transduction Laboratories). After washing once with PBS/ 0.05% Tween-20 and twice with PBS, cells were stained with the sec-ondary Ab goat anti-mouse AF594 (1:100 in PBS/5% BSA; Thermo Fisher Scientific) for 1 h at RT and washed once with PBS/0.05% Tween-20 and twice with PBS. Cover glasses were mounted on a glass slide, let dry o.n., and images were acquired on a Leica TCS SP5 using a 633 glycerol immersion objective (numerical aperture [NA] 1.3).
Western blots
Expression of Flot1 and Flot2 was measured in T lymphoblasts isolated from spleens of WT and Flot12/2mice. To this end, 1.53 106T lym-phoblasts per sample were precipitated with TCA and separated on 10% SDS-PAGE followed by immunoblotting with the specified Abs (anti-mouse flotillin 1 no. 610820 and anti-(anti-mouse flotillin 2 no. 610383; BD Transduction Laboratories). In some experiments, splenocytes from WT or Flot22/2were lysed with NP-40 lysis buffer (10 mM Tris-HCl [pH 7.6], 150 mM NaCl, 1% NP-40) supplemented with protease inhibitor mixture (11836170001; Roche). Proteins were resolved by 10% SDS-PAGE, transferred to nitrocellulose blocking membranes (10600002; GE Health-care), and blocked with 13 Roti-block (A151.4; Roth). Membranes were further incubated with the desired primary Ab solution followed by an HRP-conjugated Ab solution and visualized with clarity Western ECL substrate (170-5061; Bio-Rad). Membranes were stripped using Restore Western Blot Stripping Buffer (21063; Thermo Fisher Scientific) for actin staining (loading control).
Transwell migration assays
WT and Flot12/2OT-I CD8+T cells (53 105 per well) in 100ml of
complete medium–RPMI 1640 (CM-R; RPMI 1640/10% FCS/1% HEPES/ 2 mM L-Glutamine/1 mM Na-Pyruvate/PenStrep) were added to the in-serts of 3- or 5-mm pore size Transwell Chambers (Costar) and allowed to migrate toward the indicated concentrations of rCCL21 (Peprotech) for 2 h at 37˚C. Percent of transmigrated cells was measured by comparing cell counts of input to Transwells after 1 min of acquisition at the same speed with a FACSCalibur or FACS LSR II flow cytometer (BD).
Membrane tension measurements
CD8+T cells were isolated with STEMCELL negative selection kit as described above and kept on ice in CM-R with 5mg/ml IL-7 (407-ML-005; R&D) until o.n. activation with 2.5mg/ml ConA. Imaging dishes were washed sonicated for 5 min in water, washed in 99% ethanol, dried, and sterilized with UV light for 15 min. Dishes were coated for 30–60 min at 37˚C with 0.01% Poly-L-Lysine (Sigma-Aldrich) and washed 8–10 times with PBS. Approximately 53 105T cells were plated onto the coated dish in 0.5 ml of CM-R and incubated for 10–15 min at 37˚C. Subsequently, dishes were washed carefully 8–10 times with warm medium. For tether measurements, 3 ml of CM-R (5% FCS) were added to the dish. Olympus BioLevers (k = 60 pN/nm) were calibrated using the thermal noise method and incubated in 4 mg/ml Con A (C5275; Sigma) for 1 h at RT. Before the measurements, cantilevers were rinsed in Dulbecco PBS. Cells were lo-cated by brightfield imaging, and the cantilever was positioned at any
location over the cell for tether measurement. Cells were not used longer than 1 h for data acquisition. Tethers were pulled using a CellHesion 200 from JPK mounted on an inverted Nikon Ti microscope. Approach velocity was set to 1mm/s, contact force to 100–300 pN, contact time to 5–10 s, and retraction speed to 10mm/s. After a 10-mm tether was pulled, the cantilever position was held constant until it broke. Only tethers that broke in ,15 s were considered, as actin polymerized inside of longer-lived tethers. Negative and positive forces relate to the angle the cantilever takes, but the sign is arbitrary. By convention, contacting the cell deflects the cantilever toward positive values. Conversely, when the cantilever is pulled downward by a membrane tether, the values are negative. Resulting force–time curves were analyzed with the JPKSPM Data Processing Software.
T cell transfer and infections
Negative isolation of CD8+ T cells from peripheral LN and spleen of CD45.1+, dsRed+, tdTom+, GFP+OT-I, or Flot12/2GFP+OT -I mice was
performed using EasySep Mouse CD8+T Cell Isolation Kit (STEMCELL Technologies). We confirmed CD8+T cell purity to be.90% by flow
cytometry and transferred 104or 0.5–13 106OT-I cells in CM-R i.v. 1 d before OVA-encoding lymphocytic choriomeningitis virus (LCMV-OVA) or HSV-1TOM-OVAinfection, respectively. For some experiments, cotransfer
of equal amounts of Flot1+/+GFP+OT-I or Flot12/2GFP+OT-I and Flot1+/+ dsRed+, CD45.1+, or tdTom+OT-I was performed. Mice were either i.p.
infected with 13 105PFU LCMV-OVA (36) or anesthetized, shaved, and tattooed with 53 105PFU in 10ml of HSV-1
TOM-OVAusing a Cheyenne
tattooing machine as described (6). Experimental readouts for the acute, cleared, and memory phase of LCMV infection were performed 6, 15, and .28 d postinfection (p.i.), respectively. Experimental readouts for memory phase of HSV infection were performed later than 28 d p.i. For rechallenge experiments, LCMV-OVA–infected mice in the memory phase (.30 d p.i.) were bled to assess the ratio of WT and Flot12/2OT-I T cells as correc-tion factor before receiving 5 3 103 cfu OVA-expressing Listeria
monocytogenes i.v. (37).
Flow cytometry
At indicated time points, spleens and PLN were harvested and organs were passed through cell strainers (70mm; Bioswisstec) to obtain single-cell suspensions. RBC lysis was performed on splenocytes. SMG was minced and treated with 2 U/ml collagenase II (Worthington Biochem) in CM-R for 45 min at 37˚C, passed through a 70-mm cell strainer, and washed with PBS/10 mM EDTA. Tattooed skin was minced and digested in 0.25% Trypsin/EDTA (Life Technologies) for 30 min at 37˚C and passed through a cell strainer and washed with PBS/5 mM EDTA. We used the following reagents for flow cytometry: anti-CD4-PE (GK1.5); anti-CD8a-PerCP (53-6.7), anti-CD8a-allophycocyanin (53-(53-6.7), anti-CD8a-allophycocyanin/ Fire750 (53-6.7; BioLegend), anti-CD16/32 (Fc-block, 2.4G2; STEM-CELL), anti-CD44-PE (IM7; BD Biosciences), anti-CD45.1-PE (A20; BioLegend), anti-CD45-PE (30-F11; BD Biosciences), anti-CD45-PerCP (30-F11), anti-CD62L-allophycocyanin (MEL-14), anti-CD103-Biotin (M290), anti-CD103-allophycocyanin (2E7; BioLegend), anti-CD127-Biotin (B12-1; BD Pharmingen), anti-CD127-allophycocyanin (A7R34), anti-KLRG1-PECy7 (2F1/KLRG1), anti-KLRG1-PE (2F1/KLRG1), Streptavidin-BV421, and Streptavidin-PE (all from BioLegend). Cell suspensions were stained on ice for 20 min with indicated Abs and washed in FACS buffer (PBS/2% FCS/1 mM EDTA). For acute phase stainings, cells were fixed for 20 min in 1% PFA after staining. Cells were washed again prior to acquisition and at least 105cells in the forward light scatter/ side scatter lymphocyte gate were acquired using a FACSCalibur or LSR II (BD Bioscience). Total cell counts were measured by acquiring single-cell suspensions in PKH26 reference microbeads (Sigma) or Beckman coulter counting beads (REF7547053) for 1 min at high speed or by counting with FastRead Counting Slides (Immune Systems). Gating for CD103, CD127, and KLRG1 was set according to isotype or FMO controls. Data were analyzed with FlowJo.
T cell homing
DsRed+and GFP+Flot12/2CD8+T cells mice were injected i.v. into sex-matched recipients (2–33 106 cells per mouse). After 2 h, mice were killed and perfused with PBS. Peripheral LN, mesenteric LN, Peyer Patches, and spleen were harvested and passed through passed through a 70-mm cell strainer. Afterwards, erythrocytes in spleen were lysed in RBC buffer for 5 min. Blood was harvested by taking it up directly from the vena cava during perfusion into a 20-ml syringed filled with 10 ml of PBS/10 mM EDTA. Samples were stained on ice with PerCP-conjugated anti-mouse CD8a, washed, and acquired on a FACSCalibur flow cytometer
(BD). Ratio of Flot12/2 to WT cells in each organ was normalized to input.
2PM intravital imaging
2PM intravital imaging of the popliteal LN and skin was performed as previously described (38). In short, ketamine/xylazine/acepromazine was used to anesthetize mice and the right popliteal LN was surgically pre-pared. For skin imaging, hair on the right flank was removed and a section of skin was elevated onto a metal holder by making two parallel incisions. Prior to imaging, Alexa 633–conjugated MECA-79 (10 mg/mouse) was injected i.v. to mark high endothelial venules in LN. 2PM imaging was carried out with a TrimScope I 2PM microscope using a 253 Nikon (NA 1.0) or 203 Olympus (NA 0.95) objective (LaVisionBiotec). ImSpector software was used to control the 2PM system and acquire images. Some image series were obtained with the help of an automated system pro-viding real-time drift correction (39). Excitation was provided by a Ti:sapphire laser (Mai Tai HP; Spectraphysics) tuned to 780 or 840 nm. For analysis of cell migration, 11–20 x-y slices with a z-step size of 2–4mm (22–64 mm depth) were acquired. Frame rate was 3 per min for LN or 1 per min for skin. Second harmonic signals and emitted light were detected with 447/55-nm, 525/50-nm, 593/40-nm, and 655/40–nm band-pass filters using nondescanned detectors. Image series were rendered into four-dimensional videos with Imaris (Bitplane) or Volocity (PerkinElmer) software. Tissue movement was corrected by either the correct drift function of Imaris or with a MATLAB script identifying the 3D movement in a reference channel. Motility parameters such as angle changes were derived from x, y, and z coordinates of cell centroids using Imaris, Volocity, and MATLAB protocols. The cutoff for the arrest coefficient in LN was 5mm/min and in epidermis 1 mm/min. Motility coefficients, which are a measure of a randomly moving cell’s ability to move away from its starting position, were calculated from the slope of a graph of the average mean displacement against the square root of time. Shape factor was calculated by analyzing two-dimensional projections of cell tracks of horizontally moving cells in Volocity as described (40). For some depicted image series, raw cell signals were masked with Imaris to hide auto-fluorescence. Brightness and contrast were adjusted in all images. Statistical analysis
Unpaired Student test, Mann–Whitney U test, or two-way ANOVA with a Sidak multiple comparison test were used to determine statistical signi-ficance as indicated (Prism 7; GraphPad). Signisigni-ficance was set at p, 0.05.
Results
In vitro characterization of naive Flot12/2T cells
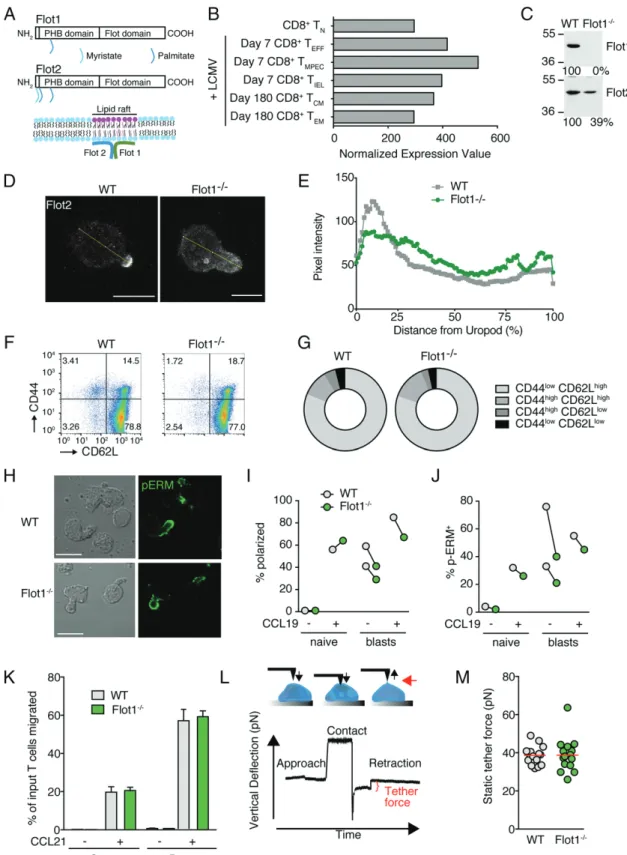
Flot1 is a ubiquitously expressed, evolutionary conserved lipid raft–associated protein that accumulates at uropods of neutrophils and primary T cells (Fig. 1A) (18). RNA sequencing (RNAseq) data from the Immgen database (www.immgen.org) revealed Flot1 expression in murine CD8+
T cells throughout an immune re-sponse (Fig. 1B). We decided to analyze the role of Flot1 for CD8+ T cell migration and activation. Western blot analysis confirmed the loss of Flot1 expression in Flot12/2T cells and a concomitant decrease of Flot2 as described for Flot12/2 neutro-phils (Fig. 1C) (24). In fibroblasts lacking Flot1, the remaining pool of Flot2 is not associated with lipid rafts, in line with a role for heterodimers or hetero-oligomers for proper membrane microdomain localization (24). We investigated the distribution of Flot2 in CCL21-polarized WT and Flot12/2T cells by immuno-fluorescence. We confirmed Flot2 capping at the tip of uropods in WT T cells, whereas residual Flot2 showed a more uniform dis-tribution in Flot12/2T cells (Fig. 1D, 1E).
Polyclonal Flot12/2CD8+T cells isolated from lymphoid or-gans displayed a bona fide naive CD62LhighCD44lowphenotype and showed comparable levels of surface CCR7, indicating that TN were predominant in secondary lymphoid organs (SLOs) (Fig. 1F, 1G, and data not shown). We compared the in vitro ability of naive and activated WT and Flot12/2T cells to polar-ize after chemokine stimulation. Flot1 accumulated in the uropod of polarized murine T cells (Supplemental Fig. 1), comparable to findings in human T cells. Activated Flot12/2T cell blasts but not
FIGURE 1. In vitro characterization of Flot12/2T cells. (A) Scheme of Flot1 and Flot2 protein domains and association with lipid raft microdomains. (B) RNAseq data of Flot1 expression in CD8+T cells (from Immgen database). (C) Expression of Flot1 and Flot2 in T lymphoblasts isolated from spleens
of WT and Flot12/2mice. (D) Immunofluorescent images of WT and Flot12/2T cells stimulated with CCL21 and stained for Flot2. Yellow line depicts fluorescence intensity assessment. Scale bar, 5mm. (E) Flot2 pixel intensity per cell normalized to distance from uropod. n = 26 and 21 for WT and Flot12/2T cells, respectively. (F) Flow cytometry plot of CD62L and CD44 expression on splenic CD8+T cells. (G) Quantification of surface expression of CD44 and
CD62L on CD8+T cells from WT and Flot12/2mice. Pooled from two independent experiments, n = 4. (H) Phase contrast and immunofluorescent images
of polarized activated WT and Flot12/2T cell blasts stimulated with CCL19 and stained for p-ERM. Scale bar, 10mm. (I and J) Quantification of po-larization (I) and p-ERM capping (J) of naive and activated T cells with and without CCL19 stimulation. (K) Chemotaxis of naive WT and Flot12/2T cells toward 100 nM CCL21 through 3- and 5-mm filters. Shown is mean 6 SD of one of two experiments performed in triplicates. (L) Schematic of pulling static tethers with an atomic force microscope. Black arrows indicate direction of movement of cantilever and the red arrow points to the tether. (M) Average static tether force per cell. Data show one representative experiment of two. PHB, prohibitin homology domain.
naive Flot12/2T cells showed a minor tendency to polarize less and to accumulate less p-ERM at the uropod as compared with WT blasts (Fig. 1H–J). We next analyzed the chemotactic ability of WT and Flot12/2TNtoward CCL21 across 3- and 5-mm pore size filters. In line with their largely intact polarization, both cell types migrated similarly toward CCL21 (Fig. 1K).
We addressed whether residual Flot2 may compensate for Flot1 during in vitro migration. Flot22/2splenocytes lacked ex-pression of Flot2 as predicted and displayed essentially no de-tectable Flot1, in line with the mutually stabilizing role of both proteins (Supplemental Fig. 2A). Nonetheless, WT and Flot22/2 splenocytes showed comparable chemotaxis to CCL21 across 3- and 5-mm pore size filters (Supplemental Fig. 2B).
Because lipid raft–associated flotillin hetero-oligomers have been implicated in cortical actin binding, we hypothesized that Flot1 could influence membrane tension or membrane-to-cortex attachment. We therefore measured the membrane tension by pulling membrane tethers from the surface of activated WT and Flot12/2T cell blasts using a cantilever on an atomic force mi-croscope (Fig. 1L). Lack of Flot1 did not alter the static tether force as compared with WT T cells (Fig. 1M). In sum, lack of Flot1 has no major impact on membrane tension, nor on the ability of T cells to polarize and migrate in response to homeostatic chemokines.
In vivo characterization of naive Flot12/2T cell migration in lymphoid tissue
We next assessed whether Flot1 deficiency affects T cell trafficking under physiological conditions, which are difficult to reproduce in reductionist in vitro assays. To this end, we cotransferred WT and Flot12/2CD8+TNon an OT-I background into recipient mice for homing and intravital microscopy. OT-I T cells recognize the amino acid sequence SIINFEKL derived from OVA in the context of H2-Kb (30). We recovered comparable numbers of WT and Flot12/2CD8+T cells from SLOs at 2 and 24 h after transfer (Fig. 2A and data not shown), suggesting similar homing capacity of both cell types. To analyze interstitial migration in SLOs, we cotransferred WT dsRed+and Flot12/2GFP+CD8+TNinto re-cipient mice and performed intravital 2PM imaging of the popli-teal LN (PLN). Consistent with the T cell homing results, we observed both cell types inside the PLN interstitium (Fig. 2B). Time lapse imaging uncovered robust amoeboid motility of WT and Flot12/2CD8+T cells (Fig. 2B, 2C, Supplemental Video 1). To quantify cell polarization, we determined the shape factor of migrating cells as described (40). A shape factor of 1 corresponds to a perfect circle, whereas values close to zero correlate to elongated or irregular shape outlines. Our analysis showed that Flot12/2 CD8+ TN displayed significantly rounder shapes as compared with WT CD8+T cells (Fig. 2D). This correlated with a minor but significant drop in median cell speeds (from 13.56 4.0mm/min for WT CD8+TNto 13.06 4.1 mm/min for Flot12/2 CD8+TN; mean6 SD) (Fig. 2E). Yet, the arrest coefficient, de-fined as percent of track length with speeds slower than a dede-fined threshold value, and the meandering index were comparable be-tween both populations (Fig. 2F, 2G). Furthermore, both WT and Flot12/2CD8+TN preferentially change direction with shallow turning angles (∼30˚), whereas steep turns (∼90˚) or U-turns (∼180˚) were rare (data not shown). Both persistence and speed contribute to the motility coefficient, which measures the dis-placement of randomly migrating cells over time and is calculated from plotting mean displacement versus time. WT and Flot12/2 CD8+ TN display comparable motility coefficients of 54.0 and 50.9mm2/min, respectively (Fig. 2H). In sum, interstitial Flot12/2 T cells are more rounded than their WT counterparts and show a
minor speed drop, which did not significantly hinder them to scan the lymphoid microenvironment in vivo.
Activation, expansion, and memory formation of Flot12/2CD8+T cells
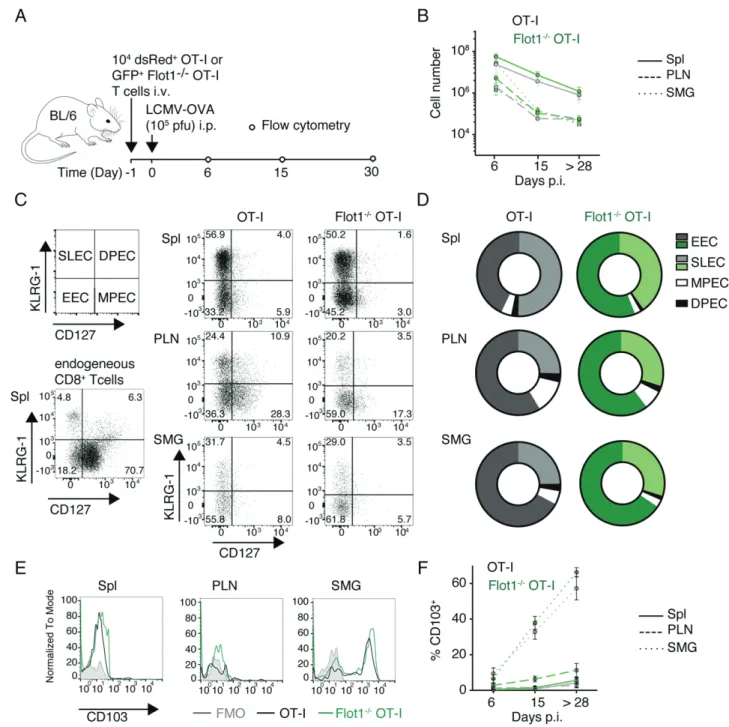
Flotillin-rich lipid rafts have been implicated in TCR signaling at the IS, contributing to T cell activation in vitro (27–29). In contrast, activation and memory formation of Flot12/2CD8+T cells has not been systematically analyzed in vivo to date. To explore this further, we adoptively transferred either GFP+ WT or GFP+ Flot12/2OT-I T cells into recipient mice. At 24 h posttransfer, we induced a systemic infection by i.p. injection of LCMV-OVA (Fig. 3A) (38). We observed a comparable clonal expansion of WT OT-I and Flot12/2OT-I T cells during the acute phase (day 6 p.i.), followed by a contraction after the effector phase (day 15 p.i.) and the formation of a long-lived memory pool (.day 28 p.i.) in lymphoid tissue and SMG (Fig. 3B). In the effector phase, activated CD8+
T cells differentiate from KLRG-12 CD1272 early effector cells into KLRG-1+ CD1272 short-lived effector cells (SLEC) or KLRG-12 CD127+ memory precursor cells (MPEC), with few KLRG-1+ CD127+ double-positive effector cells (41). The decision of becoming SLEC versus MPEC is influenced by the strength of antigenic stimulation and the cyto-kine milieu and serves as readout for alterations in CD8+T cell responsiveness. When we examined WT and Flot12/2OT-I T cells on day 6 p.i., we observed most cells to be KLRG-12 CD1272 early effector cells or KLRG-1+CD1272SLECs without notable changes in population ratios between WT or Flot12/2 OT-I T cells, indicating comparable activation (Fig. 3C, 3D).
Finally, we analyzed whether TRMformation in SMG is affected by absence of Flot1. Both WT OT-I and Flot12/2OT-I T cells exhibited a comparable gradual increase of the TRM marker CD103 in SMG but not PLN or spleen, suggesting largely pre-served capacity to form bona fide TRMin nonlymphoid organs in the absence of Flot1 (Fig. 3E, 3F). Taken together, our data sug-gest normal clonal expansion, differentiation, tissue infiltration, and memory formation of Flot12/2CD8+T cells during an anti-viral immune response.
In vivo migration of Flot12/2CD8+memory T cells in lymphoid tissue
We set out to examine the tissue surveillance properties of memory CD8+T cells in lymphoid tissue after viral infections. To this end, we cotransferred dsRed+WT OT-I and GFP+Flot12/2OT-I CD8+ T cells into recipient mice, which were infected with LCMV-OVA 1 d later. After.day 30 p.i., we performed intravital imaging of PLN (Fig. 4A). Both WT OT-I and Flot12/2 OT-I T cells dis-played active amoeboid migration in the PLN interstitium, similar to TN (Fig. 4B, 4C, Supplemental Video 2). Compared with memory OT-I T cells, Flot12/2T cells were on average rounder than their WT counterparts (Fig. 4D). This correlated to a minor but statistically significant reduction in migration speeds of memory Flot12/2OT-I T cells as compared with WT OT-I T cells (from 11.26 3.9 mm/min for WT memory CD8+T cells to 10.26 3.7 mm/min for Flot12/2 memory CD8+ T cells; mean6 SD) (Fig. 4E). In addition, the arrest coefficient was increased in Flot12/2memory OT-I T cells, whereas the meandering index of Flot12/2memory T cells was slightly reduced as compared with WT OT-I T cells (Fig. 4F, 4G). As a consequence, Flot12/2 memory T cells displayed a reduced motility coefficient compared with WT memory T cells (54.3 versus 34.8mm2/min for WT and Flot12/2CD8+T cells, respectively; Fig. 4H). Thus, Flot1 plays a detectable role in the morphology and migration of lymphoid tissue memory CD8+ T cells, which mostly consist of TCM.
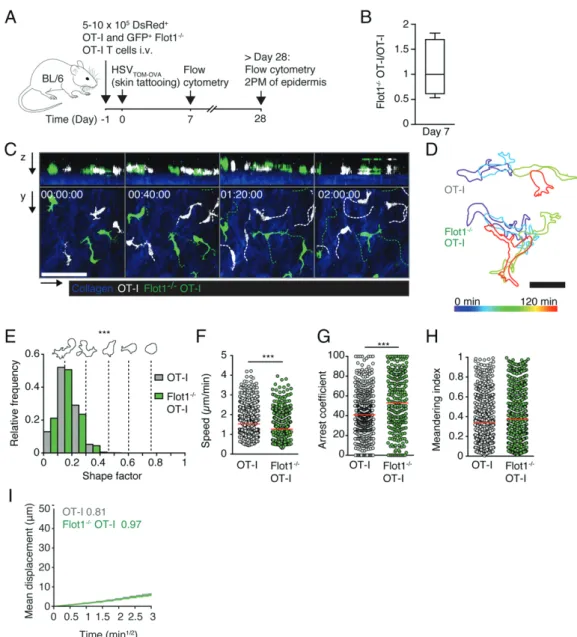
Nonetheless, the ability of CD8+T cells lacking Flot1 to scan the lymphoid microenvironment remains comparably robust. Patrolling behavior of Flot12/2CD8+TRMin epidermis Because uropod function is critical in dense environments for nuclear propulsion and Flot1 is required for neutrophil accumu-lation in nonlymphoid tissue (11, 24, 42, 43), we reasoned that the function of Flot1-mediated control of cell shape may become more apparent in dense nonlymphoid tissue. To address this point experi-mentally, we cotransferred GFP+Flot12/2OT-I and dsRed+WT OT-I T cells into WT recipients and performed skin tattooing of a tandem dimer Tomato- and OVA-encoding HSV-1 (HSVTOM-OVA) 1 d later as described (Fig. 5A) (6). In this setting, viral infections lead to the recruitment of CD8+ TEFF, which differentiate after viral clearance into epidermal TRM(38). Similar to our findings in the LCMV-OVA infection model, lack of Flot1 did not impair effector cell recruitment to skin by day 7 p.i., suggesting a preserved ca-pacity of Flot12/2 CD8+ T cells to switch from lymphoid to nonlymphoid tissue infiltration (Fig. 5B). We furthermore ob-served a largely preob-served maintenance of OT-I and Flot12/2OT-I populations in spleen, skin-draining axillary and inguinal LN, and skin by flow cytometry at.day 28 p.i. (Supplemental Fig. 3A).
In line with this observation, the ratio of % OT-I T cell populations (among CD45+ CD8+ cells) in skin versus inguinal LN of indi-vidual mice remained comparable for both OT-I and Flot12/2OT-I T cells, suggesting a similar distribution of TRMand TCM in both populations (Supplemental Fig. 3B).
At 5 wk p.i., we surgically prepared the tattooed skin for in-travital imaging of WT and Flot12/2 TRM. Epidermal TRMare located within the basal epidermis above a loose layer of dermal collagen, which can be visualized in 2PM by second harmonic generation. Within the dense epithelial microenvironment, epi-dermal TRM migrate at 1–2mm/min while displaying a highly dendritic morphology with many finger-like protrusions (44, 45). We observed that both WT and Flot12/2TRMexhibit this typical morphology and epidermal localization (Fig. 5C, 5D, Supplemental Video 3). Shape factors of both WT and Flot12/2epidermal TRM were much lower than of lymphoid tissue T cells, reflecting their highly elongated morphology. In contrast to Flot12/2T cells in lymphoid organs, epidermal Flot12/2 TRM displayed a signifi-cantly more elongated morphology as compared with WT cells (Fig. 5E). WT epidermal TRM migrated with a mean speed of 1.7 6 0.7 mm/min, whereas Flot12/2 epidermal TRM migrated with a reduced speed of 1.4 6 0.6 mm/min (mean 6 SD) FIGURE 2. In vivo trafficking of naive Flot12/2CD8+T cells in lymphoid organs. (A) Two hours in vivo homing of OT-I or Flot12/2OT-I T cells to indicated organs: blood (Bl), spleen (Spl), peripheral LN, mesenteric LN (MLN), and Peyer patches (PP). Each dot represents organs from one mouse, bars depict mean. Pooled from two independent experiments with a total of six mice per group. (B) 2PM image sequence of naive WT and Flot12/2OT-I T cells migrating in popliteal LN. Dashed white and green lines indicate tracks of migrating WT and Flot12/2OT-I T cells, respectively. Scale bar, 20mm; Time in min/s. (C) Representative time-coded outlines of migrating WT and Flot12/2OT-I T cells. Scale bar, 10mm. (D) Shape factor of naive WT and Flot12/2 OT-I T cells migrating in popliteal LN. Pooled from two independent experiments with three mice per group. (E–G) Speed (E), arrest coefficient (F), and meandering index (G) of naive WT or Flot12/2OT-I T cells migrating in popliteal LN. Red lines depict median, each dot represents the average value for an
individual track. (H) Mean displacement versus time for datasets in (E–G). Numbers indicate motility coefficient in square micrometers per minute. Data in (E–H) are pooled from three independent experiments with a total of eight mice. Data in (A) were tested for significance with two-way ANOVA and Sidak multiple comparison test. Data in (E) were analyzed using unpaired Student t test, data in (D), (F), and (G) using Mann–Whitney U test. *p , 0.05, ***p, 0.001.
(Fig. 5F). Furthermore, Flot12/2TRM had a higher arrest co-efficient but a similarly low meandering index as WT TRM (Fig. 5G, 5H). Despite these minor changes in cell motility parameters, the motility coefficient of epidermal Flot12/2 epidermal TRMwas unchanged compared with WT TRM(Fig. 5I). In conclusion, Flot12/2epidermal TRMretain the capacity of scanning even a very dense microenvironment consisting of epithelial layers.
Secondary expansion of WT and Flot12/2memory CD8+ T cells after microbial challenge
Finally, we set out to examine whether Flot1 deficiency interferes with a secondary expansion of memory CD8+ T cells. We
generated mice containing WT and Flot12/2 memory OT-I T cells at.30 d post LCMV-OVA infection, which were then rechallenged with OVA-expressing L. monocytogenes (Fig. 6A). At day 4 p.i., we isolated spleens and examined secondary ex-pansion by flow cytometry (Fig. 6B). We found that both populations expanded equally well following OVA-expressing L. monocytogenes challenge (Fig. 6C). Similarly, OT-I and Flot12/2OT-I T cells expressed similar levels of KLRG-1, a marker which is upregulated upon secondary challenge (data not shown) (46). Taken together, our data suggest that CD8+ memory T cells retain a comparable capacity for secondary expansion in the absence of Flot1 expression in our experi-mental system.
FIGURE 3. Expansion and memory formation of Flot12/2CD8+T cells. (A) Experimental layout of LCMV-OVA infection. (B) Total number of GFP+
cell number in spleen (Spl), pooled peripheral LN, and SMG at day 6, 15, and.28 p.i. Pooled from two independent experiments with a total of five to six mice per group. (C and D) Representative flow cytometry plots (C) and pooled results (D) of CD127 and KLRG-1 costaining of endogenous CD8+and
transferred OT-I T cells on 6 d p.i. Pooled from two independent experiments and a total of four to eight mice. (E and F) Representative flow cytometry plots (E) and pooled results (F) of CD103 expression on OT-I and Flot12/2OT-I T cells in memory phase (.28 d p.i.). (F) shows mean with SEM from two to four independent experiments with a total of 5–12 mice per group and time point.
Discussion
CD8+T cells are remarkably efficient in scanning a wide variety of target tissues in search of pMHC-presenting DCs and target cells. To this end, these cells acquire a polarized shape with protrusive and contracting membrane dynamics. Flot1 is a highly conserved protein that scaffolds lipid rafts and controls the cortical cytoskeleton of neutrophil uropods, where it accumulates (24). Yet, its in vivo function for adaptive immune cell trafficking and activation has not been explored to date. Our data uncover a role for Flot1 in regulating CD8+ T cell speeds in lymphoid and nonlymphoid tissues. Furthermore, Flot1 contributes to shape maintenance but does not affect expansion during a primary and secondary immune response under the experimental conditions used in this study.
Flotillins are involved in TCR recycling and signaling at the IS (27, 29). Yet, in our system using a transgenic TCR (OT-I) and cognate peptide expressed by replication-competent viruses, we did not observe a defect in expansion, MPEC versus SLEC dif-ferentiation, and memory formation of Flot12/2 CD8+ T cells. Similarly, dissemination of effector and memory Flot12/2CD8+ T cells to lymphoid and nonlymphoid tissue was comparable to WT CD8+T cells. We assessed TEFFnumbers and phenotypes at day 6 p.i., which may have been too late to detect alterations during early T cell activation. It is also possible that the strong affinity of OT-I to its cognate pMHC is sufficient to override Flot1-mediated defects or that T cells compensate for lower sig-naling strength by a longer interaction time with DCs. Further-more, residual Flot2 levels may have partially rescued the lack of
Flot1 expression. Yet, Flot1 expression has been reported to be required for lipid raft localization of Flot2 (24). Similarly, we observed altered Flot2 expression in polarized Flot12/2 lympho-cytes. Although these data support the notion that lack of Flot1 abolishes the formation of functional hetero-oligomers, Flot2 re-tains F-actin binding activity, which may be sufficient to fulfill Flot1-independent functions. In addition, other proteins contrib-uting to uropod formation such as ERM proteins may also com-pensate for the lack of flotillin hetero-oligomers (35).
We used 2PM imaging of PLN and skin to assess morphology and migratory patterns of Flot12/2 CD8+ T cells in vivo. We consistently found changes in cell shape: lymphoid tissue Flot12/2 T cells were less elongated than their WT counterparts, whereas the opposite was observed for epidermal TRM. This may reflect the distinct modes of motility imposed by the microenvironment of these tissues. Lymphoid tissue T cells display amoeboid cell motility, which is characterized by a polarized cell shape with an F-actin–rich leading edge and a well-developed uropod containing myosin II. Our in vivo observations of naive and memory T cell shapes in lymphoid tissue confirm previous in vitro studies showing impaired uropod formation in primary T cells upon ex-pression of a dominant-negative Flot2 mutant or supex-pression of Flot1 expression (18, 22, 35). In contrast, epidermal TRMdisplay a highly branched morphology and use a finger-like migration mode. It was hypothesized that actin-polymerization is driving the extension of the finger, whereas myosin-mediated contractility is required for contraction of the protrusion and for cell translocation (47). Therefore, a minor reduction in myosin contractility through FIGURE 4. In vivo trafficking of memory Flot12/2CD8+T cells in lymphoid organs. (A) Experimental layout. (B) 2PM image sequence of memory
OT-I and Flot12/2OT-I T cells migrating in popliteal LN. Dashed white and green lines indicate tracks of migrating memory OT-I and Flot12/2OT-I T cells, respectively. Scale bar, 20mm; time in min/s. (C) Representative time-coded outlines of migrating memory OT-I and Flot12/2OT-I T cells in peripheral LN. Scale bar, 10mm. (D) Shape factor of memory OT-I and Flot12/2OT-I T cells migrating in popliteal LN. Pooled from two independent experiments with three mice per group. (E–G) Speed (E), arrest coefficient (F), and meandering index (G) of memory OT-I or Flot12/2OT-I T cells migrating in LN. Red lines depict median, each dot represents the average value for an individual track. (H) Mean displacement versus time for datasets in (E–G). Numbers indicate motility coefficient in square micrometers per minute. Flot12/2OT-I data in (D–H) are pooled from three independent experiments (n = 8) and OT-I data are pooled from two independent experiments (n = 5). Data in (E) were analyzed using unpaired Student t test, data in (D), (F), and (G) using Mann–Whitney U test. *p, 0.05, **p , 0.01, ***p , 0.001.
lack of Flot1-mediated microdomain assembly may explain the hyperelongated protrusions of epidermal TRM. Nonetheless, we could not find consistent evidence that hyperelongation resulted in
cell disintegration in Flot12/2TRM(data not shown). Taken to-gether, Flot1-containing microdomains shape T cell morphology in vivo but are not absolutely required for cell displacement and FIGURE 5. Epidermal Flot12/2CD8+T
RMmigration. (A) Experimental layout for the generation of epidermal TRMwith HSVTOM-OVAinfection. (B) Ratio of
OT-I and Flot12/2OT-I T cells recovered at day 7 from HSVTOM-OVA–infected skin. (C) 2PM image sequence of memory OT-I and Flot12/2OT-I T cells showing
both xy and xz views of epidermis over 2 h of continuous imaging. OT-I cells and cell tracks in white, and Flot12/2OT-I cells and tracks in green. Dermal collagen visualized by second harmonic generation shown in blue. Scale bar, 50mm; Time in h/min/s. (D) Representative time-coded outlines of migrating memory OT-I and Flot12/2OT-I T cells in the epidermis. Scale bar, 20mm. (E) Shape factor of epidermal OT-I and Flot12/2OT-I T cells. Pooled from one experiment with n = 2 (OT-I) or n = 3 (Flot12/2OT-I) mice. (F–H) Speed (F), arrest coefficient (G) and meandering index (H) of epidermal OT-I or Flot12/2OT-I T cells. Red lines depict median, each dot represents the average value for an individual track. (I) Mean displacement versus time for datasets in (E)–(G). Numbers indicate motility coefficient in square micrometers per minute. Data in (B) are pooled from two independent experiments (n = 5), and data in (E)–(I) were pooled from three independent experiments (n = 10). Data in (F) were analyzed using unpaired Student t test, data in (E), (G), and (H) using Mann–Whitney U test. ***p , 0.001.
FIGURE 6. Secondary expansion of WT and Flot12/2memory CD8+T cells after rechallenge. (A) Experimental layout. (B) Flow cytometry plot of OT-I and Flot12/2OT-I T cells at day 4 post L. monocytogenes–OVA challenge. (C) Ratio of OT-I and Flot12/2OT-I T cells in spleen after normalization to prechallenge ratio. Data in (C) are pooled from two independent experiments with a total of nine mice.
maintenance of cellular integrity in the experimental conditions examined in this study.
RNAseq expression levels of Flot1 and lipid raft content are comparable between naive and memory CD8+ T cells (48). However, multiple interacting partners of flotillins, such as the adhesion molecule CD44, are differentially expressed in naive versus memory CD8+T cells. Changes in the interactome of Flot1 may therefore underlie the larger impact of Flot1 deficiency on LN memory CD8+T cell motility as compared with TN. Similarly, Flot12/2 epidermal TRM migrated with a slower velocity com-pared with WT TRM. Despite these minor changes in cell shape and motility parameters, our data suggest that Flot1 plays a less prominent role in CD8+T cells as compared with neutrophils and monocytes (24). This may be due to the fact that although readily detectable by gene expression and Western blot, Flot1 expression levels are several times lower in T cells as compared with neu-trophils (www.immgen.org).
In sum, the present data demonstrate that Flot12/2CD8+T cells are capable of expansion and formation of effector and memory T cells following viral infection. Furthermore, our imaging ex-periments show that morphology and homeostatic immune sur-veillance by CD8+T cells in lymphoid and nonlymphoid tissue is affected but not critically impaired by the absence of Flot1. Thus, although flotillins are evolutionary conserved and ubiquitously expressed, we demonstrate in this paper that their function is regulated in a context- and cell type–specific manner, potentially reflecting expression levels and interaction partners.
Acknowledgments
This work benefitted from optical setups of the Microscopy Imaging Center of the University of Bern and the Bioimaging platform of the University of Fribourg.
Disclosures
The authors have no financial conflicts of interest.
References
1. Iijima, N., and A. Iwasaki. 2014. T cell memory. A local macrophage chemokine network sustains protective tissue-resident memory CD4 T cells. Science 346: 93–98.
2. Schenkel, J. M., K. A. Fraser, L. K. Beura, K. E. Pauken, V. Vezys, and D. Masopust. 2014. T cell memory. Resident memory CD8 T cells trigger protective innate and adaptive immune responses. Science 346: 98–101. 3. Stary, G., A. Olive, A. F. Radovic-Moreno, D. Gondek, D. Alvarez, P. A. Basto,
M. Perro, V. D. Vrbanac, A. M. Tager, J. Shi, et al. 2015. VACCINES. A mucosal vaccine against Chlamydia trachomatis generates two waves of protective memory T cells. Science 348: aaa8205.
4. Ariotti, S., M. A. Hogenbirk, F. E. Dijkgraaf, L. L. Visser, M. E. Hoekstra, J.-Y. Song, H. Jacobs, J. B. Haanen, and T. N. Schumacher. 2014. T cell memory. Skin-resident memory CD8+ T cells trigger a state of tissue-wide pathogen alert. Science 346: 101–105.
5. Kadoki, M., A. Patil, C. C. Thaiss, D. J. Brooks, S. Pandey, D. Deep, D. Alvarez, U. H. von Andrian, A. J. Wagers, K. Nakai, et al. 2017. Organism-level analysis of vaccination reveals networks of protection across tissues. Cell 171: 398–413.e21. 6. Ariotti, S., J. B. Beltman, R. Borsje, M. E. Hoekstra, W. P. Halford,
J. B. A. G. Haanen, R. J. de Boer, and T. N. M. Schumacher. 2015. Subtle CXCR3-dependent chemotaxis of CTLs within infected tissue allows efficient target localization. J. Immunol. 195: 5285–5295.
7. Zaid, A., J. L. Hor, S. N. Christo, J. R. Groom, W. R. Heath, L. K. Mackay, and S. N. Mueller. 2017. Chemokine receptor-dependent control of skin tissue-resident memory T cell formation. J. Immunol. 199: 2451–2459.
8. La¨mmermann, T., and M. Sixt. 2009. Mechanical modes of ‘amoeboid’ cell migration. Curr. Opin. Cell Biol. 21: 636–644.
9. Krummel, M. F., and I. Macara. 2006. Maintenance and modulation of T cell polarity. Nat. Immunol. 7: 1143–1149.
10. Moreau, H. D., M. Piel, R. Voituriez, and A.-M. Lennon-Dume´nil. 2018. Inte-grating physical and molecular insights on immune cell migration. Trends Immunol. 39: 632–643.
11. Friedl, P., and B. Weigelin. 2008. Interstitial leukocyte migration and immune function. Nat. Immunol. 9: 960–969.
12. Vicente-Manzanares, M., X. Ma, R. S. Adelstein, and A. R. Horwitz. 2009. Non-muscle myosin II takes centre stage in cell adhesion and migration. Nat. Rev. Mol. Cell Biol. 10: 778–790.
13. Morin, N. A., P. W. Oakes, Y.-M. Hyun, D. Lee, Y. E. Chin, M. R. King, T. A. Springer, M. Shimaoka, J. X. Tang, J. S. Reichner, and M. Kim. 2008. Nonmuscle myosin heavy chain IIA mediates integrin LFA-1 de-adhesion during T lymphocyte migration. [Published erratum appears in 2008 J. Exp. Med. 205: 993.] J. Exp. Med. 205: 195–205.
14. Jacobelli, J., R. S. Friedman, M. A. Conti, A.-M. Lennon-Dume´nil, M. Piel, C. M. Sorensen, R. S. Adelstein, and M. F. Krummel. 2010. Confinement-optimized three-dimensional T cell amoeboid motility is modulated via myo-sin IIA-regulated adhesions. Nat. Immunol. 11: 953–961.
15. Niggli, V. 2014. Insights into the mechanism for dictating polarity in migrating T-cells. Int. Rev. Cell Mol. Biol. 312: 201–270.
16. Babuke, T., and R. Tikkanen. 2007. Dissecting the molecular function of reggie/ flotillin proteins. Eur. J. Cell Biol. 86: 525–532.
17. Morrow, I. C., and R. G. Parton. 2005. Flotillins and the PHB domain protein family: rafts, worms and anaesthetics. Traffic 6: 725–740.
18. Affentranger, S., S. Martinelli, J. Hahn, J. Rossy, and V. Niggli. 2011. Dynamic reorganization of flotillins in chemokine-stimulated human T-lymphocytes. BMC Cell Biol. 12: 28.
19. Bodin, S., D. Planchon, E. Rios Morris, F. Comunale, and C. Gauthier-Rouvie`re. 2014. Flotillins in intercellular adhesion - from cellular physiology to human diseases. J. Cell Sci. 127: 5139–5147.
20. Otto, G. P., and B. J. Nichols. 2011. The roles of flotillin microdomains--endocytosis and beyond. J. Cell Sci. 124: 3933–3940.
21. Langhorst, M. F., G. P. Solis, S. Hannbeck, H. Plattner, and C. A. O. Stuermer. 2007. Linking membrane microdomains to the cytoskeleton: regulation of the lateral mobility of reggie-1/flotillin-2 by interaction with actin. FEBS Lett. 581: 4697–4703.
22. Baumann, T., S. Affentranger, and V. Niggli. 2012. Evidence for chemokine-mediated coalescence of preformed flotillin hetero-oligomers in human T-cells. J. Biol. Chem. 287: 39664–39672.
23. Sugawara, Y., H. Nishii, T. Takahashi, J. Yamauchi, N. Mizuno, K. Tago, and H. Itoh. 2007. The lipid raft proteins flotillins/reggies interact with Galphaq and are involved in Gq-mediated p38 mitogen-activated protein kinase activation through tyrosine kinase. 19: 1301–1308.
24. Ludwig, A., G. P. Otto, K. Riento, E. Hams, P. G. Fallon, and B. J. Nichols. 2010. Flotillin microdomains interact with the cortical cytoskeleton to control uropod formation and neutrophil recruitment. J. Cell Biol. 191: 771–781.
25. Baumann, T., S. Affentranger, and V. Niggli. 2013. Analysis of close associa-tions of uropod-associated proteins in human T-cells using the proximity ligation assay. PeerJ 1: e186.
26. Giri, B., V. D. Dixit, M. C. Ghosh, G. D. Collins, I. U. Khan, K. Madara, A. T. Weeraratna, and D. D. Taub. 2007. CXCL12-induced partitioning of flotillin-1 with lipid rafts plays a role in CXCR4 function. Eur. J. Immunol. 37: 2104–2116.
27. Slaughter, N., I. Laux, X. Tu, J. Whitelegge, X. Zhu, R. Effros, P. Bickel, and A. Nel. 2003. The flotillins are integral membrane proteins in lipid rafts that contain TCR-associated signaling components: implications for T-cell activation. Clin. Immunol. 108: 138–151.
28. Langhorst, M. F., A. Reuter, G. Luxenhofer, E.-M. Boneberg, D. F. Legler, H. Plattner, and C. A. O. Stuermer. 2006. Preformed reggie/flotillin caps: stable priming platforms for macrodomain assembly in T cells. FASEB J. 20: 711–713.
29. Compeer, E. B., F. Kraus, M. Ecker, G. Redpath, M. Amiezer, N. Rother, P. R. Nicovich, N. Kapoor-Kaushik, Q. Deng, G. P. B. Samson, et al. 2018. A mobile endocytic network connects clathrin-independent receptor endocytosis to recycling and promotes T cell activation. Nat. Commun. 9: 1597.
30. Hogquist, K. A., S. C. Jameson, W. R. Heath, J. L. Howard, M. J. Bevan, and F. R. Carbone. 1994. T cell receptor antagonist peptides induce positive selec-tion. Cell 76: 17–27.
31. Schaefer, B. C., M. L. Schaefer, J. W. Kappler, P. Marrack, and R. M. Kedl. 2001. Observation of antigen-dependent CD8+ T-cell/dendritic cell interactions in vivo. Cell. Immunol. 214: 110–122.
32. Kirby, A. C., M. C. Coles, and P. M. Kaye. 2009. Alveolar macrophages transport pathogens to lung draining lymph nodes. J. Immunol. 183: 1983–1989. 33. Madisen, L., T. A. Zwingman, S. M. Sunkin, S. W. Oh, H. A. Zariwala, H. Gu, L. L. Ng, R. D. Palmiter, M. J. Hawrylycz, A. R. Jones, et al. 2010. A robust and high-throughput Cre reporting and characterization system for the whole mouse brain. Nat. Neurosci. 13: 133–140.
34. de Vries, W. N., L. T. Binns, K. S. Fancher, J. Dean, R. Moore, R. Kemler, and B. B. Knowles. 2000. Expression of Cre recombinase in mouse oocytes: a means to study maternal effect genes. Genesis 26: 110–112.
35. Martinelli, S., E. J. H. Chen, F. Clarke, R. Lyck, S. Affentranger, J. K. Burkhardt, and V. Niggli. 2013. Ezrin/Radixin/Moesin proteins and flotillins cooperate to promote uropod formation in T cells. Front. Immunol. 4: 84.
36. Kallert, S. M., S. Darbre, W. V. Bonilla, M. Kreutzfeldt, N. Page, P. Mu¨ller, M. Kreuzaler, M. Lu, S. Favre, F. Kreppel, et al. 2017. Replicating viral vector platform exploits alarmin signals for potent CD8+T cell-mediated tumour im-munotherapy. Nat. Commun. 8: 15327.
37. Zehn, D., S. Y. Lee, and M. J. Bevan. 2009. Complete but curtailed T-cell re-sponse to very low-affinity antigen. Nature 458: 211–214.
38. Moalli, F., X. Ficht, P. Germann, M. Vladymyrov, B. Stolp, I. de Vries, R. Lyck, J. Balmer, A. Fiocchi, M. Kreutzfeldt, et al. 2018. The Rho regulator Myosin IXb enables nonlymphoid tissue seeding of protective CD8+T cells. J. Exp. Med. 215: 1869–1890.
39. Vladymyrov, M., J. Abe, F. Moalli, J. V. Stein, and A. Ariga. 2016. Real-time tissue offset correction system for intravital multiphoton microscopy. J. Immu-nol. Methods 438: 35–41.
40. Hons, M., A. Kopf, R. Hauschild, A. Leithner, F. Gaertner, J. Abe, J. Renkawitz, J. V. Stein, and M. Sixt. 2018. Chemokines and integrins independently tune actin flow and substrate friction during intranodal migration of T cells. Nat. Immunol. 19: 606–616.
41. Joshi, N. S., W. Cui, A. Chandele, H. K. Lee, D. R. Urso, J. Hagman, L. Gapin, and S. M. Kaech. 2007. Inflammation directs memory precursor and short-lived effector CD8(+) T cell fates via the graded expression of T-bet transcription factor. Immunity 27: 281–295.
42. Nourshargh, S., P. L. Hordijk, and M. Sixt. 2010. Breaching multiple barriers: leukocyte motility through venular walls and the interstitium. Nat. Rev. Mol. Cell Biol. 11: 366–378.
43. Paluch, E. K., I. M. Aspalter, and M. Sixt. 2016. Focal adhesion-independent cell migration. Annu. Rev. Cell Dev. Biol. 32: 469–490.
44. Ariotti, S., J. B. Beltman, G. Chodaczek, M. E. Hoekstra, A. E. van Beek, R. Gomez-Eerland, L. Ritsma, J. van Rheenen, A. F. M. Mare´e, T. Zal, et al.
2012. Tissue-resident memory CD8+ T cells continuously patrol skin epithelia to quickly recognize local antigen. Proc. Natl. Acad. Sci. USA 109: 19739–19744. 45. Zaid, A., L. K. Mackay, A. Rahimpour, A. Braun, M. Veldhoen, F. R. Carbone, J. H. Manton, W. R. Heath, and S. N. Mueller. 2014. Persistence of skin-resident memory T cells within an epidermal niche. Proc. Natl. Acad. Sci. USA 111: 5307–5312. 46. Herndler-Brandstetter, D., H. Ishigame, R. Shinnakasu, V. Plajer, C. Stecher, J. Zhao, M. Lietzenmayer, L. Kroehling, A. Takumi, K. Kometani, et al. 2018. KLRG1+effector CD8+T cells lose KLRG1, differentiate into all memory T cell lineages, and convey enhanced protective immunity. Immunity 48: 716–729.e8. 47. Zhu, J., and A. Mogilner. 2016. Comparison of cell migration mechanical strategies in three-dimensional matrices: a computational study. Interface Focus 6: 20160040.
48. de Mello Coelho, V., D. Nguyen, B. Giri, A. Bunbury, E. Schaffer, and D. D. Taub. 2004. Quantitative differences in lipid raft components between murine CD4+ and CD8+ T cells. BMC Immunol. 5: 2.