HAL Id: hal-00296887
https://hal.archives-ouvertes.fr/hal-00296887
Submitted on 4 Jul 2005
HAL is a multi-disciplinary open access
archive for the deposit and dissemination of
sci-entific research documents, whether they are
pub-lished or not. The documents may come from
teaching and research institutions in France or
abroad, or from public or private research centers.
L’archive ouverte pluridisciplinaire HAL, est
destinée au dépôt et à la diffusion de documents
scientifiques de niveau recherche, publiés ou non,
émanant des établissements d’enseignement et de
recherche français ou étrangers, des laboratoires
publics ou privés.
3DVAR assimilation of SSM/I data over the sea for the
IOP2b MAP case
C. Faccani, D. Cimini, R. Ferretti, F. S. Marzano, A. C. Taramasso
To cite this version:
C. Faccani, D. Cimini, R. Ferretti, F. S. Marzano, A. C. Taramasso. 3DVAR assimilation of SSM/I
data over the sea for the IOP2b MAP case. Advances in Geosciences, European Geosciences Union,
2005, 2, pp.229-235. �hal-00296887�
3DVAR assimilation of SSM/I data over the sea
for the IOP2b MAP case
C. Faccani1, D. Cimini2, R. Ferretti1,2, F. S. Marzano3,2, and A. C. Taramasso4,5
1Department of Physics, University of L’Aquila, Italy 2CETEMPS, University of L’Aquila, Italy
3Department of Electrical Engineering, University of L’Aquila, Italy 4CIMA, Inter-university Center for Environmental Monitoring, Savona, Italy 5DIST, University of Genova, Italy
Received: 24 October 2004 – Revised: 19 April 2005 – Accepted: 20 April 2005 – Published: 4 July 2005
Abstract. Data assimilation by 3DVAR of data from the
Spe-cial Sensor Microwave/Imager (SSM/I) has been performed to study the IOP2b case (19–21 September 1999) of the Mesoscale Alpine Programme (MAP). Only data over the sea surface are used to avoid the contamination of the surface emissivity. Moreover, the rainy data are filtered out because the assimilation algorithm of 3DVAR does not take into ac-count the scattering processes. SSM/I data are assimilated in two different ways: as Brightness Temperature directly, or as Precipitable Water and surface wind speed retrieved from the Brightness Temperature. The effect of the thinning of the observations has been studied and a set of sensitivity test cases has been carried out; the one by one removal of the SSM/I frequencies from the initial dataset allows to evaluate their impact on the Initial Conditions. A few experiments are performed using these new Initial Conditions to initialize the MM5 (PSU/NCAR) model. The results show that the assim-ilation of the retrieved quantities, i.e. Precipitable Water and surface wind speed, does not produces large improvement in the Initial Conditions. Vice versa, the assimilation of the Brightness temperatures produces a large variability of the Initial Conditions. The forecast experiments show that the model is very sensitive to the 22 GHz and 37 GHz frequen-cies.
1 Introduction
Assimilation of satellite data over the sea is an easy way to get a lot of information on the earth surface where tions are scarce. Moreover, whereas the standard observa-tions have a random distribution and a low spatial density over the land surface, the satellite data completely scan wide areas beneath their orbit track. It provides a large amount of data that can be used to improve the initialization of the
math-Correspondence to: C. Faccani
ematical models for the weather forecast. The Special Sensor Microwave/Imager (SSM/I) (Hollinger et al., 1990) radiome-ter can provide, by retrieval from the Brightness Temper-ature recorded, information on the atmospheric moist vari-ables, such as Precipitable Water (PW), Cloud Liquid Water (CLW) and Rain Rate (RR). These variables quickly change in space and time and they strongly influence the weather forecast. Therefore, in the last few years, many efforts have attemped to use these data for an accurate model initializa-tion. The assimilation of the SSM/I data is mostly performed using retrieved quantities (Tsuyuki, 1997; Hou et al., 2004; Gerard and Saunders, 1999) and not the Brightness Temper-ature directly. This is because the Radiative Transfer Equa-tion (RTE) requires a good modelling of the atmosphere, but if rain is present, the scattering processes are too complex to be correctly reproduced. In this study, a simplified algorithm without scattering processes is used, therefore rainy data will be filtered out. A comparison between the assimilation of the retrieved quantities and the Brightness Temperature is per-formed.
2 SSM/I data
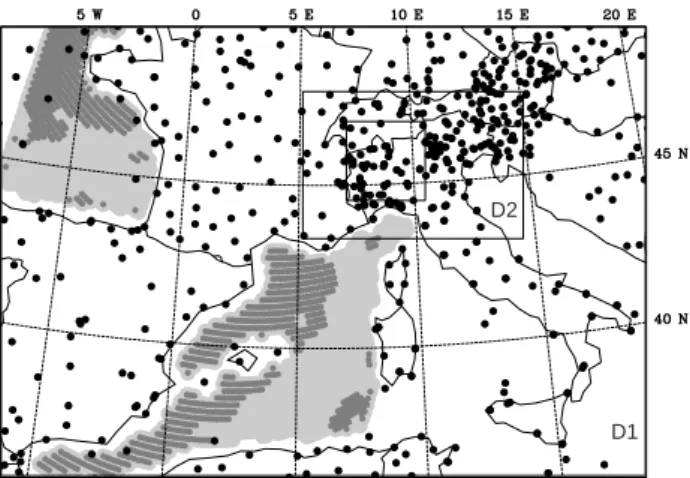
The SSM/I passive microwave radiometer operates on the DMSP satellites. It has four frequencies at 19.35, 22.235, 37.0, and 85.5 GHz with dual polarization except the 22 GHz frequency, which works on vertical polarization only. It has a conical scan and a swath of 1400km. On each scan it takes 128 uniformly spaced samples at the 85GHz frequency with a spatial resolution of 12.5 km. The others frequencies are sampled with a double temporal and spatial resolution, i.e. 8.4 ms and 25 km. This spatial resolution is of the same or-der of the model grid step in the 1st domain (outmost box in Fig. 1), i.e. 27 km. Note also that the area under consider-ation, which corresponds roughly to 3×10⁶km2, is scanned within few minutes during the satellite overpass. For more details, see Hollinger et al. (1990).
230 C. Faccani et al.: SSM/I Data Assimilation
D1 D2
Fig. 1. Model domains. The light gray dots are the SSM/I pixels
selected by 3DVAR for Brightness Temperature or water vapor data assimilation; the dark gray dots are the points where the surface wind speed is available; the black points are the land and sea surface stations used to validate the data assimilation results on the Initial Conditions.
In Fig. 1 the light gray dots reproduce the SSM/I swath over sea at 0600UTC 20 September 1999. SSM/I data are as-similated into the model in two different ways: as Bright-ness Temperatures or as retrieved quantities, as surface wind speed (Goodberlet et al., 1989) and Precipitable Water (Ger-ard and Eym(Ger-ard, 1998).
3 3DVAR
The 3-Dimensional Variational Data Assimilation (Courtier et al., 1998; Gustafsson et al., 2001; Barker et al., 2004) has been used to improve the Initial Conditions by SSM/I data. 3DVAR assimilates the data by minimizing the cost function
J defined as J = 1 2(x b−x)TB−1(xb−x) + 1 2(y o−H (xb))TR−1(yo−H (xb)) (1)
where xb is the generic variable of the first guess, yois the observation, and H is the operator that converts the model state variables to the observed variables at the observation location. B and R are the error covariance matrices for the first guess and for the observations, respectively. The solu-tion of the minimizasolu-tion produces improved Initial Condi-tions, which are the best compromise between the first guess and the observations.
In this case, the ECMWF (European Center for Medium-Range Weather Forecast) analysis has been used as first guess.
The package of subroutines used by 3DVAR to assimilate the SSM/I Brightness Temperatures is based on the Petty al-gorithms (Petty and Katsaros, 1992, 1994; Petty, 1994a,b, 1997). The RTE model solves the problem for a non
scat-10E
45N
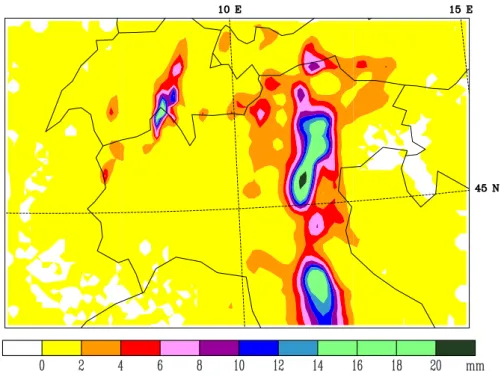
Fig. 2. 1 hour observed accumulated precipitation (mm) from rain
gauges ending at 16:00 UTC 20 September 1999.
tering atmosphere as viewed from satellite, taking into ac-count both downwelling and upwelling radiance as well as sea surface reflection with foam effects. It takes into account the gaseous absorption of the atmosphere using a frequency-dependent parameterization derived from the comparison of the line-by-line Liebe (1985) model (theoretically valid up 1000 GHz) with more than 15 000 radiosondes. Cloud emis-sion is also empirically parameterized in a non-linear way to liquid water content cloud layer of known height derived from MM5 field. Because the algorithms does not include the scattering processes the raining data are filtered out. More-over, because the land surface emissivity contaminates the SSM/I measurements, only data over the sea surface are assimilated. Because 3DVAR uses vertical and horizontal physical balance during the minimization procedure, the cor-rection will be found over land too.
The thinning (J¨arvinen and Und´en, 1997) procedure can be applied to the data to reduce their number, and then, their density. In this way, the error-correlation among the SSM/I Brightness Temperatures is reduced, and then, the observa-tion error covariance matrix R is diagonal (as it usually is), reducing the 3DVAR minimization time. In this work, the ef-fect of applying the thinning or not to the SSM/I data (Bright-ness Temperature or PW and surface wind speed) will be tested. The thinning window used is of 1 grid points in each direction.
4 The case
The selected case is the IOP2b of the MAP (Mesoscale Alpine Programme, http://www.map.ethz.ch) 1999. At 06:00 UTC 20 September 1999, corresponding to the pas-sage of the SSM/I satellite on the Mediterranean area (Fig. 1), an upper level trough, coming from north-west, was moving eastward, advecting warm and humid air from south. Mod-erate rainfall was recorded on the north of Italy as showed in Fig. 2.
ICs TBs PW& wind thinning
ICNTR – – – CNTR
IRETRa no 2809 no RETRa
IRETRt no 690 yes RETRt
ITBa 1920 no no TBa ITBt 725 no yes TBt ITBt19 725 no yes TBt19 ITBt22 725 no yes TBt22 ITBt37 725 no yes TBt37 ITBt85 725 no yes TBt85 5 Experiment design
A few experiments have been carried out to evaluate the im-pact of the SSM/I data on both the Initial Conditions and the related forecasts. The ECMWF analyses are used. These data do not include the special observations produced during the MAP. Moreover, no SSM/I data were assimilated into the ECMWF analyses at that time, i.e. 1999. The PW together with the surface wind speed or the Brightness Temperature have been assimilated.
It will allow to assess the different role played by the dif-ferent kind of SSM/I data (retrieved or not). The experiment design is showed in Table 1; in the first column there are the acronyms used for the study of the Initial Conditions. ICNTR is the case without any data assimilation: it is the ECMWF analysis interpolated to our model grid (Fig. 1). IRETR and ITB refer to the assimilation of the retrieved quantities (PW and wind surface speed) and the Brightness Temperature, re-spectively. a and t point out the assimilation of all the OBS, or if the thinning process has been applied by 3DVAR to the ingested data. In Table 1 is also showed the number of ob-servations read in for each case.
Four new sets of Initial Conditions are obtained removing one by one the SSM/I frequencies from the ingested dataset. They are the last 4 lines in Table 1 referred by the number of the missing frequency. These special cases are performed using the thinning of the observations that, as already pointed out, it is the correct way to treat the SSM/I data.
The last column of Table 1 shows the forecast experiments produced using the previously improved Initial Conditions. The experiments start at 06:00 UTC Septemper 1999 and they end after 24 h.
OBS-Case M RMS M RMS M RMS ICNTR −0.09 3.17 −0.10 3.10 −0.73 3.37 IRETRa 0.35 3.25 −0.04 3.06 −0.75 3.39 IRETRt 0.74 3.31 −0.05 3.06 −0.75 3.39 ITBa 0.78 3.41 0.10 3.63 −0.79 3.78 ITBt 0.22 3.21 −0.01 3.15 −0.73 3.44 ITBt19 0.21 3.20 −0.02 3.14 −0.74 3.43 ITBt22 0.10 3.17 −0.09 3.11 −0.77 3.39 ITBt37 −0.04 3.20 −0.05 3.15 −0.68 3.42 ITBt85 0.19 3.21 −0.01 3.15 −0.72 3.45 6 Model setup
The model used for this case is the non hydrostatic model MM5, version 3 from PSU/NCAR (Grell et al., 1994; Dud-hia, 1993). The selected domains are showed in Fig. 1. The high resolution of the innermost domain is 3 km. The ratio of the spatial resolution between each domain and its mother domain is 3 (i.e. the domain 1 has a resolution of 27 km). 29 vertical σ terrain following levels are used and the Hong and Pan (1996) and Troen and Mahrt (1986) parameterization is used to describe the planetary boundary layer. The Kain and Fritsch (1990) scheme is used to describe the cumulus con-vection and the Reisner et al. (1998) parameterization for the explicit moisture scheme.
The Initial Conditions are at 06:00 UTC 20 September 1999 and the related model experiments end after 24 h.
7 Initial Conditions
The quality of the Initial Conditions has been evaluated using the statistical parameters
M = N P i (OBSi−I Ci) N (2) and RMS = v u u u t N P i (OBSi −I Ci)2 N . (3)
232 C. Faccani et al.: SSM/I Data Assimilation
Fig. 3. 1 hour accumulated precipitation (mm) ending at 16:00 UTC 20 September 1999 for CNTR.
where OBS is the observation and IC is the analysis at the ith station location. The surface stations used for this analysis are the black dots in Fig. 1.
In Table 2 there are the M and RMS for the various Initial Conditions for Temperature and horizontal wind component U and V. The water vapour mixing ratio is not showed be-cause it presents a mean error larger than 5.19 g/kg and a
RMS of about 6.0 g/kg for all the cases. Because ICNTR has a M=−5.19, it means that the assimilation is not able to recover the initial large overestimation, but it increases the error. ICNTR shows a small overestimation of the Temper-ature respect to the observations (−0.09). The assimilation of the Precipitable Water and surface wind speed (IRETRa and IRETRt) produces a large underestimation respect to IC-NTR, especially if the observations are assimilated using the thinning (M=0.74). Same for the assimilation of the Bright-ness Temperature (ITBa and ITBt), even if the mean errors are lower than the IRETR cases, except for ITBa, meaning that the assimilation of all the Brightness Temperature with-out thinning largely decreases the quality of the temperature field. The underestimation is partially recovered by the lack of the 22 and 37 GHz frequencies (ITBt22 and ITBt37) on the assimilated dataset, showing the lowest M values of the whole set: 0.10 for ITBt22 and −0.04 for ITBt37. It has to remind that the RTE algorithm used by 3DVAR exludes the scattering process, therefore the contribution of the 85 GHz channels is reduced. Vice versa for the 22 and 35 GHz. It means that their absence on the dataset used for the assim-ilation, can slightly modify the results; in this case with an improved result.
For the zonal wind, ICNTR shows the larger M value (−0.10), whereas all the data assimilation cases have a lower mean error. The higher value is the one of ITBa (0.10), which also has the unique positive Mean error (underesti-mation). Remarkable is the results of ITBt (M=−0.01) that shows a zonal field close to the real one. Because the surface wind speed algorithm uses the 19 V, 22 V and both 37 GHz channels, the sensitivity test cases show that removing one of them, the mean error increases, especially for the 22 GHz (M=−0.09) and 37 GHz (M=−0.05) frequencies.
Comparable results are not found for the south-north wind component (V); all cases overestimate the field and all of them, except ITBt37, have a mean error larger than
−0.72 m/s. Also in this case, ITBa has the largest M value (−0.79), confirming that the assimilation of Brightness Tem-perature without thinning decreases the quality of the final analysis. ITBt22 shows large mean errors for both the wind components confirming that it is an important channel on the correct estimation of the wind field. As for the water vapor mixing ratio, the results on the V component confirm that if it exists a large error on the initial field, the data assimilaztion is not able to recover it, but it often increases it.
8 Forecast Experiments
In Fig. 3 there is the 1 h accumulated precipitation for the CNTR experiment. It shows a maximum of precipitation on the Alps between Italy and Switzerland, and an area of high precipitation along the 11E meridian with a maximum on the southern part of more than 20mm (black area in Fig. 3). High precipitation is also found close to the bottom boundary of
c
d
e
f
g
h
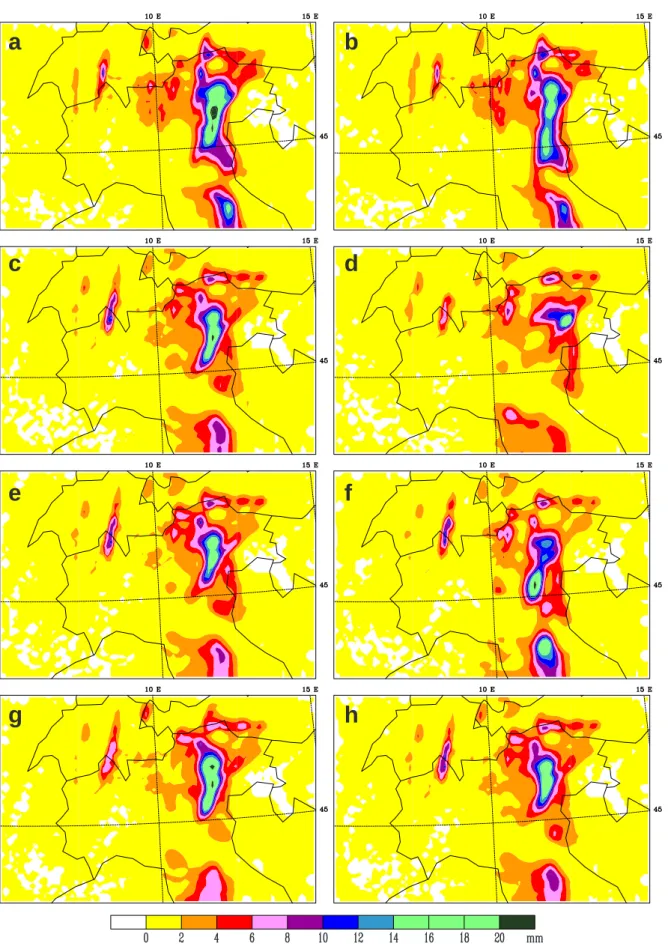
Fig. 4. 1 hour accumulated precipitation ending at 16:00 UTC 20 September 1999 for: (a) RETRt, (b) RETRa, (c) TBt, (d) TBa, (e) TBt19, (f) TBt22, (g) TBt37, and (h) TBt85.
234 C. Faccani et al.: SSM/I Data Assimilation
the domain. The comparison with the observations (Fig. 2) shows a disagreement on the west side of the domain, on the boundary between Italy and Switzerland. RETRt (Fig. 4a) shows a better location of the maximum on the boundary be-tween Italy and Switzerland than CNTR. The area of high precipitation on the south of the domain is reduced, but still incorrectly reproduced. Moreover, the high precipitation area around 11 E and north of 45 N is enhanced. The assimila-tion of all the retrieved data produces an improvement of the area on the south of the domain for RETRa (Fig. 4b), but it still overestimate the rainfall along 11 E, even if the maxima (black areas in Fig. 4a) disappear. The assimila-tion of the Brightness Temperature reduces the maximum on the south of the domain especially for the TBa experiment (Fig. 4d), even if this maximum does not exist in the ob-servation dataset. Moreover, this case displaces the reduced maximum westward, on the upslope side of the Apennines, as a result of an orographic precipitation.
The sensitivity experiments show for TBt19 (Fig. 4e) a precipitation distribution similar to the TBt case (Fig. 4a). TBt22 (Fig. 4f) correctly places the maximum of precipita-tion close to the 45 N of latitude. However it increases the maximum of precipitation on the south of the domain. This maximum is reduced if the 37 GHz frequency is removed from the dataset ingested by 3DVAR (Fig. 4g). The last cases, TBt85 (Fig. 4h), is similar to TBt19 (Fig. 4e).
9 Conclusions
The aim of this paper was to evaluate the impact of the SSM/I data on the precipitation forecast. Both Brightness Tempera-ture or Precipitable Water and surface wind speed have been assimilated by 3DVAR, with and without the thinning proce-dure, to verify the effect of a different dataset density. More-over, a set of special test cases to evaluate the impact of each SSM/I frequency of the Initial Conditions have been done. Good results are found for the temperature field if the 22 or 37 GHz channels are removed from the initial dataset. On the other hand, a large improvement on the zonal wind field is found if all the frequencies are assimilated. The assimi-lation of the retrieved quantities does not produce results as good as for the Brightness Temperature.
The Initial Conditions produced by data assimilation of Brightness Temperature or Precipitable Water and surface wind speed have been used to initialize the MM5 model. The results show that the assimilation of the retrieved quantities places the precipitation too eastward respect to the observa-tion, along a vertical axis parallel to 10 E. Moreover, the thin-nig (RETRt) produces a large overestimation of the maxima of precipitaion. The assimilation of the Brightness Tempera-ture reduces the area of precipitation in two localised areas, in agreement with the observations, but the location is still too east respecto to the observations, especially for ITBa. Moreover, in this last case the precipitation is largely un-derestimante on the south of the domain. The comparison among the IRETR cases and the ITB cases shows that the
thinning of the observations produces good results if it is ap-plied to the SSM/I Brightness Temperature instead of to the retrieved quantities.
A remarkable result is the dependence of the forecast on the 37 GHz frequency. The quality of the model precipi-tation decreases if it is removed from the dataset ingested by 3DVAR: the precipitation on the south of the domain is largely reduced and the area of high precipitation on the east sid of the domain is increased in space and amount, not in agreement with the observations. Vice versa for the 22 GHz frequency: it means that the 22 V SSM/I channel, which is sensible to the atmospheric water vapour, introduces an er-ror in the initial conditions that propagates ad increases dur-ing the model integrations. Therfore, its removal from the ingested dataset, improves the forecast. It has to be noticed that, although the 85 GHz is located in a window region, then it is also sensitive to atmospheric humidity because of the wa-ter vapor continuum wa-term, it is affected by scatwa-tering. Thus, because the RTE algorithm is coded for an atmosphere with-out scattering, it has a small impact on the forecast.
Acknowledgements. A special thanks to all the Italian Regional Centers that help us to collect the data of precipitation for this study: ARPA Piemonte, ERSAF Lombardia, ARPA Emilia Romagna, Osservatorio di Macerata Marche, Ufficio Idropluviometrico e Mareografico di Pisa. Thanks to G. Giuliani for the interpolation routines.
Edited by: L. Ferraris
Reviewed by: A. Mugnai and another referee
References
Barker, D. M., Huang, W., Guo, Y.-R., Bourgeois, A., and Xiao, Q.: Three-Dimensional Variational Data Assimilation System for MM5: Implementation and initial results, Mon. Wea. Rev., 132, 897–914, 2004.
Courtier, P., Anderson, E., Heckley, W., Pailleux, J., Vasiljeric, D., Hamrud, M., Hollingsworth, A., Rabier, F., and Fisher, M.: The ECMWF implementation of three-dimensional variational assimilation (3D-Var). I: Formulation., Q. J. R. Meteorol. Soc., 124, 1783–1807, 1998.
Dudhia, J.: A nonhydrostatic version of the Penn State-NCAR Mesoscale Model: Validation tests and simulation of an Atlantic cyclone and cold front, Mon. Wea. Rev., 121, 1493–1513, 1993. Gerard, E. and Eymard, L.: Remote sensing of integrated cloud liq-uid water: development of algorithms and quality control, Radio Sci., 33, 433–447, 1998.
Gerard, E. and Saunders, R.: Four-dimensional variational assimi-lation of Special Sensor Microwave/Imager total column water vapour in the ECMWF model., Q. J. R. Meteorol. Soc., 125, 1453–1468, 1999.
Goodberlet, M., Swift, C., and Wilkerson, J.: Remote Sens-ing of Ocean Surface Winds With the Special Sensor Mi-crowave/Imager, J. Geophys. Res., 94, 14 547–14 555, 1989. Grell, G., Dudhia, J., and Stauffer, D.: A Description of the
Fifth-Generation Penn State/NCAR Mesoscale Model (MM5)., NCAR Tech. Note NCAR/Tn-398+STR, 1994.
Gustafsson, N., Berre, L., H¨ornqvist, S., Huang, X.-Y., Lind-skog, M., B.Navascue, Mogensen, K. S., and Thorsteinsson, S.: Three-dimensional variational data assimilation for a limited area
in a medium range forecast model, Mon. Wea. Rev., 124, 2322– 2339, 1996.
Hou, A., Zhang, S., and Reale, O.: Variational Continuous Assimi-lation of TMI and SSM/I Rain Rates: Impact on GEOS-3 Hurri-cane Analyses and Forecasts., Mon. Wea. Rev., 132, 2094–2109, 2004.
J¨arvinen, H. and Und´en, P.: Observation screening and first guess quality control in the ECMWF 3D-VAR data assimilation sys-tem, ECMWF Tech. Memo., Available from the ECMWF, Read-ing, UK, 236, 1997.
Kain, J. S. and Fritsch, J. M.: A one-dimensional entrain-ing/detraining plume model and its application in convective pa-rameterization, J. Atmos. Sci., 47, 2784–2802, 1990.
Liebe, H.: An updated model for millimeter wave propagation in moist air, Radio Science, 20, 1069–1089, 1985.
Petty, G.: Physical retrieval of over-ocean rain rate from the multi-channel microwave imagery. Part I: Theoretical characteristics of normalized polarization and scattering indices, Meteor. Atmos. Phys., 54, 79–99, 1994a.
weather reports, J. Geophys. Res., 102, 1757–1777, 1997. Petty, G. and Katsaros, K.: The response of the Special Sensor
Mi-crowave/Imager to the marine environment. Part I: An analytic model for the atmospheric component of observed brightness temperatures, J. Atmos. Ocean. Tech., 9, 746–761, 1992. Petty, G. and Katsaros, K.: The response of the Special Sensor
Mi-crowave/Imager to the marine environment. Part II: A parame-terization of the effect of the sea surface slope distribution on emission and reflection, J. Atmos. Ocean. Tech., 11, 617–628, 1994.
Reisner, J., Rasmussen, R., and Bruintjes, R.: Explicit forecast-ing of supercooled liquid water in winter storms usforecast-ing the MM5 mesoscale model, Q. J. R. Meteorol. Soc., 124B, 1071–1107, 1998.
Troen, I. and Mahrt, L.: A simple model of the atmospheric bound-ary layer: Sensitivity to surface evaporation., Bound.-Layer Me-teor., 37, 129–148, 1986.
Tsuyuki, T.: Variational Data Assimilation in the Tropics Using Precipitation Data. Part III: Assimilation of SSM/I Precipitation Rates., Mon. Wea. Rev., 125, 1447–1464, 1997.