HAL Id: hal-00297390
https://hal.archives-ouvertes.fr/hal-00297390
Submitted on 28 Feb 2006
HAL is a multi-disciplinary open access
archive for the deposit and dissemination of
sci-entific research documents, whether they are
pub-lished or not. The documents may come from
teaching and research institutions in France or
abroad, or from public or private research centers.
L’archive ouverte pluridisciplinaire HAL, est
destinée au dépôt et à la diffusion de documents
scientifiques de niveau recherche, publiés ou non,
émanant des établissements d’enseignement et de
recherche français ou étrangers, des laboratoires
publics ou privés.
Evaluation of radiative transfer schemes for mesoscale
model data assimilation: a case study
A. Memmo, C. Faccani, R. Ferretti, S. Di Michele, F. S. Marzano
To cite this version:
A. Memmo, C. Faccani, R. Ferretti, S. Di Michele, F. S. Marzano. Evaluation of radiative transfer
schemes for mesoscale model data assimilation: a case study. Advances in Geosciences, European
Geosciences Union, 2006, 7, pp.193-198. �hal-00297390�
SRef-ID: 1680-7359/adgeo/2006-7-193 European Geosciences Union
© 2006 Author(s). This work is licensed under a Creative Commons License.
Advances in
Geosciences
Evaluation of radiative transfer schemes for mesoscale model data
assimilation: a case study
A. Memmo1, C. Faccani1, R. Ferretti1,2, S. Di Michele3, and F. S. Marzano1,4
1Centro di Eccellenza CETEMPS, Universit`a dell’Aquila, L’Aquila, Italy 2Dipartimento di Fisica, Universit`a dell’Aquila, L’Aquila, Italy
3Research Department, Satellite Section, European Centre for Medium-Range Weather Forecasts (ECMWF), Reading, UK 4Dipartimento di Ingegneria Elettronica Universit`a di Roma “La Sapienza”, Rome, Italy
Received: 11 November 2005 – Revised: 23 December 2005 – Accepted: 13 January 2006 – Published: 28 February 2006
Abstract. The assimilation of Special Sensor Microwave
Imager (SSM/I) data into the Mesoscale Model 5 (MM5) al-lows for improving the weather forecast. However the results suggested an update the Radiative Transfer Equation (RTE) within the three-dimensional variational (3DVAR) algorithm which is tailored for non rainy conditions only. To this pur-pose, a new RTE algorithm is tested, in order to account for radiometric response in rainy regions. The new brightness temperatures (TB) are estimated by using hydrometeor pro-files from the MM5 mesoscale model, running with two dif-ferent microphysical parameterizations. The goodness of the results is assessed by comparing the new TBwith those of the original RTE algorithm in the 3DVAR code and the SSM/I observed data. The results confirm a better reliability of the new RTE compared to the old one.
1 Introduction
The variational data assimilation is one of the major issues for the scientific meteorological community (Courtier et al., 1998; Gustafsson et al., 2001; Barker et al., 2004) being a powerful technique to ingest a large variety of measure-ments into numerical weather forecast models. In this con-text, satellite data can provide a large amount of information, especially over those areas (sea surface) where conventional observations, such as radiosonde or synop, are not available or scarce. Satellite data are also fundamental to improve the initialization of the numerical weather prediction models.
Particularly, the Special Sensor Microwave Imager (SSM/I) can provide information on the atmospheric moist variables, such as precipitable water, cloud liquid water and rain rate over the sea surface retrieved from measured bright-ness temperatures (TB). The latter may also be assimilated
Correspondence to: A. Memmo ([email protected])
directly, but this task requires the set up of an accurate Ra-diative Transfer Equation (RTE) algorithm which, in away, maps the three-dimensional (3-D) gaseous concentration and atmospheric particles distribution into a radiance field (Bauer et al., 2002). This mapping is easily obtained in clear sky or non rainy conditions (Faccani et al., 20051), but it be-comes complex in rainfall conditions (Amerault and Zou, 2003). The computation of the atmospheric microwave ra-diance in cloudy and rainy conditions is a critical task for radiative transfer models, as it has to include multiple scatter-ing effects (Marzano et al., 1999a, 1999b; Di Michele et al., 2005). To accurately compute TB in previous conditions, it is necessary to use a hydrometeor profiles such as liquid wa-ter droplets, raindrops, ice crystals, snow and graupel parti-cles. Unfortunately, this information is not available through conventional observations, so that a simulated environment is often set up by resorting to a numerical weather forecast model (Bauer, 2000; Kummerow et al., 2001; Tassa et al., 2003). The numerical model has to provide a detailed mi-crophysical description with a fine spatial resolution both in time and space.
In this work an RTE scheme, based on the pseudo-3-D Ed-dington algorithm (RTE-EDD), is tested for variational data assimilation purposes into mesoscale forecast models. The RTE algorithm can handle rainy areas and uses a hydrom-eteor profile extracted from the Mesoscale Model 5 (MM5 from NCAR/PSU) non-hydrostatic model. Two different microphysical parameterizations of hydrometeor distribution are selected within MM5. The TBsimulations are compared with the SSM/I observations and with those computed using the standard RTE algorithm coded for the three-dimensional Variational (3DVAR) data assimilation scheme.
1Faccani, C., Ferretti, R., Cimini, D., and Marzano, F. S.:
Three-dimensional variational assimilation of Special Sensor Mi-crowave/Imager data on mesoscale weather prediction model: a case study, in preparation, 2005.
194 A. Memmo et al.: Evaluation of radiative transfer schemes for mesoscale model data assimilation
2 Simulation of microwave radiometric response
A general theoretical framework to model the up-welling brightness temperature is given by the radiative transfer the-ory (Ulaby et al., 1981). For a plane-parallel geometry, the unpolarized azimuthally-symmetric up-welling bright-ness temperature can be formally expressed by means from radiative transfer equation (RTE), that is:
dTB(τ, ) dτ = −TB(τ, ) + w 4π Z 4π p(, 0)TB(τ, )d0 +(1 − w)T (τ ) (1)
where τ is the optical thickness is the solid angle,
p(, 0) is the phase function and w is the volumetric albedo and where J (τνµ)is the pseudo source function given by: J (τν, µ) = w 4π Z 4π p(, 0)Tb(τν, 0)d0+ [1 − w]T (τν) (2)
with w the volumetric albedo, p(, 0) the volumetric azimuthally-averaged scattering phase function, and T the physical temperature. The first term of J is sometimes re-ferred to as a multiple scattering source, while the second term represents thermal emission. The atmosphere is as-sumed to consist of adjacent homogeneous layers in which volumetric albedo w, extinction coefficient ke and phase function p are taken to be constant within layers. The at-mospheric gas and hydrometeor profiles can be derived from mesoscale cloud models at high spatial resolution such as the MM5 model.
2.1 Mesoscale cloud numerical model
The MM5 mesoscale model from PSU/NCAR (Grell et al., 1994; Dudhia, 1993) is used for the experiments; the model is running with 29 vertical levels, 27 km of grid step in region lat=[35, 50]–lon =[−3, 23]. Two different experiments are performed using two microphysical parameterizations: Reis-ner 1 (R1) (ReisReis-ner et al., 1998) and Goddard (GSFC) mi-crophysics (Tao and Simpson, 1993).
The R1 scheme accounts for cloud water (qw), cloud ice (qi), rain (qr)and snow (qs)to be produced simultaneously, but it does not account for the production of graupel. Instead, the GSFC scheme includes one further prognostic equation for graupel (qg). For both schemes the dimensional distribu-tion of the hydrometeors is assumed to follow the Marshall-Palmer distribution (Marshall and Marshall-Palmer, 1948)
Nhdx = Nh0e
−λxdx (3)
where x is the particle size, h is a generic hydrometeor, λ is the slope parameter and N0 is the intercept parameter. λ is inversely proportional to the mixing ratio of the any hydrom-eteor (qh≡qw, qi, qr, qs, or qg): λ = πρhN 0 h ρqh !1/4 (4)
where ρ is the density of air and ρhis the density of any hy-drometeor. That is: the greater the mixing ratio, the wider is the size distribution. The intercept parameters Nh0are fixed for both the R1 and GSFC schemes. These two schemes also differ for a few constants which describe the concentration number of hydrometeors as well as their density. All the model simulations are initialized using ECMWF data anal-yses.
2.2 RTE model in 3DVAR scheme
The RTE algorithm in the 3-Dimensional Variational Data Assimilation (3DVAR) for MM5 is based on the Petty’s al-gorithm (Petty, 1992, 1997). This alal-gorithm, named RTE-3DVAR, solves the problem for a non scattering atmosphere as viewed from satellite, taking into account both down-welling and updown-welling radiance as well as sea surface reflec-tion with foam effects. Moreover, it takes into account the gaseous absorption of the atmosphere using a frequency de-pendent parameterization derived from the comparison of the line-by-line Liebe (1985) model.
Cloud emission is also empirically parameterized in a non-linear way to liquid water content cloud layer of known height, derived from MM5 field. Because the algorithm does not include the scattering processes the raining data are fil-tered out. Furthermore, because the land surface emissivity contaminates SSM/I measurements, only data over the sea surface are considered.
2.3 RTE multiple-scattering model
The second-order Eddington approximation is valid for linearly-polarized radiation, azimuthally isotropic, non-depolarizing and stratified medium, with linear temperature gradient and proper boundary conditions. The RTE-EDD is decomposed into (Marzano et al., 2002; Smith et al., 2002):
dTBo(τυ)
dτ = −(1 − wg)TB1(τυ) dTB1(τυ)
dτ = −3(1 − wg)[TB0(τυ) − (bo+b1τν)]
(5) where TB0 and TB1 are the zero- and first-order Legendre
expansions of TB and temperature is linearly expanded in t through b0and b1.
The RTE-EDD model is based on the Eddington scheme for the TBapproximation on slanted cloud geometry. It uses a cloud model procedure derived from microwave space-borne radiometry (Marzano et al., 1999a, b; Di Michele et al., 2005) and cloud-resolving microphysical 3-D out-puts. For the radiative signature generation the RTE model uses spherical-shape parameterized Particle Size Distribution (PSD) with mixed-phase melting layer, Lambertian and Fres-nel surface mode, microwave bands range 5–180 GHz and elevation angle range 0–90◦.
3 Comparison with measurements
A comparison is performed between SSM/I data and both RTE-3DVAR and RTE-EDD, using the two MM5
Fig. 1. Data over the sea filtered by 3D-VAR. (a) SSM/I satellite data at 37 GHz V channel at 19:00 UTC ; (b) RTE-3DVAR simulated
emission with GSFC parameterization at 37 GHz V channel at 19:00 UTC; (c) RTE-EDD simulated emission with GSFC parameterization at 37 GHz V channel at 19:00 UTC.
Fig. 2. All data over the sea. (a) SSM/I satellite data at 37 GHz V channel at 19:00 UTC; (b) RTE-EDD simulated emission with GSFC
parameterization at 37 GHz V channel at 19:00 UTC.
microphysical parameterizations R1 and GSFC. To the aim of understanding the impact of the assumption of non rainy conditions for the RTE-3DVAR, two different set of data are analyzed for the same SSM/I swaths: the first one is made up of excluding the rainy area, for both RTE schemes; the sec-ond one is composed of including the rainy area, but using only the Eddington RTE model.
3.1 Satellite data
The SSM/I data available during 24 January 2003 are used for testing both RTE and the 3DVAR algorithm. The SSM/I microwave radiometer operates on the DMSP satellites. It has four frequencies at 19.3, 22.2, 37.0, and 85.5 GHz with dual polarization, except the 22.2 GHz frequency, which works on vertical polarization only. It has a conical scan and a swath of 1400 km. On each scan, it takes 128 uniformly spaced samples at the 85 GHz frequency with a spatial reso-lution of 12.5 km. The others frequencies are sampled with a double temporal and spatial resolution, i.e. 8.4 ms and 25 km (Hollinger et al., 1990).
The MM5-3DVAR routine filter the measured data for rainy area so that only clear-sky and cloudy regions are
se-lected. Figure 1a shows an example of SSM/I data filtered by 3DVAR routine as compared to TB simulations derived from RTE-3DVAR (Fig. 1b) and from RTE-EDD (Fig. 1c). If all the SSM/I data are retained (see Fig. 2a, yellow-red area), it clearly appears a region of liquid water also for the RTE-EDD (see Fig. 2b yellow-red area).
To better understand and quantify the results, histograms are built for each SSM/I channel, where the number of points that fall in a given TB range are counted for all time-steps. This approach is used for a preliminary evaluation and as an objective method to compare the different RTE schemes, obviously more events have to be accounted for gathering a significant statistical evaluation.
3.2 Sensitivity to the model parameterizations
In general, the main difference between Reisener-1 and God-dard parameterizations yield a different spatial distribution of water type particles, but this does not affect significantly the histograms of each TB channel (not shown). Indeed, a small difference is found at 85 GHz channel only for the non rainy areas, suggesting that GFSC may provide a slightly better agreement with SSM/I data. This is probably due to
196 A. Memmo et al.: Evaluation of radiative transfer schemes for mesoscale model data assimilation
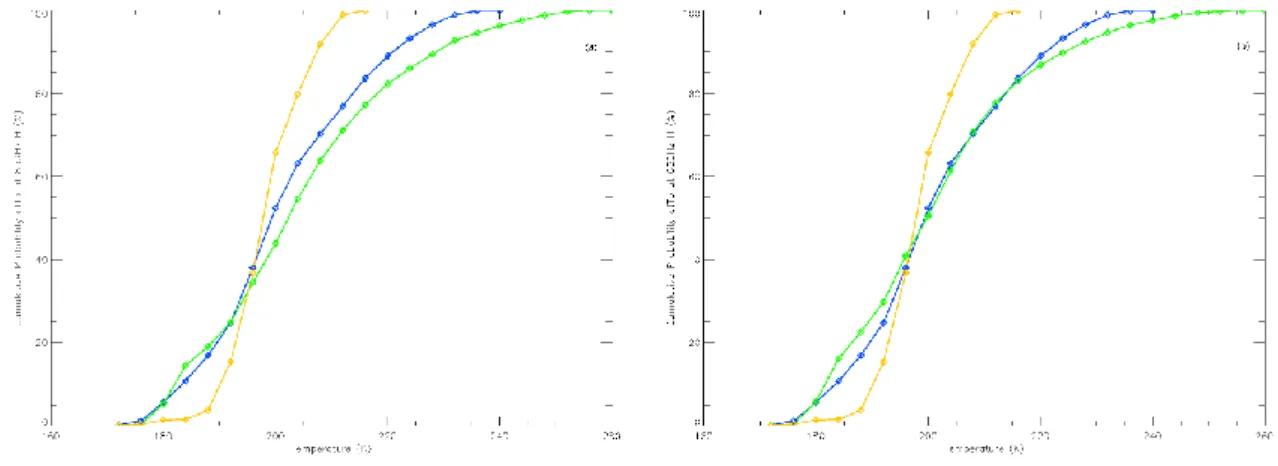
Fig. 3. Cumulative probability at 85 GHz H for (a) Reisner 1; (b) Goddard parameterizations. The color code: Yellow represents
RTE-3DVAR; green represents RTE-EDD and blue SSM/I observations.
the physical description adopted for graupel particles (see Fig. 3). The analysis of all TB channel is discussed in the following paragraphs, but only the 37 and 85 GHz will be shown.
3.2.1 Analysis of 19 GHz channels
The major contribution to the atmospheric emission at 19 GHz is produced by the water vapour molecules. The RTE-EDD algorithm both for vertically (V) and horizontally (H) polarized channels shows a slightly larger range than RTE-3DVAR. Moreover, larger similarities are found be-tween RTE-EDD and SSM/I data at 19V than bebe-tween SSM/I observations and 3DVAR (not shown). However, RTE-EDD shows a clear under-estimation of TB at 19 H, this fea-ture in not found for the data derived by the RTE-3DVAR algorithm (not shown).
3.2.2 Analysis of 22 GHz channel
Similarly, at the 22 V the shape of percentage values is better reproduced by EDD algorithm than the RTE-3DVAR. Moreover, both for Eddington approximation and RTE-3DVAR there is a small overestimation of the TB val-ues and the former clearly does not reproduce the lower TB values (not shown).
3.2.3 Analysis of 37 GHz channel
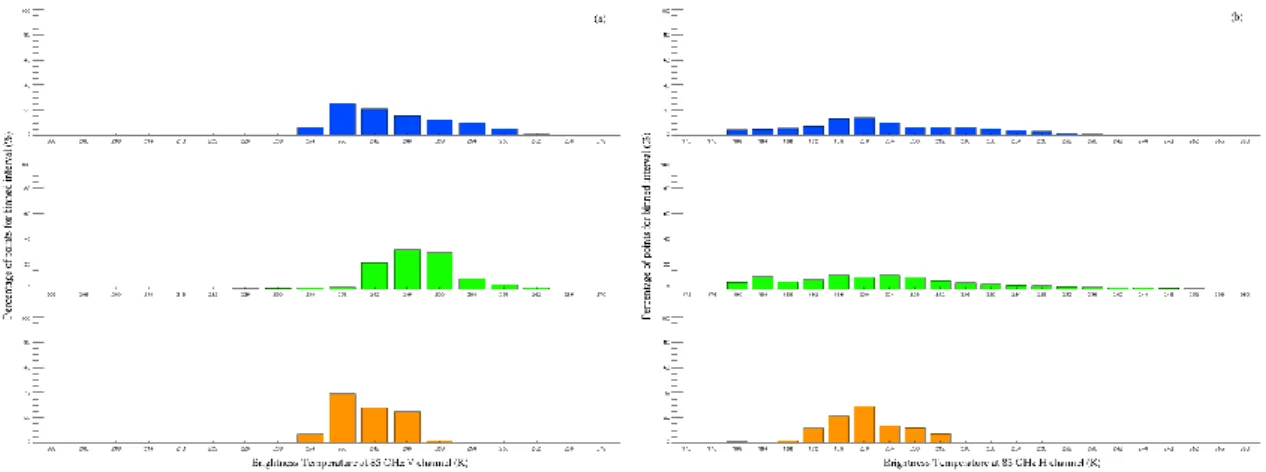
The 37 GHz channels are very sensible to the liquid water particles. At the vertical channel, the RTE-EDD algorithm seems to follow the distribution of SSM/I measurements, ex-cept for lower TBvalues (Fig. 4a). This clearly shows a shift-ing of TB toward high emissions by RTE-EDD, producing an overestimation with respect to the observed one. On the other hand, the RTE-3DVAR algorithm concentrates more than 80% of its Tbestimations in one binned interval only, centred between 202 K and 206 K. This suggests a poor effi-ciency in reproducing the cloud emission. At 37 H, the RTE-3DVAR algorithm shows a slightly more variability in TB
values than at V channel, but it still produces a small range of variability centred around 142 K (Fig. 4b). The Edding-ton RTE algorithm shows an overestimation of the number of points at low temperature and an underestimation of those at high temperature (Fig. 4b). If rainy regions are taken into account, the agreement between SSM/I observations and the RTE-EDD simulations reduces especially at H channels in respect with the previous case. A spreader distribution is found for the RTE-EDD showing a good agreement with the observed TB, but at lower temperature, the RTE-EDD over-estimates the number of points. The results on rainy areas suggest a difficulty of the RTE-EDD model to correctly re-produce the temperature in non rainy regions (Figs. 4c, d). 3.2.4 Analysis of 85 GHz channel
The major contribute to the atmospheric emission at 85 GHz are due to solid crystals and graupel particles. At this fre-quency the differences between the V and H channels are remarkable for the two RTEs. At V channel, the RTE-EDD shows an overestimation of points with high TB values with respect to SSM/I data (top end middle in Fig. 5a); on the contrary, RTE-3DVAR shows (bottom in Fig. 5a) a distribu-tion of brightness temperature values slightly sharper than the observed one, whose values are comparable to the low temperature of the observed SSM/I. For H channel, RTE-EDD shows a good agreement with SSM/I data (top and mid-dle in Fig. 5b), whereas RTE-3DVAR does not seem to be able to correctly reproduce the distribution of the TB(bottom in Fig. 5b). Indeed, RTE-3DVAR concentrated on few bins its distribution of the brightness temperature No remarkable change are found if rainy are considered.
4 Conclusions and future developments
The previous results infer that TB produced by the RTE-EDD scheme assume a wide range of variability in respect with the ones produced by RTE-3DVAR, showing a better agreement (i.e. the histograms) with the SSM/I observations
Fig. 4. Percentage of points falling in the TBbinned interval for 37 GHz channels for GSFC parameterization. In panel (a) is showed the 37 V channel for non rainy zone; in panel (b) is showed 37 H channel for non rainy zone; in panel (c) is showed the 37 V channel for rainy and non rainy zone; in panel (d) is showed the 37 H channel for rainy and non rainy zone. The color code: orange represents RTE-3DVAR; green represents RTE-EDD and blue SSM/I observations.
Fig. 5. Percentage of points falling in the TBbinned interval for 85 GHz channels for GSFC parameterization. In panel (a) is showed the 85 V channel for non rainy zone and in panel (b) is showed the 85H channel for non rainy zone. The color code: orange represents RTE-3DVAR; green represents RTE-EDD and blue SSM/I observations.
than 3DVAR. Particularly, the agreement between RTE-EDD and SSM/I measurements is very good for 85 H chan-nel; this is produced by the RTE-EDD algorithm which better describes the microphysical processes than the RTE-3DVAR one. Moreover, the RTE-3DVAR shows a generally sharper
distribution of TB than the SSM/I observations. Finally, a tendency to underestimate the TB values of the horizontal polarized channels and an overestimation of the vertical ones is found for RTE-EDD.
198 A. Memmo et al.: Evaluation of radiative transfer schemes for mesoscale model data assimilation It has to be noticed that these results suffers of several
limitations: 1) lack of observed microphysical particles (qw,
qi, qr, qs, or qg); 2) MM5 mesoscale forecast-model errors which do not allow to correctly reproduce the timing and the spatial distribution of the microphysical particles, which are key parameters for a good estimation of TB (Amerault and Zou, 2003); 3) 3DVAR intrinsic errors; 4) RTE model ap-proximations. All these errors are difficult to separate, this does not allow for a complete understanding of the previous findings.
Nevertheless, it has to remind that this work has been done on a one-day case study only. Therefore, even if a deeper analysis is necessary, the results are encouraging.
Acknowledgements. This work has been partially funded by INTERREG III-B CADSES project RiskAWARE and by the Region Abruzzo, Directorate of Civil Protection and Public Works.
Edited by: V. Kotroni and K. Lagouvardos Reviewed by: anonymous referee
References
Amerault, C. and Zou, X.: Preliminary steps in assimilating SSM/I brightness temperature in a hurricane prediction scheme, J. At-mos. Oce. Tech., 20, 1154–1169, 2003.
Barker, D. M., Huang, W., Guo, Y. R., Bourgeois, A., and Xiao, Q.: Three-Dimensional Variational Data Assimilation System for MM5: Implementation and initial results, Mon. Wea. Rev., 132, 897–914, 2004.
Bauer, P., Kahib, A.,Pokrovsy, A., Meneghini, R., Kummerow, C., Marzano, F. S., and Poires Baptista, J. P. V.: Combined cloud-microwave radiative transfer modelling of stratiform rainfall, J. Atmos. Sci., 57, 1082–1104, 2000.
Bauer, P., Mahfouf, J. F., Olson, W. S., Marzano, F. S., Di Michele, S., Tassa, A., and Mugnai, A.: Erron analysis in rainfall retrieval for variational data assimilation, Q. J. R. Meteorol. Soc., 128, 2129–2144, 2002.
Courtier, P., Anderson, E., Heckley, W., Pailleux, J., Vasiljeric, D., Hamrud, M., Hollingsworth, A., Rabier, F., and Fisher, M.: The ECMWF implementation of three-dimensional variational assimilation (3D-Var). I: Formulation., Q. J. R. Meteorol. Soc., 124, 1783–1807, 1998.
Gustafsson, N., Berre, L., Hornqvist, S., Huang, X. Y., Lind-skog, M., B.Navascue, Mogensen, K. S., and Thorsteinsson, S.: Three-dimensional variational data assimilation for a limited areamodel. Part I: General formulation and the background error constraint, Tellus, 53A, 425–446, 2001.
Di Michele, S., Tassa, A., Mugnai, A., Marzano, F. S., Bauer, P., and Poiares Baptista, J. P. V.: Bayesian Algorithm for Microwave-based Precipitation Retrieval: description and application to TMI measurements over ocean, IEEE Trans. Geosci. Rem. Sens., 43, 778–791, 2005.
Dudhia, J.: A nonhydrostatic version for the Penn-State-NCAR mesoscale model: Validation test and simulation of an Atlantic cyclone and cold front, Mon. Wea. Rev., 121, 1493–1513, 1993. Grell, G. A., Dudhia, J., and Stauffer, D. R.: A description of fifth-generation Penn State/NCAR mesoscale model (MM5), Nat. Center Atmos. Res., Boulder, CA, NCAR Tech. Note NCAR/TN-398+STR, 1994.
Hollinger, J., Peirce, J., and Poe, G.: SSM/I Instrument Evaluation, IEEE Trans. Geosci. Remote Sens., 28, 781–790, 1990. Kummerow, C., Hong, Y., Olson, W. S., Yang, S., Adler, F. R.,
Mc-Collum, J., Ferraro, R., Petty, G., Shin, D. B., Wilbeit, T. T.: The evolution of Goddard Profiling algorithm (GPROF) for rainfall estimation from passive microwave sensors, J. Appl. Meeteorol., 40, 1801–1820, 2001.
Liebe, H.: An updated model for millimeter wave propagation in moist air, Radio Sci., 20, 1069–1089, 1985.
Marshall, J. and Palmer, W.: The distribution of raindrops with size, J. Meteorol., 5, 165–166, 1948.
Marzano, F. S., Fionda, E., and Ciotti, P.: Simulation of radiometric and attenuation measurements along earth-satellite links in the 10 to 50 GHz band through horizontally-finite convective raincells, Radio Sci., 34, 841–858, 1999a.
Marzano, F. S., Mugnai, A., Panegrossi, G., Pierdicca, N., Smith, E. A., and Turk, J.: Bayesian estimation of precipitating cloud parameters from combined measurements of spaceborne mi-crowave radiometer and radar, IEEE Trans. Geosci. Remote Sens., 37, 596–613, 1999b.
Marzano, F. S., Fionda, E., Ciotti, P., and Martellucci, A.: Ground-based multi-frequency microwave radiometry for rainfall remote sensing, Trans. Geosci. Rem. Sens., 40, 742–759, 2002. Petty, G. W. and Katsaros, K. B.: The response of the Special
Sen-sor Microwave/Imager to the marine environment. Part I: An an-alytic model for the atmospheric component of observed bright-ness temperatures, J. Atmos. Ocean. Tech., 9, 746–761, 1992. Petty, G. W.: An intercomparison of oceanic precipitation
frequen-cies from 10 SSM/I rain rate algorithms and shipboard present-weather reports, J. Geophys. Res., 102, 1757–1777, 1997. Reisner, J., Rasmussen, R. J., and Bruintjes, R. T.: Explicit
fore-casting of supercooled liquid water in winter storms using the MM5 mesoscale model, Q. J. R. Meteorol. Soc., 124B, 1071– 1107, 1998.
Smith, E. A., Bauer, P., Marzano, F. S., Kummerow, C. D., McK-ague, D., Mugnai, A., and Panegrossi, G.: Intercomparison of microwave radiative transfer models for precipitating clouds, Trans. Geosci. Remote Sens., 40, 197–203 2002.
Tao, K.-W. and Simpson, J.: Goddard Cumulus Ensemble Model. Part I: Model Description, TAO, 4, 35–72, 1993.
Tassa, A., Di Michele, S., Mugnai, A., Marzano, F. S., and Poires Baptista, J. P. V.: Cloud model-based Bayesian technique for precipitation profiles retrieval from Tropical Rainfall Measuring Mission Microwave Imager, Radio Sci., 38, 4, pp. 8074, 2003. Ulaby, F. T., Moore, R. K., and Fung, A. K.: Microwave remote
sensing active and passive, in: Microwave Remote Sensing Fun-damentals and Radiometry, edited by: Reading, M. A., Addison Wensley, 1, 1981.