Productivity and water use efficiency of important crops in the Upper Oueme Catchment: influence of nutrient limitations,
nutrient balances and soil fertility.
I n a u g u r a l – D i s s e r t a t i o n zur Erlangung des Grades
Doktor der Agrarwissenschaft (Dr. agr.)
der
Hohen Landwirtschaftlichen Fakultät der
Rheinischen Friedrich – Wilhelms – Universität zu Bonn
vorgelegt im September 2005
von
Gustave Dieudonné DAGBENONBAKIN
Referent: Prof. Dr. H. Goldbach Korreferent: Prof. Dr. M.J.J. Janssens Tag der mündlichen Prüfung:
Dedication
This work is dedicated to:
Errol D. B. and Perla S. K. DAGBENONBAKIN, Yvonne DOSSOU-DAGBENONBAKIN,
Acknowledgements
The participation and contribution of individuals and institutions towards the completion of this thesis are greatly acknowledged and indebted.
Foremost my sincere appreciation and thankfulness are extended to my promoter Prof. Dr. Heiner Goldbach for providing professional advice, whose sensitivity, patience and fatherly nature have made the completion of this work possible, he always gave freely of his time and knowledge.
I would like to express my profound gratitude to Prof. Dr. Ir. Marc Janssens, for giving me the opportunity to pursue my PhD thesis in IMPETUS Project. His insights criticisms are very useful in improving this work.
I am grateful to Prof. Dr. H-W. Dehne for reading this thesis and accepting to be the chairman of my defense.
My sincere words of thanks are also directed to Prof. Dr. Karl Stahr of the Institute of Soil Science at the University of Hohenheim for giving me the opportunity to be enrolled as PhD student in his Institute.
I am grateful to Dr. Thomas Gaiser of the Institute of Soil Science at the University of Hohenheim for helping me for administrative formalities as far as my enrolment as PhD student at the University of Hohenheim was concerned, about the first discussion on the proposal, and for his valuable contributions. I am also indebted to PD Dr. Jürgen Burkhardt, who significantly helped me in getting started with my field work and who provided valuable advice. He always organized everything concerning my stay in Germany and helped for literature, corrected many papers presented in conferences.
I wish to express my warm appreciation to Mr. Valérien Agossou who gave freely of his time and shared knowledge and experience with me from the beginning to the end of this thesis.
A dept of gratitude is due to Dr. Anne Marie Matthess, Dr. Bernard Agbo, Dr. Mouinou Igué, and Dr. Anastase Azontondé for their help and support
My sincere thanks are also due to Dr. Romain Glele and Mr. Linssoussi Come for their help in statistical analysis.
My sincere thanks are also directed to Dr. David Arodokoun, Dr. Jean Detongnon, Dr. Delphin Koudandé, Dr. Mensah Guy Appolinaire, Prof. Dr.
Agbossou, Dr. Raphael Vlavonou, Dr. Hector Adegbidi, Dr. Pierre Akondé, Dr. Vincent Mama, Dr. Kuessi Ahiou, Mr. Toukourou, Mr Camille Bankolé Mr. Baco Nasser, Dr. Jean Adanguidi, Mrs. Conforte Mensah, Mr. and Mrs Adjikouin and Mr and Mrs Glèlè Melon for their help and support.
I wish to thank the late Francine Adjikouin for helping to the assessment of potential evapotranspiration in 2002 in Dogue, for her assistance and who joined the field research group after her Master‘s Thesis. May God continue to bless and honor her soul with more appointments in the service of God and Humanity.
My sincere thanks are also directed to Claude Kanninkpo, Mohamed Akadiri, Djakpa Ezeckiel, Chabi Ibrahim and Alexis Mayaba for their assistance to field research and data collection and their help.
The soil and plant samples were analyzed by the highly qualified technicians especially, Angelika Glogau, Angelika Veits, Deborah Rupprecht, Waltraud Köhler and Marcus Kiefer of the Institute of Plant Nutrition of the University of Bonn and those of ex Centre National d’Agro-Pédologie in Benin.
I am very grateful to the government of the people of the Federal Republic of Germany through German Ministry of Education and Science (BMBF) for financing this study and the authorities of Integratives Management Projekt für einen Effizienten und Tragfähigen Umgang mit Süßwasser (IMPETUS) especially Professor Dr. P. Speth, Dr. M. Christoph and Dr. E. van den Akker for giving me material and administrative supports during all phases of the present thesis.
My thanks are also due to my colleagues of IMPETUS particularly, Dr. V. Mulindabigwi, Dr, S. Giertz, Dr. H Bormann, Dr. T. Fass, Dr. M. Schopp, K. Hadjer, B. Orthmann, T. Klein and Dr. M. Doevenspeck, for sharing experiences in Benin and creating a nice work atmosphere.
Work at the Institute of Plant Nutrition was facilitated through the easy cooperation of Luc Sintondji, Mathias Nadohou, Vincent Orekan, Ali Kadanga, Deng Zhixin, Dr. I. Hartmann, Dr. Thomas Eichert, Franck Gressens, Waltraut Schäfer Dr. Jean Pierre Bognonkpe, Haben Asgedom, R. Fagbemissi, and my friend Bernd Heinz-Jürgen Kitterer.
My thanks also go to uncles Siméon and Thimothée Adjigbey, my sisters Colette and Véronique, my nephews Romaric and Erick for their help and support.
My deepest gratitude is due to my loving and dear wife Yvonne Dossou-Dagbenonbakin whose understanding, patience and sacrifice have greatly constituted to the successful completion of my doctoral studies. My son Errol and my daughter Perla who could not be with the father when need arose gave me the desire to go on and on.
Finally, many thanks to all of them for the support, but also to those who in one way or another provided help during the realization of my thesis.
Words are not enough to express my gratitude; only God knows how to reward each of you.
Abstract
Crop productivity and water use efficiency of important crops in the Upper Oueme Catchment: influence of nutrient limitations,
nutrient balances and soil fertility.
The Upper Oueme catchment in the West African subhumid zone is a region in Northern Benin, which actually experiences major changes in land use, water availability, and population density. In the context of the IMPETUS project, the present work aimed to i) identify nutrients which are limiting productivity on the basis of soil and plant analysis, ii) compare effects of fertilizer application nutrition to current farmer’s practice, iii) determine the water consumption per unit of biomass (maize) and per unit of area, and iv) assess (simplified) nutrient balances to predict long-term trends of nutrient availability and soil productivity. Field experiments were carried out in 2001 and 2002 using a randomized complete block design with four treatments, 2001: n = 80, 2002: n = 109) at three sites: Beterou, Dogue, and Wewe. Soils of the sites had low fertility and were PLENTOSOL and Ferric-Profondic LUVISOL in Beterou, PLENTOSOL and LIXISOL in Dogue and ACRISOL or Plenthic-LIXISOL in Wewe. Treatments were: T0: farmer’s practice or plots without mineral or organic fertilizer applied with exception of cotton, where farmers applied fertilizers as usual; T1M: 10 t ha-1crop residues; T1F: 10 t ha-1 of farmyard manure in 2001; T2: mineral fertilizer at the rates recommended; T3M: mineral fertilizer as applied in T2 + 10 t ha-1 of crop residues for mulch in 2001 and 2002, while for T3F mineral fertilizer was applied as in T2 + 10 t ha-1 of farmyard manure. Residual effects of manure application were evaluated without further OM application.
Soil samples were taken before and at the end of the experiment to appreciate the nutritional status of plots. Leaves were sampled at critical stages for plant for nutrient assessment through critical Value Method CVM and Diagnosis and Recommendation Integrated System (DRIS). Yield (DM) of all the crops, their total biomass and harvest index were evaluated at harvest. A partial nutrient
maize in Dogue in 2002. Rainfall during the crop growth was used to calculate rainfall use efficiency (RUE). Water or rainfall use efficiency was determined as the ratio between above ground biomass and rainfall for RUE or actual evapotranspiration for WUE.
Crop productivities were significantly affected by farmer’s practice and the type of organic matter applied. Organic or mineral fertilizer or the combination of both increased crop productivities, RUE and WUE of maize although a relatively high variability was observed between individual plots and farmers.
Nitrogen was the most limiting nutrient followed by potassium and phosphorous according to DRIS-Evaluation while the CVM method revealed most of the macronutrients as low or close to the critical level. However, only the nutritional imbalance index of maize decreased from 2001 to 2002. Standard nutrient levels and reasonable DRIS norms were established for N, P, K, Ca, Mg, S, Zn, Mn of maize, sorghum, cotton, yam and groundnut. They can be used to evaluate crop nutritional status, to correct nutritional imbalances and to improve crop productivities. They can also be used as a basis for calibrating the fertilization programs for these crops.
Negative nutrient balances were observed, as inputs of nutrients were insufficient to compensate outputs. The strategies to compensate the nutrient gap are to increase the recycling of residues, to increase the application of manure, or introduce fertilizers or a combination of all three.
Actual farmers' practices in maize, sorghum, groundnut and yam cropping systems lead to depletion in soil nutrient levels, as there is actually almost no return of nutrients to the fields and mineral fertilizer are only rarely applied. When calculating the balance for a typical yam-cotton-maize-groundnut-sorghum rotation, the nutrient balances are negative by 177 kg ha-1 N, 33 kg ha
-1 P and 163 kg ha-1 K. This leads to nutrient depletion (as actually found in the
project area) and not sustains adequate yields.
The only desirable scenario could be the practice of integrated soil fertility management where mineral and organic fertilizers are combined. Here, one should as well take into account crop rotations with legumes to optimize nitrogen fixation, mineral fertilizer, and efficient management of crop residues. Management methods that limit nutrient losses and increase water use
soil fertility and conversely to enhance crop production and in Upper Oueme Catchment.
Résumé
Productivité et utilisation efficiente de l’eau pour les principales cultures dans le Bassin Versant de l’Ouémé Supérieur : influence des limitations
de nutriments, du bilan des nutriments et de la fertilité des sols.
Le bassin versant de l’Ouémé supérieur, situé dans la région septentrionale du Bénin dans la zone subhumide de l’Afrique de l’Ouest, connaît actuellement des changements notables de densité de population et conséquemment d’utilisation des terres. Le présent travail s’inscrivant dans le cadre du Projet IMPETUS vise notamment à :i) identifier les nutriments limitant la production agricole sur la base des analyses de sol et de végétaux, ii) comparer les effets de l’application des engrais à la pratique paysanne actuelle, iii) déterminer la consommation de l’eau ou de la pluie par unité de biomasse et de surface et iv) estimer le bilan partiel des nutriments afin de prédire les tendances à long terme de la disponibilité des nutriments et la productivité des sols.
A cet effet, des essais en milieu paysan ont été conduits sur trois sites : Bétérou, Doguè et Wèwè en 2001 et 2002 avec pour plantes test le maïs, le sorgho, l’arachide, le coton et l’igname. Le dispositif expérimental était un bloc complètement aléatoire de 4 traitements, 80 paysans en 2001 et 109 en 2002. Chaque paysan constitue une répétitionLes sols utilisés avaient une faible fertilité étaient des PLENTOSOLS et Ferric-Profondic LUVISOLS à Bétérou, PLENTOSOLS et LIXISOLS à Doguè et ACRISOLS ou Plentic LIXISOLS à Wèwè. Les traitements étaient : T0 : pratique paysanne ou parcelle sans aucun apport de fumure organique et minérale (à l’exception du coton où les paysans appliquent habituellement des engrais), T1M : 10 t ha-1 de résidus de récolte, T1F : 10 t ha-1 of fumier, T2 : fumure minérale à la dose recommandée, T3M : fumure minérale appliquée en T2 + 10 t ha-1 de résidus de récolte en 2001 et en 2002, T3F : fumure minérale appliquée en T2 + 10 t ha-1 de fumier en 2001.
Des échantillons de sol ont été prélevés et analysés au début et à la fin des essais pour apprécier le niveau de fertilité des parcelles. Les échantillons de feuilles ont été prélevés à des stades critiques pour l’appréciation du statut nutritionnel selon la méthode des valeurs critiques (MVC) et le Système Intégré de Diagnostic et de Recommandations (SIDR). Les rendements (matière
été estimés à la récolte. Un bilan partiel des nutriments a été estimé en subdivisant les rendements en sous-groupes de rendements en faible et élevé. L’évapotranspiration actuelle a été estimée par gravimétrie, humidimétrie et tensiométrie pour l’utilisation efficace de l’eau (WUE) du maïs à Doguè en 2002. La précipitation durant la période de croissance végétative été utilisée pour estimer l’utilisation efficace de la pluie (RUE). L’utilisation efficace de l’eau et de la précipitation a été déterminée par la biomasse totale aérienne rapportée à la précipitation durant la croissance végétative (RUE) ou l’évapotranspiration actuelle (WUE).
Les productivités des cultures ont été significativement affectées par la pratique paysanne et le type de matière organique appliquée. Les productivités des cultures leur RUE et WUE du maïs ont été améliorées par l’application d’engrais organiques, minéraux ou la combinaison des deux types. Toutefois, une forte relative variabilité a été observée entre les champs paysans et les localités.
L’azote était l’élément le plus limitant de la production suivi du potassium et du phosphore selon le SIDR alors que la MVC a révélé la plupart des macronutriments en faibles teneurs ou à la limite des seuils critiques. Cependant, seul le déséquilibre nutritionnel du maïs a décru de 2001 à 2002. Des teneurs standard et des normes SIDR acceptables en N, P, K, Ca, Mg, S, Zn et Mn pour le maïs, le coton, l’arachide, le sorgho et l’igname ont été établies. Elles peuvent être utilisées pour évaluer le statut nutritionnel des cultures, corriger les déséquilibres nutritionnels et améliorer les productivités de ces cultures. Elles peuvent aussi servir de base pour la calibration des programmes de fertilisation des cultures.
Des bilans négatifs en nutriments ont été observés étant donné que les importations de nutriments sont insuffisantes et ne compensent pas les exportations. Les stratégies pour compenser le déficit en nutriment sont l’augmentation du recyclage des résidus de récolte, l’accroissement de l’application du fumier ou des engrais minéraux ou la combinaison des trois. La pratique paysanne actuelle conduit à un épuisement des sols en nutriments étant donné qu’aucune restitution des nutriments ne se fait et l’utilisation
En estimant le bilan des nutriments pour une rotation typique igname-coton-maïs-arachide-sorgho de 5 ans, les bilans négatifs de 177 kg N ha-1, 33 kg P ha-1, 163kg K ha-1 ont été obtenus. Ceci conduit à un épuisement en nutriment (comme c’est le cas dans la région du projet) et ne permet aucune stabilité des rendements.
Le seul scénario acceptable serait la pratique d’une gestion intégrée de la fertilité des sols où engrais minéral et organique sont combinés. Ici, la rotation des cultures avec les légumineuses pour optimiser la fixation de l’azote, l’utilisation des engrais minéraux, la gestion efficiente des résidus de récoltes seront prises en considération. Les méthodes de gestion qui limitent les pertes en nutriments et augmentent l’utilisation efficace de l’eau sont quelques approches qui peuvent être utilisées pour améliorer, maintenir la fertilité des sols et réciproquement accroître la production dans le bassin versant de l’Ouémé supérieur.
Zusammenfassung
Produktivität und Wassernutzungseffizienz wichtiger Kulterpflanzen im oberen Ouémé-Einzugsgebiet, Benin: Nährstoffmängel, Nährstoffbilanzen,
Bodenfruchtbarkeit.
Das im subhumiden Westafrika gelegene obere Einzugsgebiet des Ouémé in Nordbenin unterliegt gegenwärtig starken Veränderungen der Landnutzung, der Wasserverfügbarkeit und der Bevölkerungsdichte. Ziele der vorliegenden Arbeit im Rahmen des IMPETUS-Projektes sind (i) die Identifizierung limitierender Nährstoffe für die pflanzliche Produktivität mit Hilfe von Boden- und Pflanzenanalysen, (ii) der Vergleich der Erträge bei aktueller Bewirtschaftung und bei veränderter Düngung (iii) die Bestimmung des Wasserverbrauchs bezogen auf die Biomasse (Mais) und auf die Fläche, (iv) die Erstellung (einfacher) Nährstoffbilanzen zur Vorhersage langfristiger Entwicklungen der Nährstoffverfügbarkeit und der Bodenproduktivität.
In den Jahren 2001 und 2002 wurden an den drei Standorten Beterou, Dogue und Wewe vollständig randomisierte Feldversuche mit vier Behandlungsvarianten durchgeführt (2001: n= 80, 2002: n=109). Alle Böden waren nährstoffarm (Plentosol und eisenreicher Luvisol in Beterou, Plentosol und Lixisol in Dogue, Acrisol bzw. Plenthic-Lixisol in Wewe). Die Behandlungen waren: T0: aktuelle Bewirtschaftung, d.h. Mineraldüngereinsatz bei Baumwolle, andere Kulturen ohne Verwendung jeglichen Düngers; T1M: 10 t ha-1 Pflanzenrückstände; T1F: 10 t ha-1 Stalldünger; T2: Mineraldünger nach Düngungsempfehlung; T3M: Mineraldünger wie in T2 + 10 t ha-1 Pflanzenrückstände als Mulch in 2001 und 2002, T3F: Mineraldünger wie in T2 + 10 t ha-1 Stalldünger. Residualeffekte der Stalldüngeranwendung wurden ohne weitere Verwendung organischen Düngers untersucht.
Die Nährstoffausstattung der Versuchsflächen vor Beginn und nach Ende des Experiments wurde anhand von Bodenanalysen untersucht. Die während wichtiger Phasen der Pflanzenentwicklung genommenen Blattproben wurden anhand der CVM- (Critical Value Method) und der DRIS-(Diagnosis and
bestimmt. Für je eine Hochertrags- und Niedrigertragsfläche wurde eine Teilnährstoffbilanz anhand von Gewebe- und Produktanalyse berechnet.
Zur Bestimmung der Wassernutzungseffizienz von Mais wurde die aktuelle Evapotranspiration mittels Gravimetrie, Humidimetrie und Tensiometrie in Dogue 2002 abgeschätzt. Mit Hilfe der Niederschläge wurde die Regennutzungseffizienz (RUE) berechnet. Wasser- bzw. Regennutzungseffizienz wurden dabei bestimmt als das Verhältnis zwischen oberirdischer Biomasse und der Regenmenge bzw. der aktuellen Evapotranspiration.
Die Produktivität der einzelnen Kulturen wurde signifikant durch die Art der Düngung und die Art des organischen Düngers beeinflusst. Erträge, RUE und WUE wuchsen durch organische Düngung und Mineraldüngung, allein oder in Kombination. Dabei war jeweils eine starke Variabilität zwischen den einzelnen Versuchsflächen und den Landwirten zu beobachten.
Stickstoff, Kalium und Phosphor waren in dieser Reihenfolge die am meisten limitierenden Faktoren entsprechend der DRIS-Bewertung. Nach der CVM Methode waren die meisten der Makronährstoffe als gering oder zumindest nahe der kritischen Grenze zu bewerten. Allerdings nahm der Ernährungs-Ungleichgewichts-Index von 2001 nach 2002 nur für Mais ab. Eine Standard-Nährstoffversorgung und entsprechende DRIS-Werte für N, P, K, Ca, Mg, S, Zn, Mn und Mais, Sorghum, Baumwolle, Yams und Erdnuss wurde festgelegt. Diese Werte können zur Bewertung des Ernährungszustands, zur Korrektur von Ernährungsungleichgewichten und zur Verbesserung der Erträge verwendet werden. Sie eignen sich außerdem als Basis zur Kalibrierung von Düngungsprogrammen dieser Kulturen, die nachträglich validiert werden sollten.
Da die Einbringung von Nährstoffen häufig nicht ausreichte die Entnahme zu kompensieren, traten negative Nährstoffbilanzen auf. Strategien zur Vermeidung dieser Nährstofflücke bauen auf einer verstärkten Wiederausbringung von Pflanzenresten, der verstärkten Anwendung von Stalldünger, dem Einsatz von Mineraldünger bzw. Kombinationen dieser Möglichkeiten auf.
gegenwärtige landwirtschaftliche Praxis in den Anbausystemen von Mais, Sorghum, Erdnuss und Yams zu einer kontinuierlichen Abnahme der Bodennährstoffe.
Die Berechnung der Nährstoffbilanz in einer typischen Fruchtfolge aus Yams, Baumwolle, Mais, Erdnuss, Sorghum ergab Nährstoffverluste von 177 kg ha-1 N, 33 kg ha-1 P und 163 kg ha-1 K. Dies führt zu der im Untersuchungsgebiet beobachteten Nährstoffverarmung und zu abnehmenden Erträgen.
Das einzig wünschenswerte Szenario wäre ein integriertes Bodenfruchtbarkeits-Management durch Kombination mineralischer und organischer Dünger. Dabei sollten sowohl Fruchtfolgen mit Leguminosen zur Optimierung der Stickstoffbindung, als auch der Einsatz von Mineraldünger und ein effektives Management der Pflanzenrückstände Eingang finden. Managementmethoden zur Begrenzung von Nährstoffverlusten und Verbesserung der Wassernutzungseffizienz sind mögliche Ansätze zur Erhaltung der Bodenfruchtbarkeit und der Verbesserung der Erträge im oberen Ouémé-Einzugsgebiet.
Table of contents Dedication ...ii Acknowledgements... iii Abstract...vi Résumé...ix Zusammenfassung ... xii Table of contents ...xv
List of figures... xviii
List of tables... xxi
List of appendices ... xxv
Abbreviations ... xxvii
1. General Introduction... 1
1.1. Constraints for Sustainable Agricultural Production in the Project Area .. 1
1.1.1. Natural Fallow ... 2
1.1.2. Mulching... 3
1.1.3. Supply of Organic Matter ... 4
1.2. Nutrient Assessment ... 7
1.2.1. Critical Value Method or Critical Nutrient Level... 8
1.2.2. Diagnosis Recommendation and Integrated System (DRIS) ... 10
1.3. Objectives of the Study and Working Hypotheses... 15
1.3.1. Objectives of Sub-Project A3 ... 15
1.3.2. Research Objectives ... 16
1.3.3. Working Hypotheses ... 16
2. Materials and Methods... 18
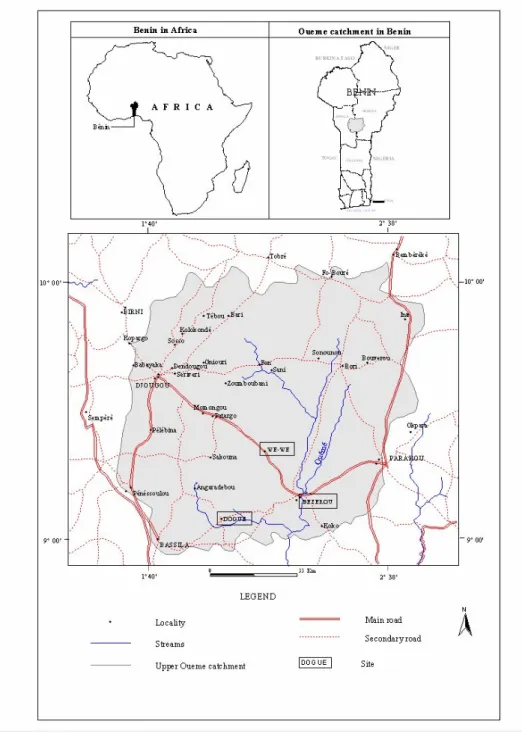
2.1. Site Description ... 18
2.1.1. Location ... 18
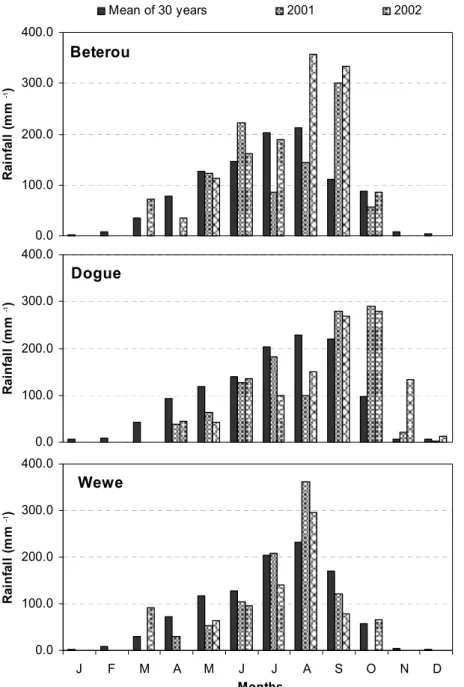
2.1.2. Climate... 20
2.1.3. Soil Characterization at the Different Sites... 21
2.1.4. Crop Varieties ... 23
2.2. Treatments and Field Layout ... 23
2.3. Field Management and Observations... 25
2.3.1. Soil and Plant Analysis... 30
2.3.1.3. Diagnosis and Recommendation Integrated system (DRIS)
Methodology... 33
2.3.1.4. Nutrient balance ... 34
2.3.1.6. Water consumption... 36
3. Results and Discussion... 41
3.1. Effect of Fertilizer Application on Crop Productivity and Rainfall or Water Use Efficiency... 41
3.1.1. Maize Productivity ... 41
3.1.1.1. Grain and total biomass of maize ... 41
3.1.1.2. Rainfall use efficiency and water use efficiency of maize ... 46
3.1.2. Cotton Productivity ... 50
3.1.2.1. Cotton seed, lint and yield ... 50
3.1.2.2. Total biomass ... 54
3.1.2.3. Rainfall use efficiency and harvest index... 59
3.1.3. Groundnut ... 59
3.1.3.1. Grain... 59
3.1.3.2. Total biomass and RUE... 65
3.1.4. Sorghum ... 67
3.1.4.1. Grain, panicle and total biomass ... 67
3.1.5. Yam... 75
3.1.5.1. Fresh, dry matter of tuber and total biomass of yam crop ... 75
3.2. Plant Nutritional Assessment... 82
3.2.1. Maize Nutritional Assessment... 83
3.2.1.1 Nutrient status assessment using Critical Value Method (CVM) for maize... 83
3.2.1.2. Nutrient status assessment using Diagnosis and Integrated System (DRIS) for maize... 85
3.2.2. Cotton Nutritional Assessment... 94
3.2.2.1. Nutrient status assessment using Critical Value Method (CVM) for cotton ... 95
3.2.2.2. Nutrient status assessment using Diagnosis Regulated Integrated System (DRIS) for cotton... 96
3.2.3.1. Nutrient status assessment using Critical Value Method (CVM)
for groundnut ... 100
3.2.3.2. Nutrient status assessment using Diagnosis Regulated Integrated System (DRIS) for groundnut ... 101
3.3.4. Sorghum Nutritional Assessment ... 105
3.3.4.1. Nutrient status assessment using Critical Value Method (CVM) for sorghum ... 105
3.3.4.2. Nutrient status assessment using Diagnosis Regulated Integrated System (DRIS) for sorghum ... 107
3.2.5. Yam Nutritional Assessment ... 110
3.2.5.1. Nutrient status assessment using Critical Value Method (CVM) for yam ... 111
3.2.5.2. Nutrient status assessment using Diagnosis Regulated Integrated System (DRIS) for yam ... 112
3.3. Assessment of simplified nutrient balance... 116
3.3.1. Nutrient balance of cotton ... 116
3.3.2. Nutrient balances for maize ... 119
3.3.4. Nutrient balance of Yam... 125
3.3.5. Nutrient balance of sorghum ... 128
4. General discussion and conclusions ... 131
4.1. General discussion ... 131
4.1.1. Effect of fertilizer application on crop productivity and water use efficiency ... 131
4.1.2. Plant nutritional assessment ... 135
4.1.3. Assessment of simplified nutrient balances ... 139
4.2. Conclusions and recommendations... 143
5. References... 146
Appendices ... 166
List of figures
Figure 1 Map: Location of the project area Upper Ouémé Catchment ... 18 Figure 2: Map of the distribution of the field plots at the three sites ... 19 Figure 3: Comparison of annual average rainfall from 1971 to 2000, 2001 and
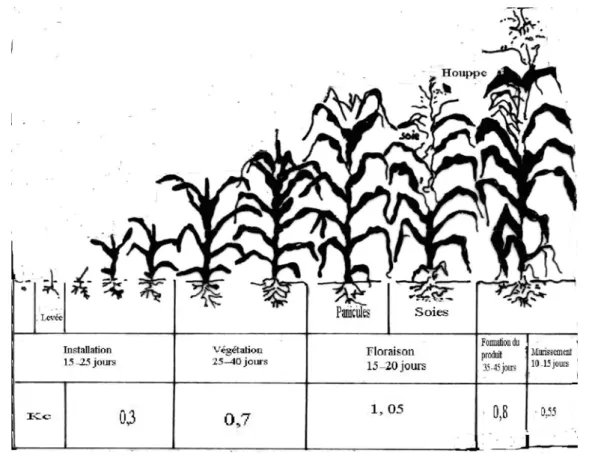
2002 ... 20 Figure 4: Growth period of maize (according to Hanway, 1966) ... 39 Figure 5: Grains and total biomass of maize (Zea mays) as affected by organic and inorganic fertilizer application compared to farmer’s practice at three locations in Upper Oueme catchment of Benin in 2001 ... 42 Figure 6: Grains and total biomass index of maize (Zea mays) as affected by
organic and inorganic fertilizer application compared to farmer’s practice at three locations in Upper Oueme catchment of Benin in 2002 ... 43 Figure 7: RUE and harvest index of maize (Zea mays) as affected by organic
and inorganic fertilizer application compared to farmer’s practice at three locations in Upper Oueme catchment of Benin in 2001 ... 47 Figure 8: RUE and harvest index of maize (Zea mays) as affected by organic
and inorganic fertilizer application compared to farmer’s practice at three locations in Upper Oueme catchment of Benin in 2002 ... 48 Figure 9: Water use efficiency of maize (Zea mays) as affected by organic and
inorganic fertilizer application compared to farmer’s practice at Dogue in Upper Oueme catchment of Benin in 2002 ... 49 Figure 10: Seed and lint yields of cotton as affected by organic and inorganic
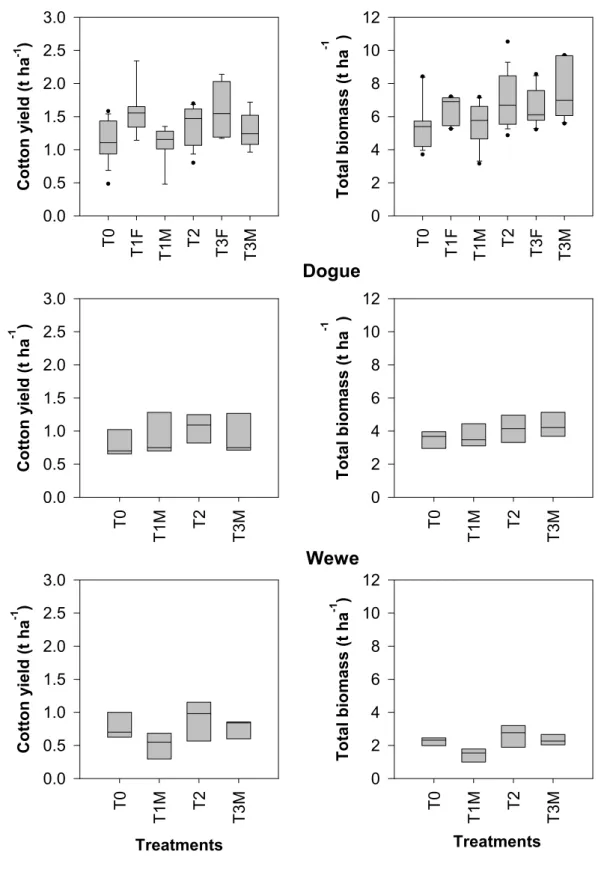
fertilizer application compared to farmer’s practice at three locations in Upper Oueme catchment of Benin in 2001 ... 52 Figure 11: Cotton yield and total biomass as affected by organic and inorganic
fertilizer application compared to farmer’s practice at three locations in Upper Oueme catchment of Benin in 2001 ... 56 Figure 12: Rainfall use efficiency and harvest index of cotton as affected by
organic and inorganic fertilizer application compared to farmer’s practice at three locations in Upper Oueme catchment of Benin in
Figure 13: Some parameters of cotton as affected by organic and inorganic fertilizer application compared to farmer’s practice at Beterou in 2002.
... 58 Figure 14: Grains and total biomass of groundnut (Arachis hypogea) as affected by organic and inorganic fertilizer application compared to farmer’s practice at three locations in Upper Oueme catchment of Benin in 2001. ... 60 Figure 15: Grains and total biomass of groundnut (Arachis hypogea) as affected by organic and inorganic fertilizer application compared to farmer’s practice at three locations in Upper Oueme catchment of Benin (on-farm experiment, 2002). ... 61 Figure 16: Rainfall use efficiency and harvest index of groundnut (Arachis
hypogea) as affected by organic and inorganic fertilizer application compared to farmer’s practice at three locations in Upper Oueme catchment of Benin (on-farm experiment, 2001). ... 63 Figure 17: Rainfall use efficiency of groundnut (Arachis hypogea) as affected by organic and inorganic fertilizer application compared to farmer’s practice at three locations in Upper Oueme catchment of Benin (on-farm experiment, 2002). ... 64 Figure 18: Grain, panicle and total biomass yields of sorghum as affected by
organic and inorganic fertilizer application compared to farmer’s practice at three locations in Upper Oueme catchment of Benin (on-farm experiment, 2001). ... 68 Figure 19: Grain and panicle yields of sorghum as affected by organic and
inorganic fertilizer application compared to farmer’s practice at three locations in Upper Oueme catchment of Benin (on-farm experiment, 2002)... 69 Figure 20: Rainfall use efficiency and harvest index of sorghum as affected by organic and inorganic fertilizer application compared to farmer’s practice at three locations in Upper Oueme catchment of Benin (on-farm experiment, 2001). ... 70 Figure 21: Rainfall use efficiency (RUE) and total biomass of sorghum as
farmer’s practice at three locations in Upper Oueme catchment of Benin (on-farm experiment, 2002)... 71 Figure 22: Harvest index of sorghum as affected by organic and inorganic
fertilizer application compared to farmer’s practice at three locations in Upper Oueme catchment of Benin (on-farm experiment, 2002)... 74 Figure 23: Tuber (Fresh and dry matter) of yam Dioscorea rotundata as affected by organic and inorganic fertilizer application compared to farmer’s practice at three locations in Upper Oueme catchment of Benin (on-farm experiment, 2001). ... 76 Figure 24: Tuber (Fresh and dry matter) of yam Dioscorea rotundata as affected by organic and inorganic fertilizer application compared to farmer’s practice at three locations in Upper Oueme catchment of Benin (on-farm experiment, 2002). ... 77 Figure 25: Rainfall use efficiency (RUE) and total biomass of yam Dioscorea
rotundata as affected by organic and inorganic fertilizer application
compared to farmer’s practice at three locations in Upper Oueme catchment of Benin (on-farm experiment, 2001). ... 80 Figure 26: Rainfall use efficiency (RUE) and total biomass of yam Dioscorea
rotundata as affected by organic and inorganic fertilizer application
compared to farmer’s practice at three locations in Upper Oueme catchment of Benin (on-farm experiment, 2002). ... 81 Figure 27: DRIS indices for maize in farming system in Upper Oueme
catchment of Benin (on-farm experiment, 2001-2002). ... 93 Figure 28: DRIS indices for cotton in farming system in Upper Oueme
catchment of Benin (on-farm experiment, 2001). ... 99 Figure 29: DRIS indices for groundnut in farming system in Upper Oueme
catchment of Benin (on-farm experiment, 2001-2002). ... 102 Figure 30: DRIS indices for sorghum in farming system in Upper Oueme
catchment of Benin (on-farm experiment, 2001-2002). ... 110 Figure 31: DRIS indices for yam in farming system in Upper Oueme catchment
List of tables
Table 1: Overview of soil characteristics (plough layer: 0 – 20 cm) at the beginning of the experiment (in parenthesis) Standard deviation... 22 Table 2: Mineral fertilizer application rates (kg·ha-1) used in the experiment.... 24 Table 3: Average composition of manure (DM) applied on the three different
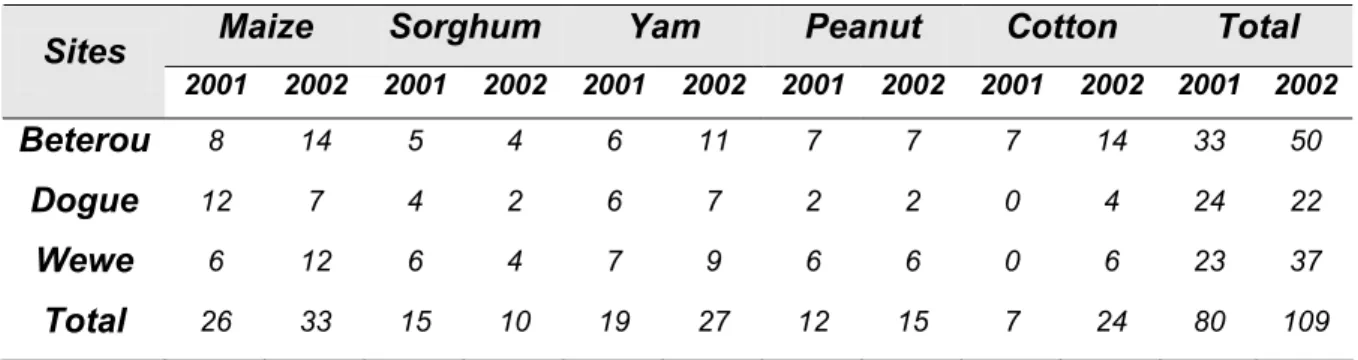
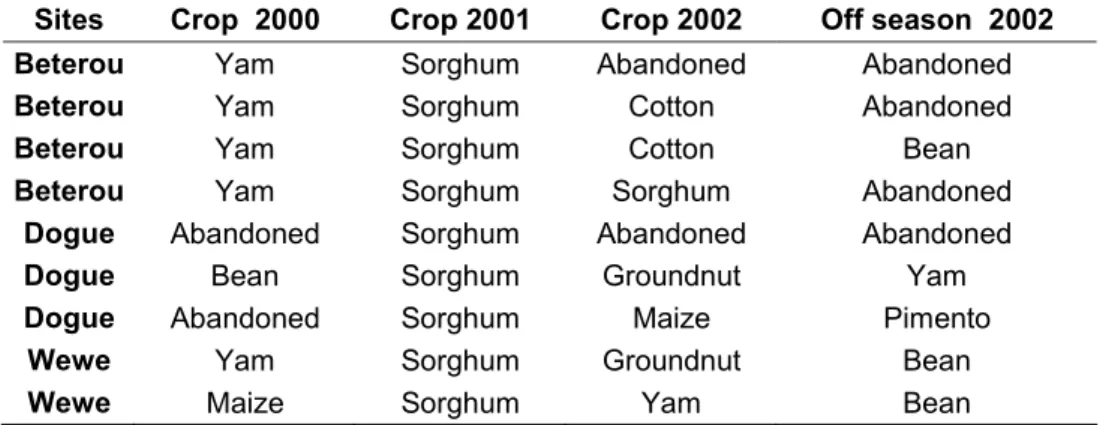
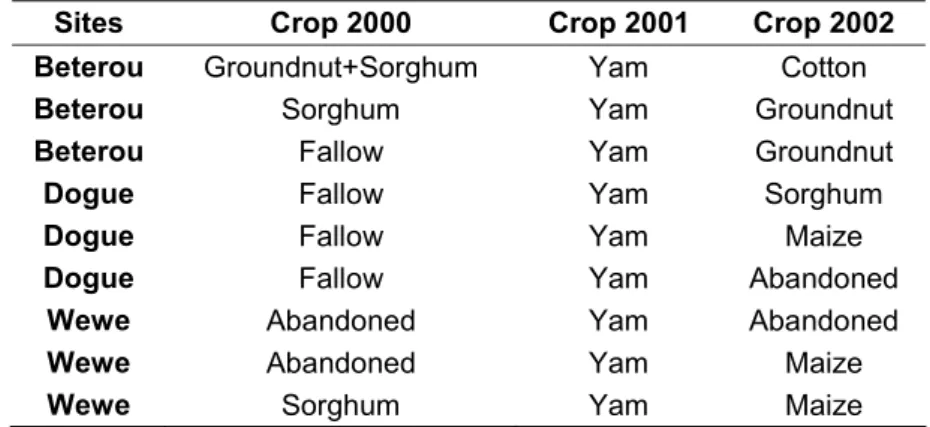
sites in 2001. ... 24 Table 4: Number of farmers involved in the fertilizer trials in 2001 and 2002 at the three sites... 25 Table 5: Cropping sequence with cotton (Gossypium hirsutum L) as crop in
2001 ... 26 Table 6: Cropping sequence with sorghum (Sorghum bicolor L) as crop in 2001
... 26 Table 7: Cropping sequence with maize (Zea mays) as crop in 2001... 27 Table 8: Cropping sequence with yam (Dioscorea rotundata) as crop in 2001 28 Table 9: Cropping sequence with (Arachis hypogea L) as crop in 2001 ... 28 Table 10: Sampling scheme for plant parts and growth stage for critical values and DRIS evaluation ... 29 Table 11: Soil description according to French Classification and WRB
Classification ... 31 Table 12 Fraction (p) of plant available soil water in drying soils as related to the maximum evapo-transpiration (ETM) for maize according to FAO (1987)... 37 Table 13: Maize yields, harvest index and RUE for the treatments relative (%) to farmers practice (=T0) at three sites of Upper Oueme Catchment. In bold: highest and lowest values, resp. Ic= confidence interval... 45 Table 14: Cotton grain, lint yields, harvest index and RUE for the treatments
relative (%) to farmers practice (=T0) at three sites of Upper Oueme Catchment. In bold: highest and lowest values, resp. Ic= confidence interval ... 55 Table 15: Groundnut yields, harvest index and RUE for the treatments relative
(%) to farmers practice (=T0). In bold: highest and lowest values, resp. Ic= confidence interval ... 62
Table 16: Sorghum yields, harvest index and RUE for the treatments relative (%) to farmers practice (=T0). In bold: highest and lowest values, resp. Ic= confidence interval ... 72 Table 17: Yam yields, harvest index and RUE for the treatments relative (%) to
farmers practice (=T0) at three sites of Upper Oueme Catchment. In bold: highest and lowest values, resp. Ic= confidence interval... 79 Table 18: Means, coefficient of variation (CV) and variance (VAR) of nutrient
contents of leaves of Maize for the low- and high-yielding sub-populations of Maize grain in 2001... 84 Table 19: Means, coefficient of variation (CV) and variance (VAR) of nutrient
contents of leaves of Maize for the low- and high-yielding sub-populations of Maize grain in 2002 in comparison to published critical levels... 84 Table 20: Mean, coefficient of variation (CV) and variance (VAR) of ratio for
pairs of nutrient of low- and high-yielding sub-populations of maize in 2001, ratio of variance and selected ratio between a pair of ratio of nutrient. ... 86 Table 21: Mean, coefficient of variation (CV) and variance (VAR) of ratio for
pairs of nutrient of low- and high-yielding sub-populations of maize in 2002, ratio of variance and selected ratio between a pair of ratio of nutrient. ... 87 Table 22: Mean of DRIS Norms of high- yielding sub-population to reference
values of different authors 2001. ... 91 Table 23: Mean of DRIS Norms of high- yielding sub-population to reference
values of different authors 2002 ... 92 Table 24: Means, coefficient of variation (CV) and variance (VAR) of nutrient
contents of leaves of cotton for the low- and high-yielding sub-populations of cotton seed and published critical levels... 96 Table 25: Mean, coefficient of variation (CV) and variance (VAR) of ratio for
pairs of nutrient of low- and high-yielding sub-populations of cotton, ratio of variance and selected ratio between a pair of ratio of nutrient.
Table 26: Means, coefficient of variation (CV) and variance (VAR) of nutrient contents of leaves of groundnut for the low- and high-yielding sub-populations of grain of groundnut in 2001 ... 100 Table 27: Means, coefficient of variation (CV) and variance (VAR) of nutrient
contents of leaves of groundnut for the low- and high-yielding sub-populations of grain of groundnut in 2002 and published critical levels ... 101 Table 28: Mean, coefficient of variation (CV) and variance (VAR) of ratio for
pairs of nutrient of low- and high-yielding sub-populations of groundnut in 2001, ratio of variance and selected ratio between a pair of ratio of nutrient. ... 103 Table 29: Mean, coefficient of variation (CV) and variance (VAR) of ratio for
pairs of nutrient of low- and high-yielding sub-populations of groundnut 2002, ratio of variance and selected ratio between a pair of ratio of nutrient. ... 103 Table 30: Mean, coefficient of variation (CV), variance (VAR) and ratio of
variance of nutrient contents of sorghum leaves for the low- and high-yielding sub-populations of sorghum grain in 2001 ... 106 Table 31: Mean, coefficient of variation (CV), variance (VAR) and ratio of
variance of nutrient contents of sorghum leaves for the low- and high-yielding sub-populations of sorghum grain in 2002 and published critical levels... 106 Table 32: Mean, coefficient of variation (CV) and variance of ratio (VAR) for
pairs of nutrient of low- and high-yielding sub-populations of sorghum in 2001, ratio of variance and selected ratios... 108 Table 33: Mean, coefficient of variation (CV) and variance (VAR) of ratio for
pairs of nutrient of low- and high-yielding sub-populations of sorghum in 2002, ratio of variance and selected ratios... 109 Table 34: Mean, coefficient of variation (CV), variance (VAR) and ratio of
variance of nutrient contents of leaves of yam for the low and high yielding sub-populations of tuber of yam in 2001 ... 111 Table 35: Mean, coefficient of variation (CV), variance (VAR) and ratio of
yielding sub-populations of tuber of yam in 2002 and published critical levels... 112 Table 36: Mean, coefficient of variation (CV) and variance (VAR) of ratio f pairs of nutrient of low- and high-yielding sub-populations of yam in 2001, ratio of variance and selected ratio between a pair of ratio of nutrient.
... 113 Table 37: Mean, coefficient of variation (CV) and variance (VAR) of ratio, for
pairs of nutrient of low- and high-yielding sub-populations of yam in 2002, ratio of variance and selected ratio between a pair of ratio of nutrient. ... 114 Table 38: Nutrient (N, P, K) balances of farming systems for low and high
yielding subpopulations of cotton in Upper Oueme catchment of Benin (on-farm experiment, 2001)... 118 Table 39: Average nutrient (N, P, K) balances of farming systems for low and
high yielding subpopulations of maize in Upper Oueme catchment of Benin (on-farm experiment, 2001 and 2002)... 122 Table 40: Average nutrient (N, P, K) balances of farming systems for low and
high yielding subpopulations of groundnut in Upper Oueme catchment of Benin (on-farm experiment, average of 2001-2002)... 124 Table 41: Average nutrient (N, P, K) balances of farming systems for low and
high yielding subpopulations of yam in Upper Oueme catchment of Benin (on-farm experiment, 2001 and 2002)... 127 Table 42: Average nutrient (N, P, K) balances of farming systems for low and
high yielding subpopulations of sorghum in Upper Oueme catchment of Benin (on-farm experiment, 2001 and 2002)... 129 Table 43: Grouping of nutrient contents in the leaves according to CVM from
literature data of the crops sampled for nutrient assessment... 137 Table 44: N, P, K, Ca, Mg, S, Zn and Mn Indices, Nutrient Balance Index and
Order of Nutrient Requirement Diagnosis and Recommended Integrated System Norms for all crops in 2001 and 2002 ... 138 Table 45: Soil chemical properties at the end of experiment (2002) ... 140 Table 46: Average nutrients (N, P, K) balance of farming system as affected by
List of appendices
Appendix 1: Chemical characteristics of lighter soil (plough layer 0 - 20) at the beginning (2001) and the end (2002) of experiment in Beterou. In parenthesis: standard deviation ... 166 Appendix 2: Chemical characteristics of heavier soil (plough layer 0 - 20) at the
beginning (2001) and the end (2002) of experiment in Beterou. In parenthesis: standard deviation ... 167 Appendix 3: Chemical characteristics of lighter soil (plough layer 0 - 20) at the
beginning (2001) and the end (2002) of experiment in Dogue. In
parenthesis: standard deviation ... 168 Appendix 4: Chemical characteristics of heavier soil (plough layer 0 - 20) at the
beginning (2001) and the end (2002) of experiment in Dogue. In
parenthesis: standard deviation ... 169 Appendix 5: Chemical characteristics of lighter soil (plough layer 0 - 20) at the
beginning (2001) and the end (2002) of experiment in Wewe. In
parenthesis: standard deviation ... 170 Appendix 6: Chemical characteristics of heavier soil (plough layer 0 - 20) at the
beginning (2001) and the end (2002) of experiment in Wewe. In
parenthesis: standard deviation ... 171 Appendix 7: Composition of the individual lots of manure used in 2001 ... 172 Appendix 8: Nutrient content in cotton at the harvest in 2001 (SD): Standard
deviation... 173 Appendix 9: Nutrient content in maize at the harvest in 2001 and 2002 (SD):
Standard deviation ... 174 Appendix 10: Nutrient content in groundnut at the harvest in 2001 and 2002
(SD): Standard deviation... 175 Appendix 11: Nutrient content in yam at the harvest in 2001 and 2002 (SD):
Standard deviation ... 176 Appendix 12: Nutrient content in sorghum at the harvest in 2001 and 2002 (SD): Standard deviation ... 177 Appendix 13: Input and output of cotton at the harvest (2001)... 178 Appendix 14: Input and output of maize at the harvest (2001-2002)... 179
Appendix 16: Input and output of yam at the harvest (2001-2002)... 181 Appendix 17: Input and output of sorghum at the harvest (2001-2002) ... 182
Abbreviations
ANOVA Analysis of variance
BMBF German Ministry of Education and Science BNF Biological Nitrogen fixation
CRA-CF Centre de Recherches Agricoles – Coton et Fibres DM Dry matter
DRIS Diagnosis and Recommendation Integrated system FM Fresh matter
FYM Farmyard manure
GLOWA Global Change in the Hydrological Cycle ha Hectare
IMPETUS Integratives Management-Projekt für eine Effizienten und Tragfähigen Umgang mit Süßwasser in Westafrika
INRAB Institut National des Recherches Agricoles du Bénin IPGRI International Plant Genetic Resources Institute IPCC Intergovernmental Panel on Climate Change kg Kilogram
LS Loam Sandy
M-DRIS Modified Diagnosis and Recommendation Integrated System OM Organic matter
p = 0 Probability at a level equal to 0
p ≤0 Probability at a level equal or lower than 0
PN2 Proportion of N in groundnut derived from N2 fixation
SL Sandy Loam
t Ton (equal to 1000 kg) * Level of significance 10 % ** Level of significance 5 % *** Level of significance 1 %
1. General Introduction
Sustainable management of natural resources is a pre-requisite for the continuing existence of mankind in the future. Water is considered as one of the most limiting of these natural resources in many parts of the world (Bonkoungou, 1996; Gamini et al., 2003). As there is still a growing world population, this resource will become increasingly threatened, while the demand for food production will increase. Additionally, dramatic climatic changes are expected to influence the global water cycle in the near future (IPCC, 2001; Bonkoungou, 1996), which may cause additional problems in the management of this scarce resource. This was the motivation for the German Ministry of Education and Science (BMBF) to initiate a program on the changes expected in the global water cycle (GLOWA). Under this program, the project IMPETUS is a joint activity of the Universities of Cologne and Bonn to study the management of water resources in the Oued Drâa, South of Morocco, and the Ouémé Superieur, North of Bénin, and to develop scenarios how upcoming problems may be solved in the near future, resulting in a sustainable use of the scarce resource “water”.
As agricultural production depends on adequate water supply, and on the other hand may pose an additional threat on water resources in terms of quality and quantity, it has to be optimized, increasing the water use efficiency (WUE) of crop production, and minimizing contamination to surface and ground water. A proper soil management is thus imperative for both, sustainable agricultural production as well as for a sustainable water use. Within this context, the following study was undertaken to evaluate the actual nutrient status of important crops and solids in the project area “Ouémé Superieur”, possibilities to improve productivity without increasing the area for crop production and to optimize WUE of crop production by organic and inorganic fertilizers.
1.1. Constraints for Sustainable Agricultural Production in the
Project Area
animal, human health. According to David et al. (1996), history has repeatedly shown that mismanagement of the soil resource base can lead to poverty, malnutrition, and economic disaster.
Many nations have sought conservation policies to protect the soil resource base, to safeguard and to preserve the food resource base, and to maintain air and water quality; however, soil resources continue to be degraded both nationally and globally through salinization, erosion, loss of tilth and biological activity, and build up of toxic compounds (David et al., 1996). Unfortunately, one distinctive characteristic of forests in the humid tropics is that the soils and their parent materials have been subjected to intensive weathering and leaching (Agboola and Unamma, 1991). The weathering process has resulted in a high proportion of kaolinitic clays, with a cation exchange capacity of 3-15 cmol kg-1 of soil. Under these conditions, cations from fertilizers are leached from the soil and quickly become unavailable to crops. The continually warm temperature and cycles of alternate wetting and drying in the lowland tropics are the major driving forces which accelerate the weathering of primary soil minerals and consequently the formation of the ultimate weathering products: iron and aluminum oxides and hydrous oxides, which strongly adsorb phosphate and molybdate, rendering it largely unavailable to many crops (Mekenzie, 1983; Goldberg et al., 1996).
Formerly, traditional farming systems involving land rotation were able to maintain soil organic matter at a safe level by returning the land to fallow for extended periods. There are different ways of keeping tropical soils fertile. These include traditional and modern systems as outlined below.
1.1.1. Natural Fallow
The most common way of keeping tropical soils fertile is by fallowing. During the fallow period, the soil accumulates organic matter. Organic matter is very important in traditional farming practices as loss in soil organic matter causes deterioration of soil structure, resulting in soil compaction, low water and nutrient retention capacity, low infiltration rate and accelerated runoff and erosion declining soil productivity.
logging and poor aeration during periods of frequent rain as a result of low infiltration rate. Besides creating soil water imbalance, reduction in soil organic matter content leads to nutrients imbalance resulting in poor growth and very low yield (Agboola and Odeyime, 1972; Lal and Kang, 1982).
According to these authors, land rotation based on the fallowing is a system in which successive crops are interspersed with several years of fallowing which the land reverts temporarily to bush or forest. This reversion allows accumulation of vegetative matter, which restores the nutrients to the edaphic complex through litter fall, precipitation, nitrogen fixation and root decomposition. In turn, the process makes possible the regeneration of biomass, (total mass of living matter of the soil, both plants and animals which crops become a useful part) hence a change in physical, chemical and biological aspect of the soil. At the onset of fallow, various forms of weeds (annuals, ephemerals and semi-annuals) are the first colonizers.
1.1.2. Mulching
Mulching is a practice where the soil is covered through extended periods with either dead material or living plants of prostrate growth (“green mulch”). The advantages of living mulch could be that under the traditional farming system practice, a ground cover of living plants is always maintained (Agboola et al., 1991). The plants include creeping cowpea, groundnut, yam, Mucuna pruriens, and sweet potato.
The advantages of such crops include:
• coverage of soil surface and reduction of evaporation, leading to increased moisture retention, decreased daily soil temperature fluctuation and increased microbial population and activities,
• reducing the impact of raindrops on the soil surfaces, thereby reducing soil wash and erosion,
• production of a harvestable crop, depending on the species, • addition of nutrients from organic materials (leaf litter).
Covering the soil with plant residues, prunings from hedgerows, wood shavings, compost etc. has in part similar effects, and it is a useful alternative if light or water plus nutrient competition between main crops and green mulch might be limiting productivity (Agboola et al., 1991; Agbo, 1999; Akondé (1995) cited by Agbo (1999)).
1.1.3. Supply of Organic Matter
It is well known fact that productivity of tropical soils can be sustained under continuous land use if soil erosion is controlled and soil organic matter and soil physical and nutritional characteristics are maintained at a favorable level (Agboola et al., 1991). Different approaches to maintain a favorable level of soil organic matter are discussed below.
Green Manure
One of the earliest solutions to soil fertility problems was the use of green manuring which is defined as the growing an immature (mostly legume) crop which is ploughed under for the purpose of improving the soil physical and chemical status. The earlier concept was that green manure increased soil fertility and thereby allowed continuous arable cropping.
Faulkner (1934) suggested that yield could be maintained indefinitely by growing mucuna and annual crops in rotation. Greensill (1975) reported that nitrogenous inorganic fertilizers must accompany green manure, increasing yield and soil fertility. A highly productive green manure crop prevents leaching of plant nutrients and can mobilize other mineral elements.
Despite the advantages attributed to green manuring and mulching, local farmers have not been accepted these practices due to the following problems (Agboola et al., 1991):
• no immediate (cash or kind) income; thus farmers consider this unnecessary (unproductive) labour,
• improvements on tropical soils are only effective at a short term,
• additional and difficult labor required for working residues in with harrow etc…,
• it does not fit to most farmers’ traditional mixed or sequential cropping systems and is therefore not easily accepted,
• it requires what the farmer consider unnecessary labour,
• considerable energy-human or animal would be required to plough in green manure shortly before the planting of the main crop, and it might negatively affect its establishment due to allelopathic substances, mechanical barriers for germination and seedling growth (Ashok et al., 2003, Kato-Noguchi 2003).
Presently the quantity of soil N fixed by the legumes decreases due to lack of P, Mn toxicity on acid soils (Horst et al., 1997), and the lacking supply of appropriate strains of Rhizobium spp. Liming, addition of this costly nutrient and a proper inoculant to the soil is beyond the reach of many farmers.
Farmyard manure and compost
Before the advent of inorganic fertilizers, compost and farmyard manure (FYM) constituted the principal source of nutrients to crops. They have long been recognized as useful to maintain the organic matter status and to ameliorate soil physical properties. Feeding the green manure crop to cattle and adding the farmyard manure to the soil is more effective and economical than ploughing under the crop as a green manure (Agboola et al., 1991). However, any substantial increase in soil organic matter content of tropical soils would require rather sizeable amounts and continuous application of farmyard manure over a long period. According to Agboola (1982) maintenance of soil fertility and productivity with continuous application of FYM is possible. Seven and a half tons per hectare of FYM per annum seems an optimal level, at least for cotton and sorghum; it may be slightly lower for groundnut. Soil fertility and productivity tend to build up with time under continuous use of FYM (Agboola et al., 1991; Toyi et al., 1997; INRAB, 2002). Rotation seems clearly superior to continuous cropping of arable crops.
Since the population of Benin is increasing at the rate of 4% annually (ISNAR, 1995) and other facilities are competing for land requirement, it is becoming increasingly difficult to leave any piece of land to fallow longer than ten years considered as the minimum period required for the land to recuperate. According to INRAB (2002) the fallow duration passed from fifteen to one year. Diagnostic research carried out in the different parts of Benin has indicated that sustainable agricultural development is being seriously compromised by declining soil fertility (Koudokpon (1992) cited by Wennink et al. (2000)), Van der pol et al. (1993)). This has been attributed to soil mining and to the fact that few farmers are following the traditional practice of leaving land fallow to restore soil fertility. In the south of the country, where population pressure is very high, land is now more or less permanently used (Agbo and Bediye, 1997; Alohou and Hounyovi, 1999) cited by Wennink et al. (2000)). In the North of the Benin, the cultivation of cotton has led to an increase in the duration that the land is cropped, as compared to conventional farmer’s practices (Berkhout et al. (1997) cited by Wennink et al. (2000)).
The imbalance between soil nutrient input and nutrient output, the degradation of soil by erosion and decline of soil organic matter, the increasing invasion of agricultural fields by weeds such as Striga and Imperata spp and the very low crop productivity are the observed results of that low soil fertility (Van der pol et
al. (1993), Sanguiga et al. (1996), Gbehounou (1997)).
Presently, the price of inorganic fertilizer is rising daily, and peasant farmers cannot afford its use; therefore the more viable alternate is to develop low input technology for soil fertility maintenance.
Agricultural research in Benin is increasingly focusing on the restoration and maintenance on soil fertility. Several technologies have been developed, tested and made available to the extension services, but they have not been widely adopted (Alohou and Hounyovi (1999) cited by Wennink et al. (2000)).
Due to the low crop productivity and high evapotranspiration caused by the aforementioned factors, water use efficiency of the crop is also affected. Practical methods to reduce unproductive evaporation from soils and to conserve water could be the use of organic matter and mineral fertilizer.
1.2. Nutrient Assessment
The relationship between yield and plant nutrient concentration is a premise to use the plant analysis as diagnostic criterion. Diagnosis methods dealing on plant tissue analysis play a key role on precise definition and interpretation of the nutritional plant status, since it reveals greater consistency of nutrient relations, compared separately to each nutrient content, as well as in relation to the tissue age (Beaufils (1973) cited by Gualter et al. (2005)).
Using established critical or standard values, or sufficient ranges, a comparison is made between analytical data, result with one or more of these known values or ranges in order to access the plant’s nutritional status. Another system of plant analysis interpretation is called DRIS, Diagnostic and Recommendation Integrated System, a method using ratios of element contents to establish a series of values that will identify those elements from the most to the least deficient. There is on the other hand, the Compositional Nutrient Diagnosis (CND) method (Parent and Dafir, 1992) that relies on studies developed by Aitchison (1982), which involve statistical composition data analysis, based on the establishment of multinutrient variables weighed by the geometrical mean of the nutritional composition. The CND method was used by Gualter et al. (2005) to compare DRIS and M-DRIS for diagnosing the nutritional status of eucalypt plantations in Central-Eastern Minas Gerais State, Brazil. In this study, DRIS, M-DRIS, and CND methods were compared by means of specific norms, based on the frequency of concordant diagnoses (FCD) derived from the fertilization response potential (FRP). The means of FCD of DRIS vs M-DRIS, DRIS vs CND, M-DRIS vs CND were calculated for each comparison as follows:
1st: the nutrients N, P, K, Ca, and Mg were considered separately in the DCF evaluation of the FRP,
2nd: the FCD of the FRP for all sites, considering all 5 nutrients together, diagnosed the stands for discordances for just one nutrient. This kind of comparison expresses the highest level of similarity among the methods,
3rd: the FCD of the FRP considering all sites for the factor most limiting growth by deficiency (p), and the main factor limiting through excess. This evaluation
The concordance or level of coincidence was lower when M-DRIS was included into the comparisons.
Therefore, the match between the methods may vary according to the nutrient concentration in the plant and according to the diagnosis method. The methods differ, however, as M-DRIS and CND do not establish any reference for the diagnosis, at least in the way they have been used by Gualter et al. (2005). Here, M-DRIS was sensitive to the effects of dilution or concentration. When analyzing selected stands of a low-productivity subpopulation with different levels of nutrient concentration in the trees, M-DRIS did not detect any limitation by deficiency, but indicated either a positive or virtually no response to fertilization, DRIS and the CND, on the other hand, were both able to detect these responses.
If growth limitations of the analyzed stands were of a non-nutritional nature, M-DRIS would appear more appropriate. However, if the low productivity were a consequence of nutritional problems as well, DRIS or CND would be the methods of choice, provided the non-nutritional problems will be solved too.
1.2.1. Critical Value Method or Critical Nutrient Level
Plant nutrient concentrations have long been used to diagnose nutritional problems in plants (Tyner, 1946; Viets et al., 1954; Beaufils and Sumner, 1977). The oldest method of using tissue analysis as a diagnostic tool (Tyner, 1946) is the “critical value method” (CVM).
The critical level of a nutrient has been defined as that concentration in a specific plant of growth at which a 5 or 10 % of reduction in yield occurs, or that concentration which is associated with the breaking point of the nutrient response curve, or that concentration which is at the midpoint of the transitional zone between deficiency and sufficiency levels (Ulrich and Hills, 1973). The CNL approach is widely used but it is limited by that fact accurate interpretation of foliar values can be obtained only when sampling is restricted to that same growth stage at which the standard reference values for nutrients were established. This drawback is a direct result of using the dry matter, which changes directly with age, as the sole basis for expressing nutrient composition (Beaufils ,1971; 1973).
The usual methods for leaf analysis interpretation are based on the comparison of the nutrient concentration with critical reference values (sufficiency range approaches). Concentration values above or below reference values are associated with decrease in vegetative growth, yield, and quality. These methods consider the association of isolated concentration values with deficiency or excess, without considering the nutritional balance.
The CVM uses nutrient concentrations in an effort to separate limiting from non-limiting nutrient conditions.
Melsted et al. (1969) determined the critical concentrations for 11 essential elements for maize, soybeans, wheat, and alfalfa. The levels were determined after conducting experiments at a number of locations for several years.
Hylton et al. (1967) have shown that the critical level of an element can shift rather widely if an interfering or complimentary element is present.
The CNL or CVM had some advantages and disadvantages.
Advantages
Conventionally, leaf analysis has provided a guide for fertilizer application according to the sufficiency range (Carpena et al., 1969; Del Amor et al., 1984). The deficiency or excess of an element has a clear influence on its ratios with other elements (Llorente, 1966; Carpena et al., 1969).
Disadvantages
While CVM can be used to make accurate diagnoses, some of its disadvantages are according toTyner (1946) Bailey et al. (1997):
• critical nutrient values vary with the concentration of other nutrients, • critical values vary with plant age and varieties and,
• CVM does not diagnose which nutrient is “most limiting” when two or more nutrients are simultaneously deficient.
• Unfortunately, the results of such analyses can be difficult to interpret, simply because the minimum or critical concentration of a nutrient in plant tissue for optimum growth varies both with crop age and with changes in the
A new concept for plant analysis interpretation has been proposed by Beaufils (1971; 1973) as a means to overcome some of these difficulties.
1.2.2. Diagnosis Recommendation and Integrated System (DRIS)
The Diagnosis and Recommendation Integrated System (DRIS) is based on nutrient balance (ratios) and is considered by some to be more accurate in its diagnoses. Diagnosis made using DRIS are based on relative rather than on absolute concentrations of nutrients in plant tissue, and as such should be comparatively independent of crop age.
The DRIS has been regarded by some to be capable of providing nutrient diagnoses via foliar analyses regardless of the origin or age of the plant. It is designed to assess relative nutrient imbalances or deficiencies or both, in plant tissue (Beaufils, 1973; Sumner, 1977a; 1977b; 1979, 1981; 1982). The DRIS approach also provides the relative order of nutrient need, and since the level of one nutrient is compared with those of all others, nutrient balance is an inherent part of the system. Furthermore, the overall status of nutrient balance in the plant is shown by the absolute sum of all of the individual DRIS indices. In its present form, the DRIS procedure is used to measure deviations of certain nutrient ratios in plant tissues from corresponding nutrient previously established as reference values, or norms. Based on these comparisons, a set of indices is produced denoting a relative sufficiency or deficiency of each element diagnosed. Since DRIS is based on ratios and nutrient balance, it would be possible to have all low nutrient levels in a plant, and still have the nutrient ratios within the optimal range. This is much more likely a problem where a relatively few number of norms are being used for a crop. Use of critical values or sufficiency ranges for samples taken at the right growth stage ensures that this problem does not occur.
Two features of the DRIS procedure distinguish it from other systems of nutrient diagnosis.
• First, providing that norms for specific crops are derived from a sufficiently large data base. However, Elwali et al. (1981) using a small data base (90 observations in each of the low-and high-yield subpopulations) concluded
diagnosis. DRIS diagnoses are applicable irrespective of varietal or geographic variables or both (Sumner, 1979). Escano et al. (1981), however, have suggested that at least for maize, use of locally calibrated norms may be more accurate in diagnosing nutrient deficiencies than norms developed from plant materials gathered in other geographic regions.
• Second, assuming that nutrient ratios in plant tissues remain constant throughout the growing season, correct diagnoses using the DRIS procedure are possible regardless of the physiological age of the plant (Sumner 1977b; 1977c).
Advantages
DRIS has two main advantages over the conventional approaches:
• firstly, DRIS determines the sufficiency of each nutrient in relation to others in the plant, calculating a nutrient index simultaneously for each nutrient. This identifies not only the nutrient most likely to be limiting, but also the order in which other nutrients are likely to become limiting,
• secondly, DRIS calculates a nutrient imbalance index (NII), which indicates the overall nutrient balance in the plant. It provides a means of simultaneously identifying imbalances, deficiencies and excesses in crop nutrients, and ranking them in order of importance (Walworth and Sumner, 1986).
Additionally, there are other advantages of the DRIS approach:
• all factors which can be quantitatively or qualitatively expressed are considered simultaneously in making a diagnosis;
• after being developed for a plant species, the DRIS can be used irrespective of the used cultivar or local conditions;
• DRIS is less dependent on crop age than the critical level approach; and DRIS ranks the nutrients in order of their requirement by the plant (Beaufils 1973; Sumner 1978; 1979).
Disadvantages
Though DRIS is considered an improvement over the CVM, it has a disadvantage in that each time it is used, it predicts that one or more nutrients are limiting. Consequently, there is no mechanism to distinguish when nutrients are limiting and when they are not. This can result in erroneous diagnoses for situations in which nutrients do not limit yield. A possible means of avoiding this problem is to incorporate nutrient concentrations into the calculation of DRIS indices. Walworth et al. (1984) did this, initially with maize, and derived a dry matter index value.
However, although DRIS diagnoses may prove useful, they should always be used in conjunction with established crop and soil fertility evaluation procedures before recommendations are decided upon.
Despite many advantages providing from the DRIS, a number of modifications have been proposed including the use of only one method for calculating nutrient indices, and incorporating nutrient concentrations.
Modifications on DRIS
Originally, the method eliminated the leaf dry weight component in the analysis by using only element ratios in the calculation. Accordingly it was claimed that for the DRIS analysis the plant can be sampled at any time rather than at standard physiological stages (Kelling and Schulte, 1997). However, an M-DRIS modifications was proposed to separate limiting from non-limiting nutrients (Halmark et al., 1987). This modification re-introduced the dry weight component into the analysis. According to Hallmark et al. (1992), in M-DRIS, all nutrients with index values more negative than the DM index are diagnosed as deficient while those with values equal to or larger than the DM index are designated as sufficient.
In previous research, Bervely et al. (1984) found that derivation and interpretation of DRIS diagnoses could be simplified by:
• using a single index calculation method and,
• incorporating a measure of the probability of yield response to a treatment. The modification, described by Elwali and Gascho (1984), is that any two nutrients (X and Y) are considered to be in optimum balance
[
f(X /Y)=0]
if their ratio in a sample was within the range describing by the norm (mean value) for that parameter. Using this modification of the original DRIS formula lessens the risk of wrongly declaring severe imbalances among nutrients.Synthetic research on DRIS
Beaufils (1973) used the survey approach by using the world’s published literature and plotting elemental leaf content vs. yield, a distribution that is normally skewed. To normalize the distribution curve, the yield component is divided into low- and high-yield groups. Walworth (1986) suggested that the data bank for determining DRIS norms have at least several thousand entries be randomly selected, and that at least 10 % of the population be in high-yield subgroup. It is also important that the cut-off value used to divide the low-from the high-yielding subgroups has to be such that the high-yield data subgroup remains normally distributed. Selecting the elemental content mean, the ratio and product of elemental means are with the largest variance, which in turn maximizes the diagnostic sensitivity.
Previous work indicates that the detrimental effects of tissue age, leaf position and cultivars on the accuracy of deficiency diagnoses can be minimized using DRIS (Sumner and Beaufils, 1975; Beaufils and Sumner, 1977; Sumner, 1977; Hallmark et al., 1984; Hallmark et al., 1985; Sumner, 1979). DRIS methodology has been used successfully to interpret the results of foliar analyses for a wide range of long-term cash crops such as sugarcane (Elwali and Gascho, 1984) and short-term cash crop such as vegetables and wheat (Meldal-Johnson and Sumner, 1980; Amundson and Koehler, 1987). This approach has been used successfully to diagnose nutritional disorders on different crops such as rubber (Beaufils, 1957), potatoes (Medal-Johnson, 1975), sugarcane (Beaufils and Sumner, 1976; Jones and Bowen, 1981; Elwali and Gascho, 1984), maize
above studies confirmed the general utilization of the DRIS norms in many annual crops, regardless of the variety and age of the crop at sampling when the norms were obtained from broad data bases. However, it is well known that in lemon trees, leaf nutrient contents are influenced by sampling date and rootstock.
By using DRIS, many of the problems associated with or related to dry matter accumulation have been reduced. Research with several crops including sugar cane, maize, soybeans, alfalfa and wheat has shown that the effects of tissue age, leaf position and cultivar can be minimized using the DRIS approach (Sumner et al., 1975; Sumner, 1977a; 1977b; 1977d; Sumner, 1979; Erickson
et al., 1982). For example, maize samples taken over a wide array of growth
stages (30 to 110 days) may show widely varying nutrient concentrations (53, 50 and 89 % change for N, P and K respectively) whereas the ratios of these nutrients and the DRIS indices are much more consistent (Sumner, 1979). It has generally been accepted that once a sufficient number of samples have been included in the data base and the norms correctly established, the norms are applicable across broad geographic regions or are even universal (Beaufils, 1971; Sumner, 1979). However, some data for alfalfa (Kelling et al., 1986) and maize (Escano et al., 1981) have shown that increased precision can be obtained by developing norms that are calibrated locally.
DRIS norms have been developed for several field, forest and horticultural crops, and have been applied as an additional tool for nutritional status diagnosis in the United States, Canada, and China (Lopes, 1998; Hallmark and Bervely, 1991).
The two new methods use individual nutrient concentration values, instead of ratios.
Investigations by Woods and Villiers (1992), in South Africa, pointed out that DRIS can be successfully applied in nutrient diagnosis of ‘Valencia’ sweet orange groves. The authors correlated yield (kg per plant) and quality (fruit mass) with DRIS indexes, working in a database with more than 1,700 observations. DRIS norms were also evaluated in field fertilization trials and successfully associated with increases in yield and fruit quality.