Publisher’s version / Version de l'éditeur:
Lighting Research and Technology, 40, June 2, pp. 133-151, 2008-06-01
READ THESE TERMS AND CONDITIONS CAREFULLY BEFORE USING THIS WEBSITE.
https://nrc-publications.canada.ca/eng/copyright
Vous avez des questions? Nous pouvons vous aider. Pour communiquer directement avec un auteur, consultez la
première page de la revue dans laquelle son article a été publié afin de trouver ses coordonnées. Si vous n’arrivez pas à les repérer, communiquez avec nous à [email protected].
Questions? Contact the NRC Publications Archive team at
[email protected]. If you wish to email the authors directly, please see the first page of the publication for their contact information.
This publication could be one of several versions: author’s original, accepted manuscript or the publisher’s version. / La version de cette publication peut être l’une des suivantes : la version prépublication de l’auteur, la version acceptée du manuscrit ou la version de l’éditeur.
For the publisher’s version, please access the DOI link below./ Pour consulter la version de l’éditeur, utilisez le lien DOI ci-dessous.
https://doi.org/10.1177/1477153507086279
Access and use of this website and the material on it are subject to the Terms and Conditions set forth at
Lighting appraisal, well-being, and performance in open-plan offices: a
linked mechanisms approach
Veitch, J. A.; Newsham, G. R.; Boyce, P. R.; Jones, C. C.
https://publications-cnrc.canada.ca/fra/droits
L’accès à ce site Web et l’utilisation de son contenu sont assujettis aux conditions présentées dans le site LISEZ CES CONDITIONS ATTENTIVEMENT AVANT D’UTILISER CE SITE WEB.
NRC Publications Record / Notice d'Archives des publications de CNRC: https://nrc-publications.canada.ca/eng/view/object/?id=643821ea-8566-4d43-9330-052c75e0e99d https://publications-cnrc.canada.ca/fra/voir/objet/?id=643821ea-8566-4d43-9330-052c75e0e99d
L i g h t i n g a p p r a i s a l , w e l l - b e i n g , a n d
p e r f o r m a n c e i n o p e n - p l a n o f f i c e s : a l i n k e d
m e c h a n i s m s a p p r o a c h
N R C C - 4 9 4 6 1
V e i t c h , J . A . ; N e w s h a m , G . R . ; B o y c e , P . R . ;
J o n e s , C . C .
A version of this document is published in / Une version de ce document se trouve dans: Lighting Research and Technology, v. 40, no. 2, June 2008, pp. 133-151 doi:
10.1177/1477153507086279
The material in this document is covered by the provisions of the Copyright Act, by Canadian laws, policies, regulations and international agreements. Such provisions serve to identify the information source and, in specific instances, to prohibit reproduction of materials without written permission. For more information visit http://laws.justice.gc.ca/en/showtdm/cs/C-42
Les renseignements dans ce document sont protégés par la Loi sur le droit d'auteur, par les lois, les politiques et les règlements du Canada et des accords internationaux. Ces dispositions permettent d'identifier la source de l'information et, dans certains cas, d'interdire la copie de documents sans permission écrite. Pour obtenir de plus amples renseignements : http://lois.justice.gc.ca/fr/showtdm/cs/C-42
Lighting Appraisal, Well-being, and Performance in Open-Plan
Offices: A Linked Mechanisms Approach
JA Veitch† PhD, GR Newsham† PhD, PR Boyce* PhD, CC Jones‡ BFA
†
National Research Council Canada Institute for Research in Construction; Bldg M-24 1200 Montreal Road; Ottawa, Ontario KIA OR6; Canada. email: [email protected].
*
Lighting Research Center, Rensselaer Polytechnic Institute, Troy, NY, USA. PR Boyce is now an independent consultant based near Canterbury, UK.
‡
Battelle Memorial Institute / Pacific Northwest National Laboratory, Lexington, MA, USA.
Abstract
In two experiments in a simulated office space, temporary office personnel worked under one of six lighting conditions for a day. A previous paper reported the results of statistical tests for lighting conditions effects on perceptions, feelings, and task performance. This paper reports mediated regression analyses testing the linked mechanisms by which lighting conditions affect health, well-being, and task performance. Combined results from the two statistical approaches show that people who perceived their office lighting as being of higher quality rated the space as more attractive, reported more pleasant mood, and showed greater well-being at the end of the day. Direct-indirect lighting and personal control were favoured. Lighting conditions that
improved visibility also improved task performance.
1. Introduction
Most members of the lighting community would agree that good quality lighting does more than provide adequate visual performance and avoid visual discomfort. Although details differ between various models, there is some agreement that lighting quality includes, in addition to visibility and visual comfort, consideration of the appearance of the space, energy efficiency, architectural integration, and costs.1-3 Sufficient attention has been paid to visibility and the avoidance of discomfort that offices with problems in these areas are relatively rare; however, the creation of attractive spaces that show architectural integration is less common. The
stumbling block, one hears, is cost; it is said that without proof that lighting quality contributes to organizational productivity, the additional expense of thoughtful lighting design cannot be justified. This paper provides a link in the developing evidentiary chain for this proof.
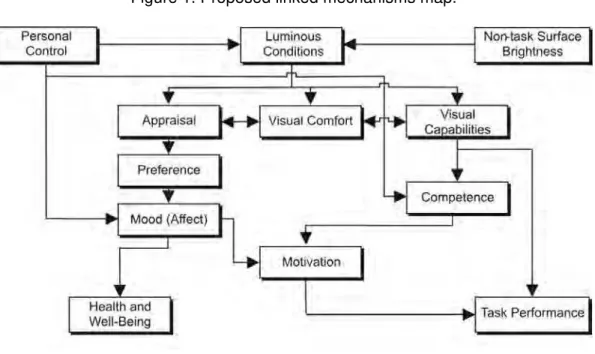
This paper is an extension of analyses presented by Boyce et al.4 of two experiments in which groups of temporary office workers came into a simulated open-plan office to work for a day at a time under a lighting condition chosen to exemplify either standard practice or better practice as judged by lighting professionals. The workday consisted of questionnaires and a set of tasks selected to be representative of the components of office work. All of the dependent variables were selected to provide measurements of concepts in a set of connected hypotheses about the effects of luminance distribution (created by varying the luminaires), non-task surface luminance (varied by changing the reflectance and colour of the cubicle surfaces) and control over lighting on various behavioural outcomes. Wyon has called such a set of connected hypotheses a linked mechanisms map.5 Figure 1 shows the linked mechanisms map proposed for the experiments reported here.
The rationale behind this linked mechanisms map is as follows:
• Changing the luminous conditions in an office can change visual capability,6
visual comfort,7 and the perception (appraisal) of the conditions.8
• Luminous conditions that cause visual discomfort or distraction, over time, will affect visual capability and the appraisal of the conditions. Similarly, luminous conditions that limit visual capability will, over time, affect visual comfort.
• Visual capabilities have a direct effect on task performance.6,9,10
They also affect the perception of competence to do the task and hence the motivation to do the task. • Lighting conditions are appraised against expectations to determine whether the office
worker likes or dislikes the luminous conditions (preference) and this, in turn, leads to an effect on mood.11,12
• Mood directly affects feelings of health and well-being. Mood and the perception of competence together affect the motivation to do the task and hence task performance.11,13 • Giving an office worker personal control directly affects their mood and feelings of
competence to do the task.14,15
Previous papers about these experiments reported the hypothesis tests of lighting conditions effects on the dependent measures directly,4 and summarized the data relating to the use of individual controls.16 The present paper adds to these a set of multiple regression
analyses testing the linked mechanisms map. These analyses address the proposition that the effects of lighting on health and well-being and on task performance are mediated by effects on other subjective and objective states. The paper concludes with an integration of the results into one modified linked mechanisms map.
2. Method
2.1 Setting and lighting conditions
Details of the experimental conditions and setting are provided in references 4 and 17. The experiments took place in a leased office space in Albany, New York. The space was furnished as a typical small open-plan office with nine cubicles. Over the two experiments there were six different lighting configurations, all of which were compliant with existing North
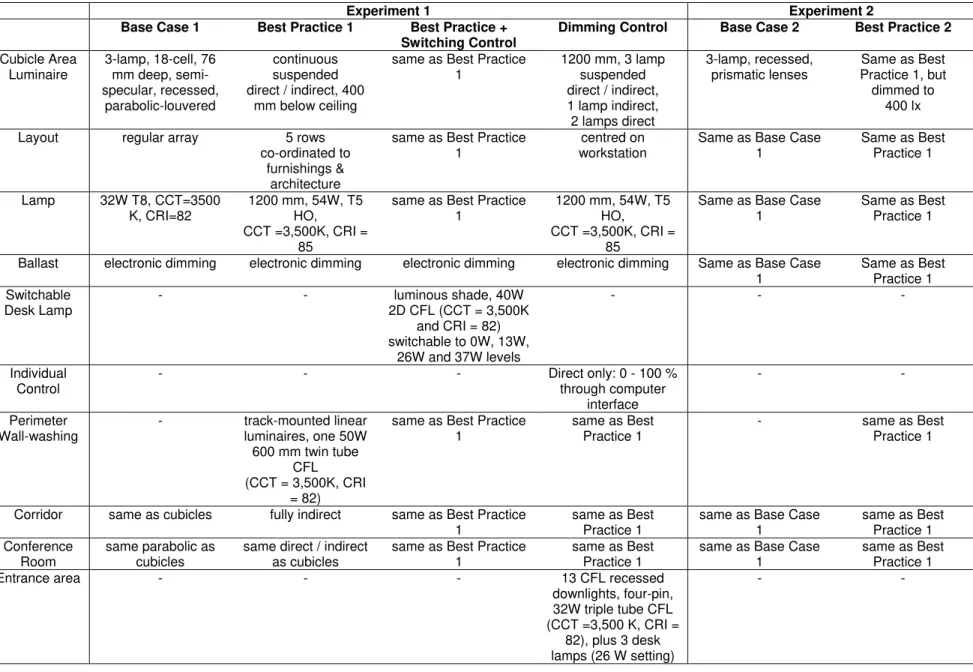
American standards for office lighting. These are summarized in Table 1. In Experiment 1 there were recessed parabolic louvered luminaires (Base Case 1); suspended linear direct-indirect luminaires (at ~600 lx desktop illuminance) plus wall washing (Best Practice 1); suspended linear direct-indirect luminaires with a switchable desk lamp plus wall washing (Best Practice 1 with switching control); and, suspended workstation specific direct-indirect luminaires with individual workstation dimming for the direct portion plus wall washing (Dimming Control). Experiment 2 contrasted recessed prismatic lensed luminaires (Base Case 2) and suspended linear direct-indirect luminaires dimmed to 400 lx desktop illuminance plus wall washing (Best Practice 2).
2.2 Participants
Participants were hired from an office temporary services agency. In both experiments, participants worked under the given lighting condition for a full 7.5 hr day. Details are available in references 4 and 17.
The study afforded three independent tests of the linked mechanisms hypotheses. In Experiment 1, participants were randomly assigned to one of four lighting conditions; this set is labelled Ex1BG (between groups). Data from 58 men and 93 women, mean age 34 years, were included in this data set (151 of the original 181 participants). A subset of participants in
Experiment 1 returned to participate in a second condition on a later day; this set is labelled
Ex1RM (repeated measures). There were data from 9 men and 27 women, mean age 34 years,
in this data set (36 of the original 45 participants). In Experiment 2, a separate set of participants were randomly assigned to one of two lighting conditions; this set is labelled Ex2. Data from 30 men and 50 women, mean age 30.6 years, made up this group (80 of the original 107
participants).
2.3 Procedure
usual coffee and lunch breaks. The measurements assessed each of the concepts in the linked mechanisms map, plus measurements of social behaviour. The activities undertaken by the participants during the day were described in detail in references 4 and 17. In references 4, 16, and 17, we reported the extensive analysis of variance and nonparametric analyses conducted to examine the effects of the lighting conditions and non-lighting variables such as time of day and print size. Here, we describe the data analysis procedure used to test the linked
mechanisms map.
2.3.1 Variable definitions
For the multiple regression tests of mediated relationships, data from the last part of the experimental day, following the afternoon coffee break, were used, on the assumption that by this time participants would have developed the greatest familiarity with the lighting conditions. We selected a subset of variables for these tests, basing our choices on logical considerations so that each variable would be the best available indicator of the target concept. For the final outcomes of health and well-being and task performance, which were our principal interest, we chose more than one dependent variable. The specific variables included, with labels used in the Results tables, are listed below. In all cases, higher values are to be interpreted as a better outcome, with the exception of the Visual Discomfort and Overall Discomfort scores, for which higher values mean more severe or more numerous symptoms.
• Appraisal: Ratings on the NRC Lighting Quality scale. Label: LQ • Preference: Average ratings of attractiveness. Label: Attract • Mood: Average ratings of pleasure. Label: Pleas
• Visual Discomfort: Average ratings of visual discomfort. Label: VDCom
• Motivation: The individual's willingness to persist at a difficult or impossible task, in this case persistence at a target identification task in which the targets moved across the computer screen with increasing speed.4 Label: Motiv.
• Visual capabilities: Average composite visual performance (correct responses/sec) for a high contrast target (grey level 16). Label: Visib.
• Competence: Average environmental competence score. Label: EComp. • Health and well-being:
o Overall discomfort: This is a new variable, calculated for the multiple regression analyses. It is the sum of the previously reported physical and visual discomfort scores. The internal consistency reliability for this new variable was good (Ex1BG, alpha = 0.78; Ex1RM, alpha = 0.86; Ex2, alpha = 0.79). Label: Discom.
o Environmental satisfaction: Average satisfaction with the work environment. Label: EnvSat.
o Performance satisfaction: Average satisfaction with one’s work performance that day. Label: PerfSat.
• Task Performance:
o Work structure: The time taken between completing one part of the
summary extraction task and moving to the next. For this task, the interval combined rest time and time to read a short article.17 Label: SumBrk o Vigilance: The speed with which participants responded to a visual and
auditory prompt similar to the arrival of an email message. Label: ESpd. o Typing: The correct characters per second typed in a transcription task,
for source text in a small print size (8 pt). Label: Typing.
o Composite cognitive speed: This is a new variable created for the regression analyses. It is the average standardized performance speed on three complex tasks: placing articles into predefined categories;
making judgements about article quality; and choosing the best
sentences to form a summary of a new passage.4 Internal consistency reliability of this variable was good (Ex1BG alpha = 0.75; Ex1RM alpha = 0.83; Ex2 alpha = 0.65). Label: CogSpd.
o Cognitive accuracy: This is the average accuracy score for categorizing short articles. Label: CogAcc.
2.3.2 Mediated regression analysis
In reference 17, we used an analysis of variance approach to test the sequence of direct effects shown in Figure 1. In that approach, we tested each link separately, creating an
independent variable with two levels based on a median split: scores below the median score for the given variable were coded as 1 and those above the median as 2. Then, we tested the effect of that independent variable on the variable next in the sequence. For example, we tested the effect of high and low ratings of lighting quality on preference, finding that people who rated the lighting as being of higher quality rated the space as being more attractive. This is a simple approach to testing the linked mechanisms, but the formation of median-split groups for the independent variables at each step could be criticized as creating an artificial dichotomy, whereas the data were continuous and not bimodal. In addition, it could only examine one pair of variables at one time and could not incorporate tests of indirect effects.
For this paper, we used the statistical techniques for mediated regression analysis set out by Baron and Kenny18 to test the causal chains described in the map shown in Figure 1. This is a logical sequence of multiple regression analyses used to examine whether the
influence of one variable (X) on another (Y) is partly or wholly explained by the influence of X on a third variable (M) and the influence of M on Y. Longer chains are established logically, from sequential mediation analyses. This technique provides a more nuanced result than the chain of ANOVAs, incorporating the possibility of both direct and indirect effects, and also preserves all of the variability in the X and M variables.
For each mediation chain (what we have called one link), one performs three multiple regressions:18
1. X → M 2. X → Y
3. X + M → Y
To show a direct effect of X on Y, step 2 must show a statistically significant result. To show mediation, all three regressions must show overall statistical significance. In addition, to demonstrate mediation, at step 3, M must be a statistically significant predictor of Y, and the effect of X on Y must be smaller than it is in step 2. If the effect is wholly mediated (i.e., the effect of X on Y is indirect, through M), then X will not be a statistically significant predictor of Y in step 3. It is also possible for there to exist both direct and indirect effects.
In interpreting the findings, we looked at three indicators:
1. The statistical significance of the regression analysis and of the predictors, using
p<.05 as our criterion;
2. The percentage of variance explained (R2), using Cohen’s guidelines for small (1%), medium (9%), and large effects (25%);19
3. The unstandardized regression coefficient (B), to compare the size of the effect of X on Y in steps 2 and 3.
We began the mediation chain starting from the level of appraisal, visual comfort, and visual capabilities. Note that these analyses did not include the lighting conditions as variables. The data were those for the variables defined in section 2.3.1. The path leading from appraisal through preference and mood to health and well-being we have called the Appraisal path. Leading from visual capabilities to task performance is the Vision path. There are also tests of the cross-links between these paths, through visual discomfort and motivation.
Only the data from participants with complete data from all variables were included in these analyses. We repeated the analyses for three independent data sets: Experiment 1 first visit (Ex1BG, N=151); Experiment 1, second visit (Ex1RM, N=36), and Experiment 2 (Ex2, N=80). This provides internal replication, and strengthens our confidence in the results.
3. Results
3.1 Lighting condition effects
In references 4 and 16 we reported the extensive analyses of variance and
nonparametric tests we conducted to test the effects of the various lighting conditions on all of the dependent measures, and the descriptive statistics for use of dimming and switching controls. Key findings are those that demonstrate links in the map:
• Personal control resulted in varied luminous conditions. When offered the opportunity to adjust part of the workstation lighting, people chose a wide range of light levels.16 • Different lighting installations were perceived differently.4
Specifically, the lighting from direct-indirect luminaires (Best Practice) was rated as being comfortable by more people (~80%) than that from direct only luminaires (Base Case) (~70%). Individually
controllable workstation specific lighting (Dimming Control) was rated as being comfortable by over 90% of participants.
• Lighting conditions that improved the visibility of the tasks led to better task performance.4
• Individual control over lighting beneficially affected motivation and well-being (as measured by satisfaction ratings).4
These links are shown as dotted lines in Figure 2.
3.2 Linked mechanisms: Mediated regression analysis
3.2.1 Appraisal path
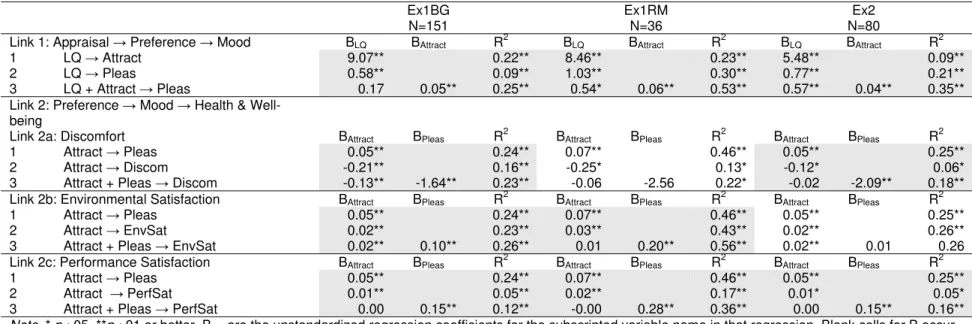
Overall, the results of the mediated regression analyses were strongest for the appraisal path, leading through preference and mood to health and well-being (Table 2). For the largest data set, Ex1BG, the results were clear, with partially mediated relationships for both links and large proportions of explained variance. That is to say that the antecedent variable (e.g., lighting appraisal) had both direct effects on the outcome variable (e.g., mood) and effects through the mediator (e.g., preference). These effects were in the expected directions: positive for mood, environmental satisfaction, and performance satisfaction, and negative for overall discomfort. For health and well-being measured as satisfaction with task performance, mediation appeared to be complete rather than partial, with the regression coefficient for preference (Attract)
dropping to zero at Step 3.
The results for Ex1RM and Ex2 were broadly consistent, although each included one outcome for which mediation was not demonstrated. In the case of Ex1RM, the final step for the overall discomfort analysis was difficult to interpret; the overall regression was statistically significant, but neither of the two predictor variables (Attract and Pleas) met the criterion (i.e., p > .05). This confusing result might have been caused by the overall low level of discomfort reported in this small sample. For Ex2, there was a direct effect of preference (Attract) on satisfaction with the environment, but no evidence that mood (Pleas) acted as a mediator. For all other links, the results followed the same pattern as for Ex1BG.
Taken overall, we judge that the appraisal path is supported. The effects are strong, with explained variance as high as 56%. People who perceived their office lighting as being of higher quality rated the space as more attractive; as a result they were in a more pleasurable mood; and, in turn, they reported less overall discomfort and greater satisfaction with the work environment and with their performance on that day.
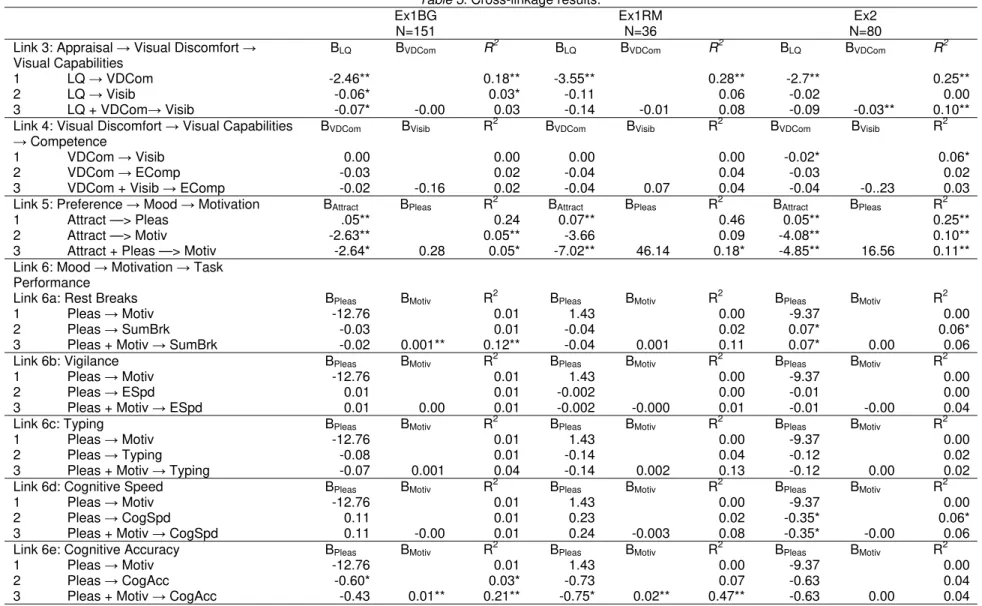
3.2.2 Cross-links
In general, the links between the appraisal and vision paths did not show evidence of mediated effects as they had been expected to do (Table 3). Link 3 tests revealed a consistent large relationship between lighting appraisal and visual discomfort, in the negative direction that one would expect (higher appraisals predicting lower discomfort). However, this did not have the anticipated follow-on effect on visual capabilities, probably because lighting quality ratings were generally high (e.g., for Ex1BG, the mean rating was 2.93 (potential range 0 – 4), and the median was 3),17 and visual discomfort generally low (for Ex1BG, mean rating was 4.87 [potential range 0-36]).17 Link 4, from visual discomfort through visual capabilities through competence, had no support, probably for similar reasons.
There was an unexpected result in the tests for Link 5, from preference through mood to motivation. Rather than a mediated relationship through mood, it appears that there was a direct effect of preference on motivation in an unexpected direction: lower ratings of attractiveness predicted better performance on a task where persistence is required, something that calls for motivation. The effect is small to medium sized, and observed for the Ex1BG (where it was small, R2=.05) and Ex2 samples (medium, R2=.10). We probed this connection further with additional analyses described below.
The expected mediating relationships between mood, motivation, and task performance were not observed (Links 6a to 6e). There appeared to be some direct effects of motivation on task performance: Motivation was a significant predictor of rest breaks in Ex1BG and of
cognitive accuracy in Ex1BG and Ex1RM.
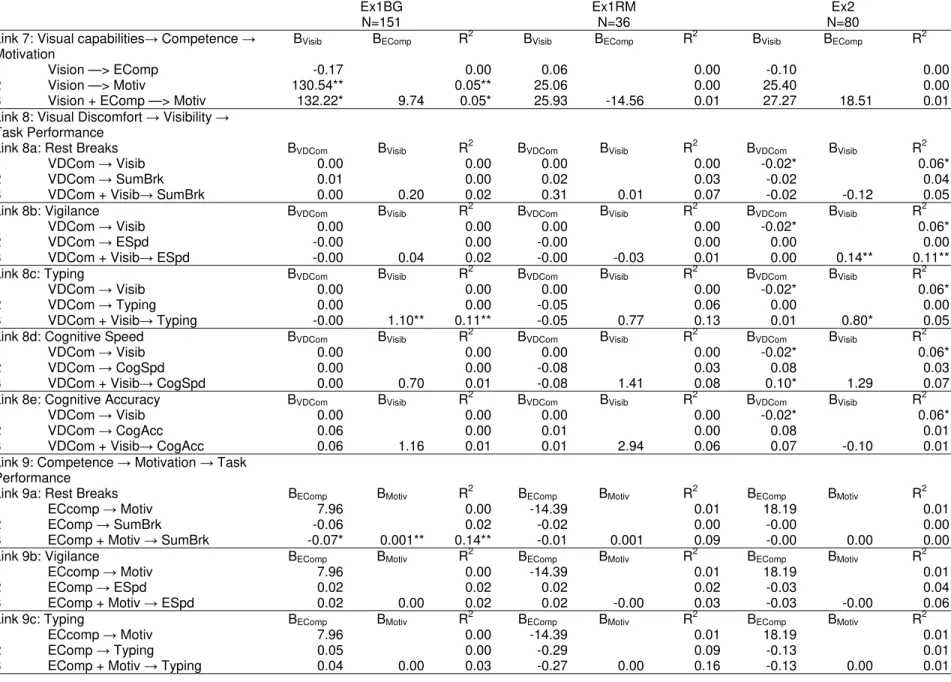
3.2.3 Vision path
Table 4 shows the mediation analyses for the path from visual capabilities through motivation and competence to task performance. None of the proposed links showed mediated relationships, although several direct effects were demonstrated. We observed the same effects of motivation on task performance in Link 9 that had occurred in the models of Link 6 (shown in Table 3). In addition, people with better visual capabilities did better on the typing task in
Ex1BG; in Ex2 visual capabilities was a significant predictor of typing performance although the overall regression result did not reach statistical significance (perhaps because of the smaller sample). We repeated these analyses for the direct link from visual capabilities to each of the five forms of task performance, with no substantive difference to the results. The absence of large effects of visual capabilities on these task performance scores likely reflects the fact that none of the tasks was very visually demanding. In the lighting conditions analyses previously reported, which included specific probes for the effects of changing visual difficulty on task performance, the expected effects were observed.4
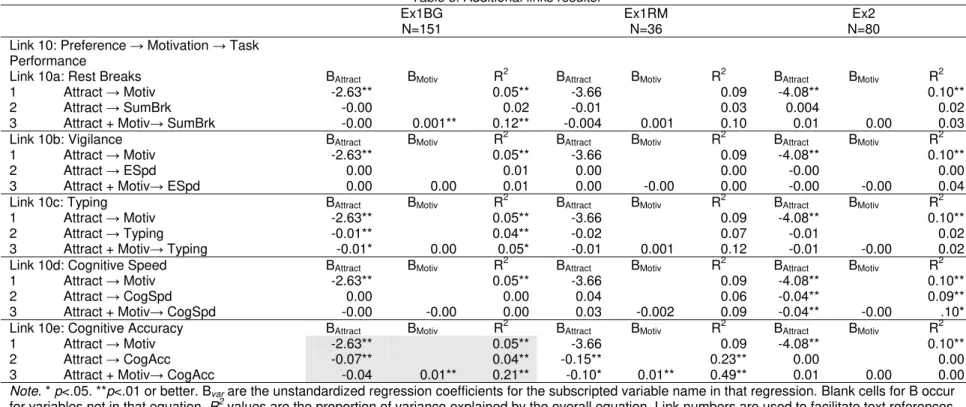
3.3.4 Additional links
We added one new path, not show in Figure 1, based on the foregoing results, a mediated route from preference through motivation to task performance (Table 5). The results were not clearly in favour of the mediated connection, but there is sufficient support to warrant further investigation. As noted in the earlier analyses, there was a small to medium sized
negative relationship between preference and motivation, observed in both Ex1BG and Ex2, the larger samples. There was evidence of direct negative effects of preference on cognitive
accuracy (Link 10e), with mediation supported for Ex1BG and a mediation like pattern for Ex1RM (although missing the significant effect at step 1). There were small direct, negative, effects of preference on typing and cognitive speed in one sample each. Further examination in other settings is needed to rule out the possibility that this path, which the literature did not predict, is an artifact of the specific conditions examined in these experiments.
4. Discussion
We combined all of the results from the various analyses and the two experiments into one modified linked mechanisms map, shown in Figure 2. This map is an update to the version presented in the project report,17 showing the addition of a direct path from preference to health and well-being, and the path involving preference and motivation. The previous median split analyses could not detect these relationships.
The most consistent finding, and the one with the largest effect size, is the appraisal path. Overall, these experiments found that changing lighting installations influenced appraisals of lighting quality, and that people who were more satisfied with their lighting (regardless of the type of lighting they experienced) considered the space to be more attractive, were happier, and were more comfortable and more satisfied with their environment and their work.
The analyses of lighting condition effects, including probes for the effects of changing visual conditions on task performance, are the principal source of evidence for the link between visual capabilities and task performance. When tasks were made more difficult to see, by reducing print size or contrast, performance declined.4 These findings are as one would expect based on models of visual performance.6
The results were less clear for mediated links through competence or motivation for the mechanisms involving the task performance measures. The problem most likely lies with the dependent measures. The environmental competence scale is a relatively new one, and designed more for field studies than laboratory experiments. As for task performance, none of the office work tasks were presented under conditions that would be considered truly poor visibility; the lighting conditions were all designed to meet at least the minimum criteria of recommended practice for office lighting.20 Moreover, all were relatively simple tasks using well learned office skills that the participants brought to the experiment; and in addition, there was no consequence for poor performance. In a short term experiment it is difficult to provide
sufficiently challenging tasks to produce a range of responses in relation to lighting conditions, comfort, or visual capabilities. Future research with more sensitive dependent measurements, and perhaps in a field setting, might be able to detect the originally predicted links. However, the extreme conditions required to influence competence or motivation by reducing visibility are unlikely to occur in practice.
There was an unexpected finding, a negative relationship between preference and motivation, with a partially mediated effect on cognitive accuracy. This is unexpected and difficult to explain. Further research will be needed to determine whether it is a real phenomenon or a chance occurrence.
This approach to testing a set of linked mechanisms has some drawbacks. It cannot give an estimate of the fit of the entire model, as a structural equation modelling (SEM) analysis would do.21,22 It also requires many simultaneous regression analyses, with the possibility of spurious results because of the non-independence of the tests. SEM was not feasible with this model because there were too many parameters to be estimated given the sample size, and because several of the variables had very non-normal distributions. Multiple regression is more robust to these violations of assumptions. We were fortunate to be able to address the
independence problem using the three separate data sets as replications of the tests. We predicted only those paths that had a logical foundation based on the scientific literature. Other possible connections between these variables exist, and we cannot rule out other mechanisms, operating in parallel with those revealed here. Nonetheless, most links have support from other investigations and from supporting theories, which can give us more
confidence in the map as a means of understanding how employees experience and respond to their working environments.
This is the first time the complete path from lighting conditions to feelings of health and well-being has been demonstrated. This is a first step towards the demonstration that better quality lighting can support organizational productivity. Other researchers have demonstrated
that satisfaction with lighting contributes to greater environmental satisfaction , which in turn leads to greater job satisfaction 23 and that higher environmental and job satisfaction leads to greater organizational commitment and reduced intent to turnover.24,25 Moreover, organizations whose employees are more satisfied show better customer satisfaction and business unit performance.26
Investigations from lighting and from environmental and organizational psychology have provided this logical chain from lighting conditions to organizational productivity, but as yet no single lighting investigation has done so. As we noted previously, carefully designed field investigations over the long term are the best hope for addressing the longstanding questions about the value to organizations of investments in higher quality lighting. Such studies should address energy consumption as well as the effects of the lighting on occupants, reflecting the definition of lighting quality as the intersection of individual needs, architectural form, and external conditions (energy, environment, and economics).2,3 Practical implementation is likely only if beneficial effects on human performance, behaviour, health and well-being are coupled with savings in energy and reductions in carbon emissions.
5.0 Practical Implications
Given the mounting evidence that lighting conditions matter to individuals and to organizations, what lighting conditions are recommended? These two experiments provide some guidance. Lighting conditions that support employees should achieve high task visibility and favourable appraisals of lighting quality, a response that involves the illuminance provided, the control of glare and the appearance of the space. Based on these experiments, carefully designed direct-indirect lighting systems, particularly those offering control over the direct component, are most likely to meet both of these goals. Detailed implications for systems with individual control were discussed by Boyce et al.16 Occupancy sensors, daylight harvesting, and individual control together with a workstation specific direct-indirect lighting systems can result in energy savings of up to 70% over a conventional fixed recessed parabolic louvered luminaire installation.27
6.0 References
1 Loe DL, Rowlands E. The art and science of lighting: a strategy for lighting design. Lighting Research and Technology 1996; 28(4):153-64.
2 Veitch JA, Julian W, Slater AI. A framework for understanding and promoting lighting quality. J. A. Veitch, Ed. Proceedings of the First CIE Symposium on Lighting Quality . Vol. CIE-x015-1998 . Vienna, Austria: Commission Internationale de l'Eclairage Central Bureau, 1998: 237-41. 3 Illuminating Engineering Society of North America (IESNA). Lighting handbook: Reference &
application. 9th edition. New York: Illuminating Engineering Society of North America, 2000. 4 Boyce PR, Veitch JA, Newsham GR et al. Lighting quality and office work: Two field simulation
experiments. Lighting Research and Technology 2006; 38(3):191-223.
5 Wyon DP. Indoor environmental effects on productivity. In: Teichman KY, Ed. Proceedings of IAQ '96: Paths to Better Building Environments. Atlanta, GA: American Society of Heating,
Refrigerating, and Air Conditioning Engineers, 1996: 5-15.
6 Rea MS, Ouellette MJ. Relative visual performance: A basis for application. Lighting Research and Technology 1991; 23(3):135-44.
7 Wibom RI, Carlsson LW. Work at video display terminals among office workers. In: Knave B, Wideback PG, Eds. Work with Video Display Units 86. Amsterdam, the Netherlands: Elsevier Science, 1987: 357-67.
8 Flynn JE, Hendrick C, Spencer T, Martyniuk O. A guide to methodology procedures for measuring subjective impressions in lighting. Journal of the Illuminating Engineering Society 1979; 8: 95-110. 9 Eklund NH, Boyce PR, Simpson SN. Lighting and sustained performance. Journal of the
Illuminating Engineering Society 2000; 29(1):116-30.
10 Eklund NH, Boyce PR, Simpson SN. Lighting and sustained performance: Modeling data-entry task performance. Journal of the Illuminating Engineering Society 2001; 30(2):126-40.
11 Baron RA, Rea MS, Daniels SG. Effects of indoor lighting (illuminance and spectral distribution) on the performance of cognitive tasks and interpersonal behaviors: The potential mediating role of positive affect. Motivation and Emotion 1992; 16(1):1-33.
12 Newsham GR, Veitch JA. Lighting quality recommendations for VDT offices: A new method of derivation. Lighting Research and Technology 2001; 33:97-116.
13 Bandura A. Self-efficacy mechanism in human agency. American Psychologist 1982; 37(2):122-47. 14 Barnes RD. Perceived freedom and control in the built environment. In: Harvey JH, Ed. Cognition,
social behavior, and the environment. Hillsdale, NJ: Erlbaum, 1981: 409-22.
15 Becker FD. Quality of Work Environment (QWE): Effects on office workers. Prevention in Human Services 1985-1986; 4(1-2):35-57.
16 Boyce PR, Veitch JA, Newsham GR et al. Occupant use of switching and dimming controls in offices. Lighting Research and Technology 2006; 38(4):358-78.
17 Boyce PR, Veitch JA, Newsham GR, Myer M, Hunter C. Lighting quality and office work: A field simulation study. Richland, WA, USA: Pacific Northwest National Laboratory, 2003; PNNL 14506. 18 Baron RM, Kenny DA. The moderator-mediator variable distinction in social psychological research:
Conceptual, strategic, and statistical considerations. Journal of Personality and Social Psychology 1986; 51(6):1173-82.
19 Cohen J. Statistical power analysis for the behavioral sciences. 2nd edition. Hillsdale, NJ: Erlbaum, 1988.
20 Illuminating Engineering Society of North America (IESNA). American national standard practice for office lighting. New York: IESNA, 1993; ANSI/IESNA-RP-1-1993.
21 Byrne BM. Structural equation modeling with EQS and EQS/Windows: Basic concepts, applications, and programming. Thousand Oaks, CA: Sage Publications, 1994.
22 Kline RB. Principles and practice of structural equation modeling. New York: Guilford Press, 1997. 23 Veitch JA, Charles KE, Farley KMJ, Newsham GR. A model of satisfaction with open-plan office
conditions: COPE field findings. Journal of Environmental Psychology 2007; 27(3):177-89.
24 Carlopio JR. Construct validity of a physical work environment satisfaction questionnaire. Journal of Occupational Health Psychology 1996; 1:330-44.
25 Wells MM. Office clutter or meaningful personal displays: The role of office personalization in employee and organizational well-being. Journal of Environmental Psychology 2000; 20:239-55. 26 Harter JK, Schmidt FL, Hayes TL. Business-unit-level relationship between employee satisfaction,
employee engagement, and business outcomes: A meta-analysis. Journal of Applied Psychology 2002; 87(2):268-79.
27 Galasiu AD, Newsham GR, Suvagau C, Sander DM. Energy saving lighting control systems for open-plan offices: a field study . Leukos 2007; 4(1):7-29.
28 Veitch JA, Newsham GR, Boyce PR, Jones CC. Office lighting appraisal, performance, and well-being: A linked mechanisms map. In. Proceedings of the 26th Session of the Commission Internationale de l'Eclairage, Beijing, China, 4-11 July 2007. Vienna, Austria: CIE, 2007: D3-61 - D3-64.
7.0 Acknowledgements
This investigation was supported by the Light Right Consortium, managed by Pacific Northwest National Laboratory, through contracts to Rensselaer Polytechnic Institute’s Lighting Research Center and the National Research Council of Canada Institute for Research in Construction (NRC-IRC). This phase of the Light Right Consortium was supported by the Alliance to Save Energy, the Illuminating Engineering Society of North America, the International Association of Lighting Designers, the International Facility Management
Association, Johnson Controls, the National Electrical Manufacturers Association, the New York State Energy Research and Development Authority, Steelcase, Inc., the US Department of Energy, and the US Environmental Protection Agency. The Light Right Consortium and the researchers gratefully acknowledge the contributions of lighting equipment provided by
Birchwood Lighting, Cooper Lighting, Day-Brite Lighting, Engineered Lighting Products, General Electric Lighting, Ledalite Architectural Products, Lightolier, Lutron, Osram Sylvania, Peerless Lighting, and Philips Lighting. Furnishings were provided by Armstrong World Industries Inc.
and Steelcase, Inc.
The researchers would like to thank James Benya (Benya Lighting Design), Judi Heerwagen (Heerwagen & Associates), Naomi Miller (Naomi Miller Lighting Design), Leslie Nicholls (PNNL), and Michael White (Johnson Controls) for their contributions to the project. Other staff at the NRC-IRC who contributed to this project were Chantal Arsenault, Cara Donnelly, Roger Marchand, and Clinton Marquardt. The researchers are grateful to staff from the NRC Institute for Information Technology who assisted with the development of cognitive performance tasks: Berry De Bruijn, Alain Désilets, Joel Martin, and Peter Turney. At the Lighting Research Center, Owen Howlett, Claudia Hunter, Martin Overington and Michael Myer also contributed. Myriam Aries (NRC-IRC) provided helpful comments on an earlier version of the manuscript.
A brief version of this paper was presented at the 26th Session of the Commission Internationale de l’Eclairage, Beijing, China, July 4-11, 2007.28
Table 1. Characteristics of lighting installations in both experiments.
Experiment 1 Experiment 2
Base Case 1 Best Practice 1 Best Practice +
Switching Control
Dimming Control Base Case 2 Best Practice 2
Cubicle Area Luminaire 3-lamp, 18-cell, 76 mm deep, semi-specular, recessed, parabolic-louvered continuous suspended direct / indirect, 400 mm below ceiling
same as Best Practice 1 1200 mm, 3 lamp suspended direct / indirect, 1 lamp indirect, 2 lamps direct 3-lamp, recessed, prismatic lenses Same as Best Practice 1, but dimmed to 400 lx
Layout regular array 5 rows co-ordinated to
furnishings & architecture
same as Best Practice 1
centred on workstation
Same as Base Case 1 Same as Best Practice 1 Lamp 32W T8, CCT=3500 K, CRI=82 1200 mm, 54W, T5 HO, CCT =3,500K, CRI = 85
same as Best Practice 1
1200 mm, 54W, T5 HO, CCT =3,500K, CRI =
85
Same as Base Case 1
Same as Best Practice 1
Ballast electronic dimming electronic dimming electronic dimming electronic dimming Same as Base Case 1 Same as Best Practice 1 Switchable Desk Lamp - - luminous shade, 40W 2D CFL (CCT = 3,500K and CRI = 82) switchable to 0W, 13W, 26W and 37W levels - - - Individual Control - - - Direct only: 0 - 100 % through computer interface - - Perimeter Wall-washing - track-mounted linear luminaires, one 50W 600 mm twin tube CFL (CCT = 3,500K, CRI = 82)
same as Best Practice 1
same as Best Practice 1
- same as Best Practice 1
Corridor same as cubicles fully indirect same as Best Practice 1
same as Best Practice 1
same as Base Case 1 same as Best Practice 1 Conference Room same parabolic as cubicles
same direct / indirect as cubicles
same as Best Practice 1
same as Best Practice 1
same as Base Case 1
same as Best Practice 1
Entrance area - - - 13 CFL recessed
downlights, four-pin, 32W triple tube CFL (CCT =3,500 K, CRI = 82), plus 3 desk lamps (26 W setting) - -
Table 2. Appraisal path results.
Ex1BG Ex1RM Ex2
N=151 N=36 N=80
Link 1: Appraisal → Preference → Mood BLQ BAttract R2 BLQ BAttract R2 BLQ BAttract R2
1 LQ → Attract 9.07** 0.22** 8.46** 0.23** 5.48** 0.09**
2 LQ → Pleas 0.58** 0.09** 1.03** 0.30** 0.77** 0.21**
3 LQ + Attract → Pleas 0.17 0.05** 0.25** 0.54* 0.06** 0.53** 0.57** 0.04** 0.35** Link 2: Preference → Mood → Health &
Well-being
Link 2a: Discomfort BAttract BPleas R2 BAttract BPleas R2 BAttract BPleas R2
1 Attract → Pleas 0.05** 0.24** 0.07** 0.46** 0.05** 0.25** 2 Attract → Discom -0.21** 0.16** -0.25* 0.13* -0.12* 0.06* 3 Attract + Pleas → Discom -0.13** -1.64** 0.23** -0.06 -2.56 0.22* -0.02 -2.09** 0.18** Link 2b: Environmental Satisfaction BAttract BPleas R2 BAttract BPleas R2 BAttract BPleas R2
1 Attract → Pleas 0.05** 0.24** 0.07** 0.46** 0.05** 0.25**
2 Attract → EnvSat 0.02** 0.23** 0.03** 0.43** 0.02** 0.26**
3 Attract + Pleas → EnvSat 0.02** 0.10** 0.26** 0.01 0.20** 0.56** 0.02** 0.01 0.26 Link 2c: Performance Satisfaction BAttract BPleas R2 BAttract BPleas R2 BAttract BPleas R2
1 Attract → Pleas 0.05** 0.24** 0.07** 0.46** 0.05** 0.25** 2 Attract → PerfSat 0.01** 0.05** 0.02** 0.17** 0.01* 0.05* 3 Attract + Pleas → PerfSat 0.00 0.15** 0.12** -0.00 0.28** 0.36** 0.00 0.15** 0.16**
Note. * p<.05. **p<.01 or better. Bvar are the unstandardized regression coefficients for the subscripted variable name in that regression. Blank cells for B occur for variables not in that equation. R2 values are the proportion of variance explained by the overall equation. Link numbers are used to facilitate text references to the sets of mediation analyses. Mediation is demonstrated when all three regressions in a link are statistically significant, and the coefficient for the
antecedent variable is smaller in the third step of the link than in the second 18. If mediation is complete, then the antecedent variable may have a coefficient of 0 in the third step; otherwise, mediation is partial, and there is also a direct path from the antecedent variable to the outcome. Sets of three shaded boxes
Table 3. Cross-linkage results.
Ex1BG Ex1RM Ex2
N=151 N=36 N=80
Link 3: Appraisal → Visual Discomfort → Visual Capabilities
BLQ BVDCom R2 BLQ BVDCom R2 BLQ BVDCom R2
1 LQ → VDCom -2.46** 0.18** -3.55** 0.28** -2.7** 0.25**
2 LQ → Visib -0.06* 0.03* -0.11 0.06 -0.02 0.00
3 LQ + VDCom→ Visib -0.07* -0.00 0.03 -0.14 -0.01 0.08 -0.09 -0.03** 0.10** Link 4: Visual Discomfort → Visual Capabilities
→ Competence BVDCom BVisib R
2 B
VDCom BVisib R2 BVDCom BVisib R2
1 VDCom → Visib 0.00 0.00 0.00 0.00 -0.02* 0.06*
2 VDCom → EComp -0.03 0.02 -0.04 0.04 -0.03 0.02
3 VDCom + Visib → EComp -0.02 -0.16 0.02 -0.04 0.07 0.04 -0.04 -0..23 0.03 Link 5: Preference → Mood → Motivation BAttract BPleas R2 BAttract BPleas R2 BAttract BPleas R2
1 Attract —> Pleas .05** 0.24 0.07** 0.46 0.05** 0.25**
2 Attract —> Motiv -2.63** 0.05** -3.66 0.09 -4.08** 0.10** 3 Attract + Pleas —> Motiv -2.64* 0.28 0.05* -7.02** 46.14 0.18* -4.85** 16.56 0.11** Link 6: Mood → Motivation → Task
Performance
Link 6a: Rest Breaks BPleas BMotiv R2 BPleas BMotiv R2 BPleas BMotiv R2
1 Pleas → Motiv -12.76 0.01 1.43 0.00 -9.37 0.00
2 Pleas → SumBrk -0.03 0.01 -0.04 0.02 0.07* 0.06*
3 Pleas + Motiv → SumBrk -0.02 0.001** 0.12** -0.04 0.001 0.11 0.07* 0.00 0.06 Link 6b: Vigilance BPleas BMotiv R2 BPleas BMotiv R2 BPleas BMotiv R2
1 Pleas → Motiv -12.76 0.01 1.43 0.00 -9.37 0.00
2 Pleas → ESpd 0.01 0.01 -0.002 0.00 -0.01 0.00
3 Pleas + Motiv → ESpd 0.01 0.00 0.01 -0.002 -0.000 0.01 -0.01 -0.00 0.04 Link 6c: Typing BPleas BMotiv R2 BPleas BMotiv R2 BPleas BMotiv R2
1 Pleas → Motiv -12.76 0.01 1.43 0.00 -9.37 0.00
2 Pleas → Typing -0.08 0.01 -0.14 0.04 -0.12 0.02
3 Pleas + Motiv → Typing -0.07 0.001 0.04 -0.14 0.002 0.13 -0.12 0.00 0.02 Link 6d: Cognitive Speed BPleas BMotiv R2 BPleas BMotiv R2 BPleas BMotiv R2
1 Pleas → Motiv -12.76 0.01 1.43 0.00 -9.37 0.00
2 Pleas → CogSpd 0.11 0.01 0.23 0.02 -0.35* 0.06*
3 Pleas + Motiv → CogSpd 0.11 -0.00 0.01 0.24 -0.003 0.08 -0.35* -0.00 0.06 Link 6e: Cognitive Accuracy BPleas BMotiv R2 BPleas BMotiv R2 BPleas BMotiv R2
1 Pleas → Motiv -12.76 0.01 1.43 0.00 -9.37 0.00
2 Pleas → CogAcc -0.60* 0.03* -0.73 0.07 -0.63 0.04
3 Pleas + Motiv → CogAcc -0.43 0.01** 0.21** -0.75* 0.02** 0.47** -0.63 0.00 0.04
Note. * p<.05. **p<.01 or better. Bvar are the unstandardized regression coefficients for the subscripted variable name in that regression. Blank cells for B occur for variables not in that equation. R2 values are the proportion of variance explained by the overall equation. Link numbers are used to facilitate text references to the sets of mediation analyses. Mediation is demonstrated when all three regressions in a link are statistically significant, and the coefficient for the
antecedent variable is smaller in the third step of the link than in the second 18. If mediation is complete, then the antecedent variable may have a coefficient of 0 in the third step; otherwise, mediation is partial, and there is also a direct path from the antecedent variable to the outcome. There were no mediated effects in this set of analyses.
Table 4. Vision path results.
Ex1BG Ex1RM Ex2
N=151 N=36 N=80
Link 7: Visual capabilities→ Competence → Motivation
BVisib BEComp R2 BVisib BEComp R2 BVisib BEComp R2
1 Vision —> EComp -0.17 0.00 0.06 0.00 -0.10 0.00
2 Vision —> Motiv 130.54** 0.05** 25.06 0.00 25.40 0.00
3 Vision + EComp —> Motiv 132.22* 9.74 0.05* 25.93 -14.56 0.01 27.27 18.51 0.01 Link 8: Visual Discomfort → Visibility →
Task Performance
Link 8a: Rest Breaks BVDCom BVisib R2 BVDCom BVisib R2 BVDCom BVisib R2
1 VDCom → Visib 0.00 0.00 0.00 0.00 -0.02* 0.06*
2 VDCom → SumBrk 0.01 0.00 0.02 0.03 -0.02 0.04
3 VDCom + Visib→ SumBrk 0.00 0.20 0.02 0.31 0.01 0.07 -0.02 -0.12 0.05 Link 8b: Vigilance BVDCom BVisib R2 BVDCom BVisib R2 BVDCom BVisib R2
1 VDCom → Visib 0.00 0.00 0.00 0.00 -0.02* 0.06*
2 VDCom → ESpd -0.00 0.00 -0.00 0.00 0.00 0.00
3 VDCom + Visib→ ESpd -0.00 0.04 0.02 -0.00 -0.03 0.01 0.00 0.14** 0.11** Link 8c: Typing BVDCom BVisib R2 BVDCom BVisib R2 BVDCom BVisib R2
1 VDCom → Visib 0.00 0.00 0.00 0.00 -0.02* 0.06*
2 VDCom → Typing 0.00 0.00 -0.05 0.06 0.00 0.00
3 VDCom + Visib→ Typing -0.00 1.10** 0.11** -0.05 0.77 0.13 0.01 0.80* 0.05 Link 8d: Cognitive Speed BVDCom BVisib R2 BVDCom BVisib R2 BVDCom BVisib R2
1 VDCom → Visib 0.00 0.00 0.00 0.00 -0.02* 0.06*
2 VDCom → CogSpd 0.00 0.00 -0.08 0.03 0.08 0.03
3 VDCom + Visib→ CogSpd 0.00 0.70 0.01 -0.08 1.41 0.08 0.10* 1.29 0.07 Link 8e: Cognitive Accuracy BVDCom BVisib R2 BVDCom BVisib R2 BVDCom BVisib R2
1 VDCom → Visib 0.00 0.00 0.00 0.00 -0.02* 0.06*
2 VDCom → CogAcc 0.06 0.00 0.01 0.00 0.08 0.01
3 VDCom + Visib→ CogAcc 0.06 1.16 0.01 0.01 2.94 0.06 0.07 -0.10 0.01 Link 9: Competence → Motivation → Task
Performance
Link 9a: Rest Breaks BEComp BMotiv R2 BEComp BMotiv R2 BEComp BMotiv R2
1 ECcomp → Motiv 7.96 0.00 -14.39 0.01 18.19 0.01
2 EComp → SumBrk -0.06 0.02 -0.02 0.00 -0.00 0.00
3 EComp + Motiv → SumBrk -0.07* 0.001** 0.14** -0.01 0.001 0.09 -0.00 0.00 0.00 Link 9b: Vigilance BEComp BMotiv R2 BEComp BMotiv R2 BEComp BMotiv R2
1 ECcomp → Motiv 7.96 0.00 -14.39 0.01 18.19 0.01
2 EComp → ESpd 0.02 0.02 0.02 0.02 -0.03 0.04
3 EComp + Motiv → ESpd 0.02 0.00 0.02 0.02 -0.00 0.03 -0.03 -0.00 0.06 Link 9c: Typing BEComp BMotiv R2 BEComp BMotiv R2 BEComp BMotiv R2
1 ECcomp → Motiv 7.96 0.00 -14.39 0.01 18.19 0.01
2 EComp → Typing 0.05 0.00 -0.29 0.09 -0.13 0.01
Ex1BG Ex1RM Ex2
N=151 N=36 N=80
Link 9d: Cognitive Speed BEComp BMotiv R2 BEComp BMotiv R2 BEComp BMotiv R2
1 ECcomp → Motiv 7.96 0.00 -14.39 0.01 18.19 0.01
2 EComp → CogSpd 0.18 0.01 0.59 0.07 -0.26 0.02
3 EComp + Motiv → CogSpd 0.18 0.00 0.01 0.55 -0.003 0.11 -0.27 0.00 0.02 Link 9e: Cognitive Accuracy BEComp BMotiv R2 BEComp BMotiv R2 BEComp BMotiv R2
1 ECcomp → Motiv 7.96 0.00 -14.39 0.01 18.19 0.01
2 EComp → CogAcc -0.20 0.00 -0.83 0.04 -0.18 0.00
3 EComp + Motiv → CogAcc -0.31 0.01** 0.20** -0.60 0.02** 0.42** -0.19 0.00 0.00
Note. * p<.05. **p<.01 or better. Bvar are the unstandardized regression coefficients for the subscripted variable name in that regression. Blank cells for B occur for variables not in that equation. R2 values are the proportion of variance explained by the overall equation. Link numbers are used to facilitate text references to the sets of mediation analyses. Mediation is demonstrated when all three regressions in a link are statistically significant, and the coefficient for the
antecedent variable is smaller in the third step of the link than in the second 18. If mediation is complete, then the antecedent variable may have a coefficient of 0 in the third step; otherwise, mediation is partial, and there is also a direct path from the antecedent variable to the outcome. There were no mediated effects for this set of analyses.
Table 5. Additional links results.
Ex1BG Ex1RM Ex2
N=151 N=36 N=80
Link 10: Preference → Motivation → Task Performance
Link 10a: Rest Breaks BAttract BMotiv R2 BAttract BMotiv R2 BAttract BMotiv R2
1 Attract → Motiv -2.63** 0.05** -3.66 0.09 -4.08** 0.10**
2 Attract → SumBrk -0.00 0.02 -0.01 0.03 0.004 0.02
3 Attract + Motiv→ SumBrk -0.00 0.001** 0.12** -0.004 0.001 0.10 0.01 0.00 0.03 Link 10b: Vigilance BAttract BMotiv R2 BAttract BMotiv R2 BAttract BMotiv R2
1 Attract → Motiv -2.63** 0.05** -3.66 0.09 -4.08** 0.10**
2 Attract → ESpd 0.00 0.01 0.00 0.00 -0.00 0.00
3 Attract + Motiv→ ESpd 0.00 0.00 0.01 0.00 -0.00 0.00 -0.00 -0.00 0.04 Link 10c: Typing BAttract BMotiv R2 BAttract BMotiv R2 BAttract BMotiv R2
1 Attract → Motiv -2.63** 0.05** -3.66 0.09 -4.08** 0.10**
2 Attract → Typing -0.01** 0.04** -0.02 0.07 -0.01 0.02
3 Attract + Motiv→ Typing -0.01* 0.00 0.05* -0.01 0.001 0.12 -0.01 -0.00 0.02 Link 10d: Cognitive Speed BAttract BMotiv R2 BAttract BMotiv R2 BAttract BMotiv R2
1 Attract → Motiv -2.63** 0.05** -3.66 0.09 -4.08** 0.10**
2 Attract → CogSpd 0.00 0.00 0.04 0.06 -0.04** 0.09**
3 Attract + Motiv→ CogSpd -0.00 -0.00 0.00 0.03 -0.002 0.09 -0.04** -0.00 .10* Link 10e: Cognitive Accuracy BAttract BMotiv R2 BAttract BMotiv R2 BAttract BMotiv R2
1 Attract → Motiv -2.63** 0.05** -3.66 0.09 -4.08** 0.10**
2 Attract → CogAcc -0.07** 0.04** -0.15** 0.23** 0.00 0.00
3 Attract + Motiv→ CogAcc -0.04 0.01** 0.21** -0.10* 0.01** 0.49** 0.01 0.00 0.00
Note. * p<.05. **p<.01 or better. Bvar are the unstandardized regression coefficients for the subscripted variable name in that regression. Blank cells for B occur for variables not in that equation. R2 values are the proportion of variance explained by the overall equation. Link numbers are used to facilitate text references to the sets of mediation analyses. Mediation is demonstrated when all three regressions in a link are statistically significant, and the coefficient for the
antecedent variable is smaller in the third step of the link than in the second 18. If mediation is complete, then the antecedent variable may have a coefficient of 0 in the third step; otherwise, mediation is partial, and there is also a direct path from the antecedent variable to the outcome. Sets of three shaded rows
Figure 1. Proposed linked mechanisms map.
Figure 2. Final linked mechanisms map, showing lighting condition test results with dotted lines, and mediated regression test results with solid lines. Heavy solid
lines show the Appraisal path, and black solid lines with double-headed arrows show the Vision path. The light grey solid lines show extra links, with small effect
Comment 1
G Tonello (Universidad Nacional de Tucuman, Facultad de Ciencias Exactas y Tecnología,
Departamento de Luminotecnia, Luz y Visión, Avenida Independencia 1800 - 4000 San Miguel de Tucumán, ARGENTINA).
This paper demonstrates that lighting researchers are beginning to widen their outlook by considering other factors than light itself. The authors have adopted methods from related fields, such as architectural or environmental psychology. In addition to visual comfort and performance, their model includes environmental aesthetics and the psychological mood of the participants. In my opinion this constitutes an improvement compared to previous lighting research that, for too long, has been an isolated field. Actually, David Wyon, who is cited as the creator of the linked mechanisms maps employed by the authors, was a pioneer in this respect, studying in his laboratorythe combined impact of heat and lighting.
The authors have taken great care trying to simulate real life conditions by hiring participants from an office agency, and letting them work for at least one full day. Furthermore about 15 different measures were employed and analysed in a number of mediated regression analyses. The results consistently show that people who are satisfied with their lighting consider their working space to be more attractive, and feel happier and more satisfied. The authors claim that this is the first study where the complete path from lighting to feelings of health and well-being has been demonstrated. This may well be so. However, the laboratory situation itself puts certain limitations on the outcome.
Most environmental psychologists today will agree that the identification of a research problem should start in the real world, which could then be brought into the laboratory for detailed scrutiny.
Another aspect that I would like to point to is the difference between open plan and cell offices. Several studies have shown that single room occupancy generally gives more satisfied employees than are found in landscape offices. This indicates that it might also be important to include the psychosocial climate of the workplace in this kind of research.
Comment 2
L Bedocs (Lighting Applications Director, Thorn Lighting Ltd, Merrington Lane Industrial Estate,
SPENNYMOOR, County Durham, DL16 7UR, UK)
This is an interesting paper describing a clever technique for reviewing the results and their interpretation by the relatively new technique of “Linked Mechanism Approach”. The
overriding conclusion that lighting quality contributes much to productivity is very important and I am delighted to concur with the authors. I can endorse this finding from our own studies during the developing our “Performance, Efficiency and Comfort” (PEC) programme aimed to drive quality lighting into all application areas whilst ensuring satisfactory visual performance, economy and sustainable environment.
The linked mechanism approach is rather complex in application and I wonder if it truly represents our behaviour. I would like to know if the authors share my view that lighting can positively change the mood and motivation of people through light stimulation.
However, health and well-being of people attributed to lighting needs more than just good quality lighting. People need higher luminance, of acertain spectrum of light, with
controlled duration of exposure and I believe they must have had an adequate quality of sleep the night before. People located close to windows admitting substantial daylight receive these conditions. Would the authors agree that such evaluations from short duration temporary workers will not show up differences or indicate long-term feelings of workers adequately, and
these findings can only be treated as indicative for firm recommendations. Do we not need studies of much longer duration?
Empowering workers to control their lights is very practical for small offices but this may not be accepted in multi occupancy open office areas. Would the authors comment on how much the lighting in one workstation influenced the lighting of others located in the same place or were the lights only controlled on arrival and departure of staff and there was no flexible (random presence) attendance in work time.
I wonder if the concluding remark by the authors is valid. Clearly all the trial schemes have been designed to conform to current lighting recommendations. Surely the difficulty in the extraction of anadequate degree of differentiation is good news as this shows that we have the right recommendations. In the absence of any lighting related discomfort such subjective evaluations are limited from short duration studies. Would the authors be able to predict as to when and how we could find the onset of dissatisfaction working in these various lit
environments?
Reply to comments by J. A. Veitch, G. R. Newsham, P. R. Boyce, and C. C. Jones
We thank both reviewers for their kind comments. As we said in the Discussion, we fully agree with the obervation that one limitation of the laboratory approach is that simulation
inevitably lacks some of the characteristics of real offices.
The model we tested for lighting may be a specific instance of a more general model of workplace conditions influencing well-being. Aries et al.1 found that occupants of shared offices in the Netherlands who judged their lighting to be of higher quality reported fewer problems with lighting or temperature impeding their work. All occupants had window views. Both the quality and the content of the view influenced office impressions, as did the number of people in the shared office. When office impressions were more favourable, occupants reported fewer
symptoms of physical or psychological discomfort, and when discomfort was lower, sleep quality was better. The general form of the model is similar to the one we have reported here, although the operationalization of each variable is different.
The linked mechanisms analyses reported here were indepedent of lighting system. However, to address Mr. Bedocs’ question concerning individual control: For the Dimming Control condition, the effect on the desk illuminance in a cubicle when the lighting of the adjacent cubicle was changed from zero to full light output of the downward component was to increase it by 85 lx. Most people did not change their settings after making a choice in the morning.2 The NRC-IRC group studied a field installation of a workstation-specific direct-indirect lighting system in an open-plan area with 5’ panels around each cubicle.3 The indirect
component was on at a fixed level from 7:30 – 17:00 daily; the direct component was controlled by occupancy sensors, light sensors for daylight harvesting, and individual controls. Over a year of monitoring there were no complaints of distraction associated with changing light levels from adjacent cubicles. Surveys at three times during the year revealed that the system was very satisfactory (a paper on the survey data is in preparation).
If by “light stimulation”, Mr. Bedocs is referring to physiological consequences of light exposure during the day (similar to the role of light exposure at night influencing the alertness of night-shift workers), we believe the jury is still out. If, however, he means that lighting can create a visually interesting place, then we believe that this is precisely the mechanism identified in our linked mechanisms map.
The Base Case conditions in these two experiments were rated as comfortable by 70% of the participants, which is consistent with normative data from occupants of real offices.4 Thus, the minimum level of lighting appraisals in the linked mechanisms analyses here could be considered “good enough”. The Dimming Control condition was rated as comfortable by ~90%
of participants. The linked mechanisms analysis demonstrates that changes to the lighting installation that improve lighting appraisals up from “good enough” result in improvements to individuals’ health and well-being. Such improvements – subject to confirmation in field studies – should result in benefits to the organizations that employ them.
References
1 Aries MBC, Veitch JA, Newsham GR. Physical and psychological discomfort in the office environment. Paper presented at the Light and Health Research Foundation (SOLG) Conference. Eindhoven, the Netherlands, November 8, 2007.
2 Boyce PR, Veitch JA, Newsham GR, Myer M, Hunter C. Lighting quality and office work: A field simulation study. Richland, WA, USA: Pacific Northwest National Laboratory, 2003; PNNL 14506. Available at http://irc.nrc-cnrc.gc.ca/fulltext/b3214.1/.
3 Galasiu AD, Newsham GR, Suvagau C, Sander DM. Energy saving lighting control systems for open-plan offices: a field study . Leukos 2007; 4(1):7-29.
4 Boyce PR, Veitch JA, Newsham GR et al. Lighting quality and office work: Two field simulation experiments. Lighting Research and Technology 2006; 38(3):191-223.