Publisher’s version / Version de l'éditeur:
Questions? Contact the NRC Publications Archive team at
[email protected]. If you wish to email the authors directly, please see the first page of the publication for their contact information.
https://publications-cnrc.canada.ca/fra/droits
L’accès à ce site Web et l’utilisation de son contenu sont assujettis aux conditions présentées dans le site LISEZ CES CONDITIONS ATTENTIVEMENT AVANT D’UTILISER CE SITE WEB.
Research Report (National Research Council of Canada. Institute for Research in Construction), 2009-03-31
READ THESE TERMS AND CONDITIONS CAREFULLY BEFORE USING THIS WEBSITE. https://nrc-publications.canada.ca/eng/copyright
NRC Publications Archive Record / Notice des Archives des publications du CNRC : https://nrc-publications.canada.ca/eng/view/object/?id=5dccdb53-0795-4b8c-a1f7-19abebb275c8 https://publications-cnrc.canada.ca/fra/voir/objet/?id=5dccdb53-0795-4b8c-a1f7-19abebb275c8
NRC Publications Archive
Archives des publications du CNRC
For the publisher’s version, please access the DOI link below./ Pour consulter la version de l’éditeur, utilisez le lien DOI ci-dessous.
https://doi.org/10.4224/20374496
Access and use of this website and the material on it are subject to the Terms and Conditions set forth at
Evaluations of new speech security quick test
http://irc.nrc-cnrc.gc.ca
Eva luat ions of ne w spe e ch se c urit y
quick t e st
R R - 2 7 9
B r a d l e y , J . S . ; G o v e r , B . N .
M a r c h 3 1 , 2 0 0 9
The material in this document is covered by the provisions of the Copyright Act, by Canadian laws, policies, regulations and international agreements. Such provisions serve to identify the information source and, in specific instances, to prohibit reproduction of materials without
written permission. For more information visit http://laws.justice.gc.ca/en/showtdm/cs/C-42
Les renseignements dans ce document sont protégés par la Loi sur le droit d'auteur, par les lois, les politiques et les règlements du Canada et des accords internationaux. Ces dispositions permettent d'identifier la source de l'information et, dans certains cas, d'interdire la copie de
Evaluations of
New Speech Security Quick Test
J.S. Bradley and B.N Gover
IRC Report RR-279
31 March 2009
Summary
This report presents extensive laboratory measurements to evaluate a new speech security quick test intended to provide accurate estimates of the results of the full speech security test (ASTM E2638-08). The proposed new quick test procedure would measure level differences from a calibrated source on one side of a wall to a spot receiver 0.25 m from the other side of the wall as illustrated in Fig. A.
The measurement results in this report evaluated the effects of various parameters on the results of the quick test
procedure and compared them to those obtained using the full speech security test. The comparisons included
measurements of a typical wall construction and the same wall with 2 variations of a door included. The tests also included systematic variations of the sound absorption in the test rooms.
The quick test procedure resulted in lower measured level difference values than the full test procedure and the differences varied with the amount of room absorption.
However, the differences did not vary greatly over frequency and this was particularly true when a dodecahedron loudspeaker was used.
h
d
sd
mtest wall
microphone loudspeaker
Fig. A. Source and receiver positions for the new quick test procedure.
By correcting for the effects of room absorption, it was possible to provide quite accurate predictions of the level differences (LD), averaged over frequency, obtained from the full test. For tests using a dodecahedron loudspeaker, the RMS difference between the
predicted and measured LD(avg) values was only 0.56 dB, which increased to 1.46 dB when a directional source was used.
Differences between the two measurement approaches can be larger at individual 1/3-octave band frequencies, but agreement was again better for predictions from quick test measurements made using a dodecahedron loudspeaker. Fig. B illustrates the agreement possible between predicted and measured level differences for the wall-with-no-door construction in the upper panel and for the wall-with-a-door in the lower panel. For the constructions and room absorption conditions tested, the RMS differences of the 1/3-octave band measurements varied between 1 and 2 dB depending on the loudspeaker type, construction details and room absorption.
Additional investigations showed that another variation the quick test approach could be applied to measuring the sound transmission loss characteristics of installed doors in field
250 500 1000 2000 4000 0 10 20 30 40
Wall with Door Predicted Pos. #5 Measured Pos. #5 LD( f) , dB Frequency, Hz 20 30 40 50 60 Wall No Door Predicted Pos. #5 Measured Pos. #5 LD (f )
Fig. B. Example comparisons of predicted and measured full test LD(f) values for a wall with
no door (upper) and for a wall with a door (lower).
It was also demonstrated that impulse response measurement software could be adapted to provide a more efficient but equally accurate approach to making quick test measurements. With the ability to provide immediate results, this approach could be a useful tool for assessing and diagnosing speech security problems in situ.
Evaluations of the quick test procedure for a broader range of combinations of doors and walls are required to more generally establish the accuracy of the approach.
Table of Contents
page Summary 1 Table of Contents 3 Acknowledgements 4 1. Introduction 5 2. Experimental Details 83. Standard Test Results of Experimental Conditions 11
3.1 Test room sound absorption 11
3.2 Sound transmission loss (TL) of test constructions 12
4. Full Speech Security Test (FSST) Results 16
4.1 Effects microphone height at receiving points 16
4.2 Effects of loudspeaker directionality and test room absorption 18
on LD(f) and TL(f) comparisons 4.3 Variations of LD(avg) values along the walls 23
4.4 Spectral variations of LD(f) along the test wall 27
5. Evaluation of an Alternative Full Test 31
6. Comparison of Quick Test and Full Test Results 34
6.1 Parameters varied in the comparisons 34
6.2 Effects of receiver height on quick test results 34
6.3 Effects of source-to-test-wall distance on LD(f) values 37
6.4 Spectral variations along the test wall 44
6.5 Effect of source-to-wall distance on LD(avg) values 49
7. Predicting Full Test Level Differences from Measured Quick Test 52
Level Differences 7.1 Quantifying Effects of varied room absorption 52
7.2 Predicting full test LD(avg) values from quick test LD(avg) values 54
7.3 Predicting full test LD(f) values from quick test LD(f) values 56
8. Investigation of Impulse Response Measurements for Quick Test 60
9. An Alternative Quick Test Procedure 9.Conclusions 62
10. Summary and Conclusions 64
Appendix I. Loudspeakers Data 66
Appendix II. Effect of Loudspeaker Directionality and Number of Positions 68
on the Full Speech Security test (FSST) Results Appendix III. Adapting the Quick Test to Measure Sound Transmission Loss 73
of Doors in the Field References 81
Acknowledgements
The assistance of Mr. Markus Müller-Trapet, who made the measurements and initial analyses of the results reported here is gratefully acknowledged. The research was jointly funded by the Royal Canadian Mounted Police (RCMP) and the National Research Council, Institute for Research in Construction (NRC-IRC).
1. Introduction
A number of previous studies [1-6] have led to the development of a new speech security assessment procedure for measuring the speech privacy of closed rooms [7]. The new method is different than standard sound transmission loss tests between rooms [8]. As illustrated in Fig. 1(a), a conventional sound transmission loss test measures room-average levels of a test sound using multiple microphone positions in both source and receiving rooms, and multiple loudspeaker positions in the source room. With the addition of reverberation time measurements in the receiving space, the average sound transmission loss between the two spaces can be calculated.
The new speech privacy test [7] measures the attenuation of speech sounds in terms of the level differences between an average source room level and the levels at spot receiver
positions 0.25 m from the separating wall in the
receiving space (see Fig 1(b)). A room average is used in the source room because the talker could be anywhere in the source room. The receiver is located at positions 0.25 m from the test wall because: (a) these represent more sensitive positions for eavesdroppers, (b) they don’t require the receiving space to have a diffuse field, and (c) they make it possible to measure variations in the attenuation of speech sounds to detect weak points in the sound insulation such as near doors. (a) Transmission loss test
(b) Speech privacy test
(c) Speech privacy quick test
Source room Receiving room
Spot receiver
Source room
Source room
Receiving room
Receiving room
Fig. 1. Comparison of measurement approaches for: (a) conventional transmission loss test[8], (b) new speech privacy test [7], and proposed Speech Privacy Quick
The new speech privacy test can more accurately assess the speech privacy afforded by a closed room. However, for the most accurate results it can be time consuming. In some cases, a less precise test would be adequate. For example, the speech privacy of most meeting rooms is limited by sound leaks through doors and door seals. There is often no need to precisely evaluate the
problem of the door can be rectified. Alternatively, if a room has been evaluated and a door found to be a problem, it is desirable to be able to quickly evaluate improvements to the door without retesting the complete room.
The proposed speech security/privacy quick test would measure attenuations between a loudspeaker 1 m from one side of a wall to a measurement point 0.25 m from the other side of the wall (see Fig. 1(c) and Fig. 2). The output of the test loudspeaker would first be measured in free field conditions at a distance of 1 m. This same level of the test signal would be used as the source level in the measurements of sound transmission through the element to be tested and the transmitted levels would be measured 0.25 from the element in the receiving space.
h
d
sd
mtest wall
microphone loudspeaker
Fig. 2. Measurement setup for the new speech security quick test procedure. Source-to-wall distance, dS, microphone-to-wall distance dm (always 0.25 m) and source and
receiver height, h.
Calibrating the output of the source in free field conditions avoids the large errors that can occur when trying to measure the source levels close to several reflecting surfaces such as the floor and the test wall and possibly others. Previous procedures have included measurement of the source output between the source and the wall in the source room. This was shown to lead to large variations between that method and the complete speech privacy test of ±8 dB or more [3].
The new work described in this report was primarily intended to determine if the
proposed quick test procedure could be used to obtain measures of the speech privacy of closed rooms that would closely approximate the results of the complete speech privacy test. This included determining the effects of various parameters on the test results and how best to optimise the proposed quick test to obtain the best estimates of the expected result from a complete speech privacy test of the same situation.
Some additional investigations were also carried out. These included initial investigations of the feasibility of an efficient computer based measurement system to perform the quick test. These tests used the new SPMSoft program [9, 10] for measuring speech
Since many full speech privacy tests were carried out as part of this work the results were used to re-consider the adequacy of a minimum of 2 source positions currently included in the ASTM standard [7]. The accuracy of predictions of sound transmission loss values from the level differences obtained in the complete speech privacy were re-considered and the results included in this report in Appendix II.
Appendix III presents an evaluation of using a variation of the quick test procedure to estimate the sound transmission loss characteristics of installed doors in field conditions.
2. Experimental Details
The experimental studies in this report were carried in the wall sound transmission loss suite in building M27 of NRC-IRC. This consists of two reverberation chambers with a large (12’ by 8’) opening between them into which walls can be constructed to measure their sound transmission characteristics. The large chamber has a volume of 250 m3 and the small chamber a volume of 140 m3. Walls are constructed in massive test frames that can be rolled into place between the two chambers and sealed in place with pneumatic seals.
Each reverberation chamber includes 4 loudspeakers for producing test sounds driven by independent noise generators. There is also a robot microphone system in each chamber so that the microphone can be moved automatically under computer control to each measurement position. For standard sound transmission loss tests carried out according to the ASTM E90 procedure, sound levels are measured at 9 independent positions in each chamber and level differences between the source and receiving rooms calculated. After also measuring reverberation times in the receiving room, sound transmission loss (TL) values are calculated in 1/3-octave bands from 50 Hz to 6.3k Hz.
As the new experiments concerned speech security tests intended to evaluate conditions for meeting rooms, sound absorption was added to the reverberation chambers for some of the tests. The added sound absorption created conditions with reverberation times similar to meeting rooms and measured reverberations times for each absorption treatment are described in the following section of this report.
The complete speech security test, now described in ASTM E2638-08, involves
measuring room average levels in the source room and at positions 0.25 m from the test wall in the receiving space. To obtain accurate room average source room levels, measurements were usually made for 5 independent source positions in the current studies. For most of the speech security tests the large chamber was the source room because the robot microphone in the small chamber could then be used to measure the received levels at positions 0.25 m from the test wall. The received levels were measured at 26 positions 0.25 m from the test wall in the small chamber, arranged in two rows of 13 positions 1.2 and 1.5 m above the base of the test wall as illustrated in Fig. 3.
Four different constructions were measured for various purposes in the tests described in this report. The initial construction was a steel stud wall intended to be representative of many office walls. It was constructed of (92 mm) light-weight steel studs with one layer 13 mm gypsum board on each face and glass fibre batts in the cavity. The surface density of the gypsum board was 9.7 kg/m2. The measured sound transmission loss
characteristics and STC values are included in the following section.
After initial tests of the wall, a door was added to it to create a wall-with-a-door. Fig. 3 shows the steel studs included for the initial wall construction. The studs shown in the door opening were removed when the door was installed. The door was a solid core wood door with a surface density of 24.7 kg/m2 and was initially installed without door seals. Extensive testing was carried out for this condition of a door without seals in a typical office wall.
3.66 m
1.2 m 1.5 m 2.44 m
View from small chamber side.
1 2 3 4 5 6 7 8 9 10 11 12 13
Knob
Hinges
14 15 16 17 18 19 20 21 22 23 24 25 26
Fig. 3. Steel stud construction of 2.44 m by 3.66 m test wall showing location of door and the measurement positions along the wall. View is from small chamber to large chamber.
The door was subsequently improved by completely sealing it with metal tape. This was intended to represent a solid core door with near perfect seals.
Some later tests used what is described as a ‘patched’ wall in order to return to conditions similar to the original wall without a door. For this wall construction, the door and door frame were removed, the door opening was filled with glass fibre batts and one layer of 13 mm gypsum board was attached to each side of the wall to completely cover and extend past the door opening. As seen in the following section this had similar sound transmission characteristics to the original wall.
The speech security tests were carried out using two different types of loudspeaker. One was a dodecahedron loudspeaker, which included 12 drivers each 100 mm diameter and is intended to be an approximately omni-directional source. The other was a directional loudspeaker consisting of one 250 mm diameter driver in a vented rectangular box. These two loudspeakers are representative of the two extremes in possible test loudspeakers. Further details and measured directional radiation patters for both loudspeakers are included in Appendix I.
3. Standard Test Results of Experimental Conditions
3.1 Test room sound absorption
Most tests were carried out with one of three different amounts of sound absorbing material in the two test chambers. This made it possible to investigate various details of the speech security tests as a function of room acoustics conditions. The room absorption was varied by adding sound absorbing foam to both test chambers. The three absorption conditions are referred to as ‘no foam’ (NF), ‘half foam’ (HF) and ‘full foam’ (FF). ‘No foam’ was the most reverberant condition with no added sound absorption. ‘Full foam’ was the most absorptive case for which conditions were least reverberant and
approximately representative of typical meeting rooms. Fig. 4 shows the measured reverberation times versus frequency in the large chamber for the three absorption conditions and Fig. 5 shows similar results in the small chamber. Average reverberation times over the speech frequencies from 160 to 5k Hz were about 0.7 s for ‘full foam’ condition in both chambers.
0.0 1.0 2.0 3.0 4.0 63 125 250 500 1k 2k 4k 8k Frequency, Hz RT , s no foam half foam full foam
Fig. 4. Measured reverberation times in the large reverberation chamber for the 3 absorption conditions. 0.0 1.0 2.0 3.0 4.0 63 125 250 500 1k 2k 4k 8k Frequency, Hz RT , s no foam half foam full foam
Fig. 5. Measured reverberation times in the small reverberation chamber for the 3 absorption conditions.
3.2 Sound transmission loss (TL) of test constructions
Standard (ASTM E90) sound transmission loss (TL) measurements were made of all 4 test constructions and for all 3 absorption treatments to the test chambers. Fig. 6 shows the measured TL values for the wall without a door construction and for each of the 3 room absorption cases. There are very small variations with the changes in sound
other and no condition leads to increased or decreased TL values at all frequencies. The Rw rating for the half foam condition was 42 compared to 43 for the other conditions. The
STC value for all 3 conditions was 43.
10 15 20 25 30 35 40 45 50 55 60 65 63 125 250 500 1k 2k 4k Frequency, Hz Tr a ns m is s ion Los s , dB no foam half foam full foam
Fig. 6. Measured sound transmission loss versus frequency for the wall-with-no-door and for the 3 absorption conditions.
10 15 20 25 30 35 40 45 63 125 250 500 1k 2k 4k Frequency, Hz T ran smi ssi o n L o ss, d B no foam half foam full foam
Fig. 7. Measured sound transmission loss versus frequency for the wall-with-a-door and for the 3 absorption conditions.
Fig. 7 plots the measured TL versus frequency for the wall-with-a-door and for the 3 absorption cases. For the full foam and the no foam cases the STC and the Rw values
were all 31. For the half foam case the STC and Rw were both 30. For the half foam case,
Fig. 7 indicates that all TL values were approximately 1 dB lower than the other cases. This is thought to be due to removing test frame holding the wall with the door from the test chambers to accommodate other testing that used the other test frame. Although the test frame was moved back into place without changes to the wall-with-a-door, there may be some small differences in how the test frame was sealed in place between the two test chambers. This was unfortunate but does not affect any of the subsequent comparisons between the standard TL test results and various speech security test results because all testing on each construction was completed without any changes to the wall or test frame. The test frame was only moved once between the testing of different test conditions.
The wall with the door was re-tested after the door was completely sealed by taping the periphery to the door frame. This was intended to simulate very good door seals. Comparing the results in Figure 7 (with no seals) with those in Figure 8 (sealed door) shows that the TL was improved and improved most at higher frequencies when the door was sealed. The sealed door had STC and Rw values of 37 for all cases except the full
foam case for which the STC was 38 and the Rw 37.
The fourth construction is referred to as the ‘patched’ wall. For this wall construction, the door and door frame were removed, the door opening was filled with glass fibre batts and one layer of 13 mm gypsum board was attached to each side of the wall to completely cover and extend past the door opening. The measured TL versus frequency values are shown in Fig. 9 and are seen to be similar to those for the original wall in Fig. 6. The STC and Rw for the no foam and the full foam conditions were all 47. For the half foam
case, the STC was 47 and the Rw was 46.
10 15 20 25 30 35 40 45 63 125 250 500 1k 2k 4k Frequency, Hz T ran smi ssi o n L o ss, d B no foam half foam full foam
Fig. 8. Measured sound transmission loss versus frequency for the wall-with-sealed-door and for the 3 absorption conditions.
10 15 20 25 30 35 40 45 50 55 60 65 63 125 250 500 1k 2k 4k Frequency, Hz tr an smi ssi o n l o ss, d B no foam half foam full foam
Fig. 9. Measured sound transmission loss versus frequency for the patched wall-with-no-door and for the 3 absorption conditions.
The TL versus frequency data for all four constructions are compared in Fig. 10. The results for the patched wall are a little different to those for the original wall and
board patches modified the bending wave vibrations of the wall surfaces possibly by changes in the damping.
The sealed door is seen to result in higher TL values at most frequencies and the differences are largest at the highest frequencies.
0 10 20 30 40 50 60 70 63 125 250 500 1000 2000 4000 Frequency, Hz Tr a ns m is s ion Lo s s , d B No door Door Sealed door Patched wall
Fig. 10. Comparison of measured transmission loss versus frequency results for all 4 constructions and the case of no added absorption (i.e. ‘no foam).
Figure 11 plots the differences in measured TL values for ‘forward’ and ‘reverse’ propagation between the two test chambers. Forward propagation was from the small chamber to the large chamber; reverse propagation was from the large chamber to the small chamber. The differences are very small but indicate larger TL values at lower frequencies for forward propagation and larger TL values at higher frequency for reverse propagation. Such differences are not fully understood and are included because they may influence speech security test results.
-6 -4 -2 0 2 4 6 8 10 63 125 250 500 1k 2k 4k Frequency, Hz di ff er enc e, dB no foam half foam full foam
Fig. 11. Forward – Reverse propagation differences in TL values for the patched wall-with-no-door and for the 3 absorption conditions.
4. Full Speech Security Test (FSST) Results
The effects of various parameters on the results of the full speech security test were first measured for each construction to establish the expected results when using the proposed quick test procedure and for subsequent comparisons with the quick test results. The effects of microphone height in the receiving space and loudspeaker type were
investigated and measured level differences, LD(f), were compared with the measured transmission loss, TL(f), values. The variation in average level difference values over frequency, LD(avg), as well as variations in the spectrum of the level differences , LD(f), were examined as a function of position along the test walls. All full speech security test results in this section are based on averages of results for measurements at 9 microphone positions in the source room using 5 independent source positions and measured at the 26 spot receiver positions in the adjacent room (shown in Fig. 3).
4.1 Effects of microphone height at receiving points
Fig. 12, 13 and 14 show the effects of microphone height in the receiving space. As shown in Fig. 3 there were13 microphone positions along the test wall at 1.2 or 1.5 m heights above the base of the wall. Fig. 12 compares the results averaged over the 13 positions at each microphone height for the wall-with-no-door in terms of average measured level differences.
20 25 30 35 40 45 50 55 60 65 250 500 1k 2k 4k Frequency, Hz L ev el d if fer en ce , d B 1.2m height 1.5m height WnD-FF
Fig. 12. Comparison of average measured level difference over position along the wall for two different microphone heights, for the wall-with-no-door (WnD) construction. Fig. 13 and 14 similarly compare average level differences for each microphone height for the constructions that included the wall-with-a-door and the wall-with-a-sealed-door respectively. All three figures show very little effect of microphone height. There are some small differences in the 250, 315 and 400 Hz 1/3-octave bands. The test walls were mounted in a small niche, which is the height of the test wall (2.44 m). These small differences may be due to vertical resonances in this niche which could cause measured transmitted levels to vary with microphone height at the positions 0.25 m from the test wall. However, they may not occur for situations where the microphones were not in such a niche.
10 15 20 25 30 35 40 45 50 250 500 1k 2k 4k Frequency, Hz L evel d if fer e n c e, d B 1.2m height 1.5m height WwD-FF
Fig. 13. Comparison of average measured level differences over position along the wall for two different microphone heights, for the wall-with-a-door (WwD) construction.
15 20 25 30 35 40 45 250 500 1k 2k 4k Frequency, Hz L eve l d if fer e n c e, d B 1.2m height 1.5m height WsD-FF
Fig. 14. Comparison of average measured level differences over position along the wall for two different microphone heights, for the wall-with-sealed-door (WsD) construction. In was concluded that, in general, the microphone heights used in the receiver space had only very minor effects and their effects could be ignored in most tests. Most of the other test results using the full speech security test are averages over all 26 microphone
positions at both the 1.2 and 1.5 m microphone heights. Of course larger variations in microphone height could lead to larger effects and especially if the microphone is located close to significant sound leaks.
4.2 Effects of loudspeaker directionality and test room absorption on LD(f) and TL(f) comparisons
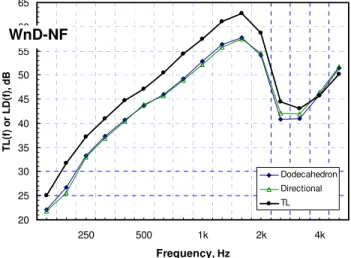
Fig. 15 compares measured average (over microphone positions) level difference using the dodecahedron and directional loudspeakers with transmission loss values for the wall-with-no-door and no added foam absorption. The average level differences for the two loudspeaker types were very similar with some small differences around the frequency of the coincidence dip (2.5k and 3.15k Hz). Since the coincidence dip is influenced by the
angle of incidence of the test sound, the differences in loudspeaker directionality may explain these small differences.
The average level differences and the transmission loss values seem to follow
approximately parallel trends. Although the average LD(f) values are approximately 5 dB lower than the TL(f) values for most frequencies, the two curves come together and cross at 4k Hz. 20 25 30 35 40 45 50 55 60 65 250 500 1k 2k 4k Frequency, Hz T L (f ) o r L D (f) , dB Dodecahedron Directional TL WnD-NF
Fig. 15. Comparison of transmission loss TL(f) and average level differences (over microphone position), LD(f), using the directional and dodecahedron loudspeakers for
the wall-with-no-door (WnD) construction and no added foam absorption (NF). Adding sound absorbing foam to the test rooms leads to systematic increases in the average measured level differences as seen in the results of Fig. 16 and 17 for the half foam and full foam absorption cases. For the full foam absorption results in Fig. 17. the average level differences are in quite close agreement with the TL(f) values for
frequencies up to about 1.25k Hz. The approximately parallel LD(f) and TL(f) results and variation of the difference between them with varied room absorption were previously noted and approximated by a factor that accounted for the variation with room absorption but was constant for all frequencies important for speech (160 to 5k Hz) [4].
20 25 30 35 40 45 50 55 60 65 250 500 1k 2k 4k Frequency, Hz T L (f) o r L D (f), d B Dodecahedron JBL TL WnD-HF
Fig. 16. Comparison of transmission loss TL(f) and average level differences (over microphone position), LD(f), using the directional and dodecahedron loudspeakers for
the wall-with-no-door (WwD) construction and the half foam (HF) absorption case.
20 25 30 35 40 45 50 55 60 65 250 500 1k 2k 4k Frequency, Hz TL (f) or L D (f), d B Dodecahedron JBL TL WnD-FF
Fig. 17. Comparison of transmission loss TL(f) and average level differences (over microphone position), LD(f), using the directional and dodecahedron loudspeakers for
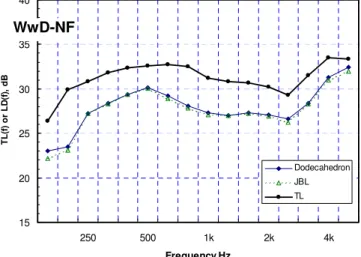
the wall-with-no-door (WnD) construction and the full foam (FF) absorption case. Figures 18, 19 and 20 compare measured average (over microphone position) level differences using the dodecahedron and directional loudspeakers with transmission loss values for the wall-with-a-door and varied added foam absorption. Again the LD(f) and TL(f) values follow approximately parallel trends and the difference between them decrease with added sound absorption. As for the results for the wall-with-no-door construction, there are again only very small differences between the LD(f) values for the two different loudspeakers.
15 20 25 30 35 40 250 500 1k 2k 4k Frequency,Hz T L (f ) o r L D (f), d B Dodecahedron JBL TL WwD-NF
Fig. 18. Comparison of transmission loss TL(f) and average level differences (over microphone position), LD(f), using the directional and dodecahedron loudspeakers for
15 20 25 30 35 40 250 500 1k 2k 4k Frequency,Hz T L (f) o r L D (f), d B Dodecahedron JBL TL WwD-HF
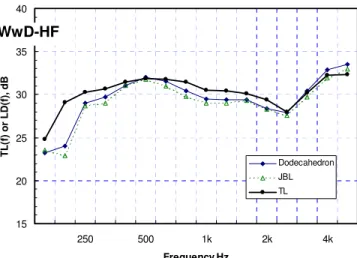
Fig. 19. Comparison of transmission loss TL(f) and average level differences (over microphone position), LD(f), using the directional and dodecahedron loudspeakers for
the wall-with-a-door (WwD(construction and the half foam (HF) absorption case.
15 20 25 30 35 40 250 500 1k 2k 4k Frequency, Hz T L (f) o r L D (f), d B Dodecahedron JBL TL WwD-FF
Fig. 20. Comparison of transmission loss TL(f) and average level difference (over microphone position), LD(f), using the directional and dodecahedron loudspeakers for
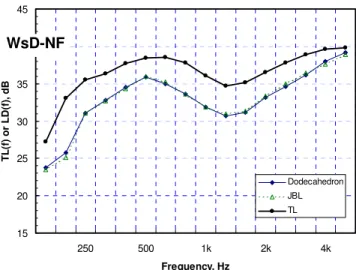
the wall-with-a-door (WwD) construction and the full foam (FF) absorption case. The comparisons of measured average (over microphone position) level differences using the dodecahedron and directional loudspeakers with transmission loss values for the wall-with-sealed-door and varied added foam absorption are shown in Fig. 21, 22 and 23.
15 20 25 30 35 40 45 250 500 1k 2k 4k Frequency, Hz T L (f) o r L D (f) , d B Dodecahedron JBL TL WsD-NF
Fig. 21. Comparison of transmission loss TL(f) and average level differences (over microphone position), LD(f), for the directional and dodecahedron loudspeakers for the
wall-with-sealed-door (WsD) construction and no added foam (NF) absorption.
As for the other constructions, there are only very minor differences in level differences obtained using the two different loudspeakers. The average difference between TL(f) values and LD(f) decreases with increasing added room absorption. For the full foam absorption case, the TL(f) and LD(f) values have quite similar values.
15 20 25 30 35 40 45 250 500 1k 2k 4k Frequency, Hz T L (f) or LD (f) , d B Dodecahedron JBL TL WsD-HF
Fig. 22. Comparison of transmission loss TL(f) and average level differences (over microphone position), LD(f), using the directional and dodecahedron loudspeakers for the wall-with-sealed-door (WsD) construction and the half foam (HF) absorption case.
15 20 25 30 35 40 45 250 500 1k 2k 4k Frequency, Hz T L (f ) o r L D (f) , d B Dodecahedron JBL TL WsD-FF
Fig. 24. Comparison of transmission loss TL(f) and average level differences (over microphone position), LD(f), using the directional and dodecahedron loudspeakers for
4.3 Variations of LD(avg) values along the walls
LD(avg) values are arithmetic averages of level differences over the speech frequencies from 160 to 5k Hz. Fig. 24 and 25 plot LD(avg) values versus position along the wall separately for each microphone height and absorption condition for the wall-with-no-door construction. Since the wall had no sound leaks or weak spots, we expect approximately the same LD(avg) values at all measurement locations. The figures show that as expected the variations of LD(avg) values with position along the wall were mostly less than 1 dB in magnitude.
There is a small trend for the measured LD(avg) values to increase slightly towards both ends of the test wall. This effect may be because higher transmitted sound levels are measured near the centre of the test wall. For a microphone near the centre of the wall the measured levels are due to transmitted sound arriving from all around the microphone location. Near the edge of the wall, the transmitted sounds only arrive at the microphone from one side of the microphone. The higher measured levels near the centre of the wall would correspond to lower LD(avg) values seen in these plots.
Fig. 24 and 25 show some small differences between the two microphone heights and these differences increase with increasing amounts of added sound absorbing material. As in the previous plots increasing the added sound absorption increased the measured LD(avg) values.
The trends in Fig. 24 for the dodecahedron loudspeaker are very similar to those in and Fig. 25 for the directional loudspeaker. There are some small differences indicating there is less effect of microphone height when using the directional loudspeaker. This may be due to the incident sound being more concentrated on the wall immediately opposite the microphone position when the directional source is used.
40 41 42 43 44 45 46 47 48 49 50 1 2 3 4 5 6 7 8 9 10 11 12 13 Microphone position L D (av g ), d B full foam (1.2m) full foam (1.5m) half foam (1.2m) half foam (1.5m) no foam (1.2m) no foam (1.5m) W nD
Fig. 24. Measured LD(avg) values versus microphone position along the wall for the wall-with-no-door (WnD) shown separately for two microphone heights and three room
40 41 42 43 44 45 46 47 48 49 50 1 2 3 4 5 6 7 8 9 10 11 12 13 Microphone position L D (avg ), d B full foam (1.2m) full foam (1.5m) half foam (1.2m) half foam (1.5m) no foam (1.2m) no foam (1.5m) WnD
Fig. 25. Measured LD(avg) values versus microphone position along the wall for the wall-with-no-door (WnD) shown separately for two microphone heights and three room
absorption conditions for the directional loudspeaker source
When LD(avg) values are plotted versus position along the wall-with-a-door we expect larger variations as are shown in Fig. 26 and 27.
25 27 29 31 33 35 1 2 3 4 5 6 7 8 9 10 11 12 13 Microphone position L D (a v g ), d B full foam (1.2m) full foam (1.5m) half foam (1.2m) half foam (1.5m) no foam (1.2m) no foam (1.5m) Door WwD
Fig. 26. Measured LD(avg) values versus microphone position along the wall for the wall-with-a-door (WwD) shown separately for two microphone heights and three room
absorption conditions for the dodecahedron loudspeaker source.
The measured LD(avg) values were lowest close to the left side of the door on Fig. 26 and 27. As shown in Fig. 3 this was the latch side of the door and presumably there was a little larger sound leak at this side of the door than at the hinge side. The LD(avg) values increased monotonically as the microphone was move further away from the point of the lowest LD(avg) values. The sound transmission loss of the door is much lower than that of the wall and presumably at all points along the wall, the predominant source of transmitted sound is through the door and leaks around the door. Consequently
transmitted sound levels decrease and LD(avg) values increase as the microphone is moved away from this weak point. However, the maximum increase in LD(avg) values
was only about 4 dB for the case of full foam absorption and less when less absorption was added. 25 27 29 31 33 35 1 2 3 4 5 6 7 8 9 10 11 12 13 Microphone position L ev el d if fer en ce, d B full foam (1.2m) full foam (1.5m) half foam (1.2m) half foam (1.5m) no foam (1.2m) no foam (1.5m) Door WwD
Fig. 27. Measured LD(avg) values versus microphone position along the wall for the wall-with-a-door (WwD) shown separately for two microphone heights and three room
absorption conditions for the directional loudspeaker source.
30 31 32 33 34 35 36 37 38 39 40 1 2 3 4 5 6 7 8 9 10 11 12 13 Microphone position LD (a v g ), dB full foam (1.2m) full foam (1.5m) half foam (1.2m) half foam (1.5m) no foam (1.2m) no foam (1.5m) Door WsD
Fig. 28. Measured LD(avg) values versus microphone position along the wall for the wall-with-sealed-door (WsD) shown separately for two microphone heights and three
30 31 32 33 34 35 36 37 38 39 40 1 2 3 4 5 6 7 8 9 10 11 12 13 Microphone position L D (a v g ), d B full foam (1.2m) full foam (1.5m) half foam (1.2m) half foam (1.5m) no foam (1.2m) no foam (1.5m) WsD Door
Fig. 29. Measured LD(avg) values versus microphone position along the wall for the wall-with-sealed-door (WsD) shown separately for two microphone heights and three
room absorption conditions for the directional loudspeaker source.
The plots of LD(avg) versus microphone position in Fig, 28 and 29 for the sealed door show a more symmetric variation relative to the location of the door. With the door sealed with metal tape there were not more significant leaks on one side of the door compared to the other side of the door. The maximum variation in LD(avg) values was again about 4 dB.
The plots of LD(avg) values versus position along the test walls describe the variation of the measured average level differences along a particular construction. Another form of variation concerns how the spectrum of the measured level differences varies with position along the test walls. In this section plots of LD(f) are included for both types of loudspeaker source and at a position near the end of the wall (#13) and a position near the centre of the wall (#7). Fig. 30 and 31 show plots of level differences versus frequency (LD(f) values) for the dodecahedron loudspeaker and for the directional loudspeaker at positions #13 and #7 respectively. Results are given for both types of loudspeaker on each plot and all data were obtained for the full foam absorption condition.
20 25 30 35 40 45 50 55 60 65 250 500 1k 2k 4k Frequency, Hz LD (f ), dB Dodecahedron Directional WnD-FF
Fig. 30. Measured LD(f) at position #13 at the end of the wall for the dodecahedron and the directional loudspeaker source. Wall-with-no-door (WnD), full foam (FF) case. Fig. 30 and 31 show very similar trends. The differences between the results using the two different loudspeakers are also quite similar in the two plots and are largest at the coincidence dip frequencies of 2.5 and 3.15 k Hz. However, these differences between the loudspeaker source do not vary with position along the wall. There is no evidence of significant changes in the frequency response of the measured level differences for the construction of a wall without a door in these two figures.
20 25 30 35 40 45 50 55 60 65 250 500 1k 2k 4k Frequency, Hz LD (f ), d B Dodecahedron Directional WnD-FF
Fig. 31. Measured LD(f) at position #7 at the centre of the wall for the dodecahedron and the directional loudspeaker source. Wall-with-no-door (WnD), full foam (FF) case. Fig. 32 and 33 show the frequency content of measured level differences for the wall-with-a-door. Again the results are for a position at the end of the wall (position #13 in Fig 32) and a position at the centre of the wall (position #7 in Fig 33). For this construction there was a significant difference in the average level difference between the two
locations because of the presence of the door close to position #7. However, the spectral variations are again reasonably similar between the two positions.
15 20 25 30 35 40 250 500 1k 2k 4k Frequency, Hz LD (f ), dB Dodecahedron Directional WwD-FF
Fig. 32. Measured LD(f) at position #13 at the end of the wall-with-a-door (WwD) for the dodecahedron and the directional loudspeaker sources and the full foam (FF) case.
15 20 25 30 35 40 250 500 1k 2k 4k Frequency, Hz LD (f ), dB Dodecahedron Directional WwD-FF
Fig, 33. Measured LD(f) at position #7 at the centre of the wall-with-a-door (WwD) for the dodecahedron and the directional loudspeaker sources and the full foam (FF) case.
15 20 25 30 35 40 45 250 500 1k 2k 4k Frequency, Hz LD (f ), dB Dodecahedron Directional WsD-FF
Fig. 34. Measured LD(f) at position #13 at the end of the wall-with-sealed-door (WsD) for the dodecahedron and the directional loudspeaker sources and the full foam (FF)
15 20 25 30 35 40 45 250 500 1k 2k 4k Frequency, Hz LD (f ), dB Dodecahedron Directional WsD-FF
Fig. 35. Measured LD(f) at position #7 at the centre of the wall-with-sealed-door (WsD) for the dodecahedron and the directional loudspeaker source and the full foam (FF) case.
5. Evaluation of an Alternative Full Test
In the full test, level differences are measured from a room average source room level to individual spot receivers in adjacent spaces. Measuring the source room average levels requires measurements of source room levels for a number of combinations of
loudspeaker position and microphone position in the source room. This can be time consuming and must be repeated for each room that is tested. A possible alternative approach would be to measure the sound power output of the test source and use this to calculate the average level (over direction) from the source at a distance of 1 m. This could be done once for the measurements of a number of meeting rooms. Data from the current measurements were used to evaluate this alternative speech security full test. The average levels at 1 m were calculated in the large reverberation chamber from measurements in the no foam condition. First the sound power levels, Lw(f), were
calculated for each source.
(1) dB f A f L f Lw( )= s( )−10log{4/( ( ))},
where Ls(f) is the average source room level and A(f) is the total sound absorption in m2.
From the sound power levels, the average level (over direction) at 1 m, L1, in a free field
can be calculated as follows,
(2) dB f L r Log f L f L1( )= w( )+10 {1/(4π 2)}= w( )−11, where r = 1 m
Fig. 36 compares measured LD(f) values from the two approaches for the wall-with-no-door construction and the no foam absorption case. Fig. 37 and 38 are similar results for the wall-with-a-door and the wall-with-a-sealed-door.
15 20 25 30 35 40 45 50 55 60 65 250 500 1k 2k 4k Frequency, Hz L D (f), d B Dodec, L1 Dodec, Ls Directional, L1 Directional, Ls WnD-NF
Fig. 36. Comparison of measured LD(f) using either the source room levels Ls or the average level at 1 m, L1 for both the dodecahedron and the directional loudspeaker.
10 15 20 25 30 35 40 250 500 1k 2k 4k Frequency, Hz L D (f) , d B Dodec, L1 Dodec, Ls Directinal, L1 Directional, Ls WwD-NF
Fig. 37. Comparison of measured LD(f) using either the source room levels Ls or the average level at 1 m, L1 for both the dodecahedron and the directional loudspeaker.
Wall-with-a-door construction (WwD), no foam (NF) absorption case.
15 20 25 30 35 40 45 250 500 1k 2k 4k Frequency, Hz LD (f ), dB Dodec, L1l Dodec, Ls Directional, L1 Directional, Ls WsD-NF
Fig. 38. Comparison of measured LD(f) using either the source room levels Ls or the average level at 1 m, L1 for both the dodecahedron and the directional loudspeaker.
Wall-with-sealed-door construction (WwD), no foam (NF) absorption case. In all three plots above the two loudspeakers lead to similar results. However, using the average source room levels, Ls, and the average level at 1 m lead to quite different results.
The difference between the two methods also varies with frequency as shown in Fig. 39. As the two loudspeakers led to very similar results, Fig 39 shows only results for the dodecahedron loudspeaker. The figure shows the differences between the LD(f) values obtained using the two methods and for the 9 combinations of 3 constructions and 3 absorption cases.
-3 -2 -1 0 1 2 3 4 5 6 7 250 500 1k 2k 4k Frequency, Hz L D (f ) di ff e re n c e , d B WnD-NF WwD-NF WsD-NF WnD-HF WwD-HF WsD-HF WnD-FF WwD-FF WsD-FF
Fig. 39. Differences in measured LD(f) relative to either the source room average levels, Ls or the average source level at 1 m L1 for the 9 combinations of 3 constructions and 3
absorption cases.
The differences in Fig. 39 vary with frequency because when the average source room levels are used, they are influenced by the total sound absorption in the particular test room. Although these data are all from the same room there were variations in the total sound absorption between tests because of changes in the temperature and humidity of the test room.
One could use the average 1m level and correct for the effects of room absorption. However, this would require reverberation time measurements to determine exactly how the test room absorption varies with frequency. This would have to be repeated for every room tested. Because it would be simpler to measure to actual source room levels than the room reverberation times, the proposed alternative method was rejected.
6. Comparison of Quick Test and Full Test Results
6.1 Parameters varied in the comparisons
The Quick Test procedure is intended to provide results that are approximately the same as those from the full speech security test but require less time and effort. The proposed quick test procedure was evaluated by comparing measured level differences obtained using the quick test procedure with values of the same conditions using the full speech security test. These comparisons were made for a number of conditions obtained by varying the 6 key variables listed in Table 1.
Variable Values
Microphone height in
receiving space 1.2 and 1.5 m
Position along the test wall Positions #1, 5, 9, 13, 14, 18, 22 and 26 (see Fig. 3) Source-to-wall distance 0.5, 0.75, 1.0 and 1.5 m
Room absorption No foam (NF), half foam (HF) and full foam (FF) Wall construction Wall-with-no-door (WnD) and Wall-with-a-door (WwD) Table 1 Quantities varied in comparisons of full speech security test and the quick test and the values included for each variable.
For the quick test the microphone in the receiving space was located at 8 of the positions used in the full test and indicated on Fig. 3. The receiving microphone was either 1.2 m or 1.5 m above the base of the wall. In all cases for both test procedures the microphone in the receiving space was located 0.25 m from the test wall and for the quick test the source loudspeaker was always at the same height as the receiving microphone. For the quick test results, the source was at one of 5 distances from the test wall (0.5, 0.75, 1.0 or 1.5 m). The intent was to determine an optimum source-to-wall distance that would make possible the best agreement between the results of the two test procedures. These comparisons are shown for two constructions: the wall-with-no-door (WnD) and for the wall-with-a-door (WwD). For each construction, comparisons were made for three different amounts room absorption: full foam (FF), half foam (HF) and no foam (NF). The same absorption conditions were maintained in both of the two rooms. The resulting reverberation times were described in Section 3.1.
6.2 Effects of receiver height on quick test results
The effect of microphone height at the spot receiver positions was first examined. As for the full test results, only small differences in measured LD(f) values were seen and mostly at lower frequencies in the 250, 315 and 400 Hz 1/3-octave bands. Figure 40 shows a comparison of measured LD(f) values averaged over the 4 positions along the wall at 1.2 and 1.5m heights and for the wall-with-no-door construction obtained using the dodecahedron source and the quick test procedure. Similar results obtained using the directional source are shown in Fig. 41.
15 20 25 30 35 40 45 60 55 50 250 500 1k 2k 4k Frequency, Hz LD (f ), dB 1.2m height 1.5m height WnD
Fig. 40. Comparison of measured level differences of the wall-with-no-door (WnD) averaged over the 4 positions at each receiver microphone height using a dodecahedron source and the full foam (FF) absorption case. (see Table 1 and Fig. 3 for information on
the positions). 15 20 25 30 35 40 45 50 55 60 250 500 1k 2k 4k Frequency, Hz LD (f ), dB 1.2m height 1.5m height WnD
Fig. 41. Comparison of measured level differences of the wall-with-no-door (WnD) averaged over the 4 positions at each receiver microphone height using a directional source and the full foam (FF) absorption case. (see Table 1 and Fig. 3 for information
on the positions).
Fig. 42 and 43 compare measured LD(f) values averaged over the 4 receiver positions at each of the two microphone heights for the wall-with-a-door construction.
10 15 20 25 30 35 40 250 500 1k 2k 4k L D (f), d B 1.2m height 1.5m height W D w
Fig. 42. Comparison of measured level differences of the wall-with-a-door (WwD) averaged over the 4 positions at each receiver microphone height using a dodecahedron source and the full foam absorption (FF) case. (see Table 1 and Fig. 3 for information on
the positions). 10 15 20 25 30 35 40 250 500 1k 2k 4k Frequency, Hz LD (f ), d B 1.2m height 1.5m height WwD
Fig. 43. Comparison of measured level differences of the wall-with-no-door (WwD) averaged over the 4 positions at each receiver microphone height using a directional source and the full foam absorption (FF) case. (see Table 1 and Fig. 3 for information on
the positions).
For both the wall-with-no-door and the wall-with-a-door constructions, there were small differences in the measured LD(f) values at the two microphone heights. Similar
differences were found for the full speech security test in section 4.1. As discussed in section 4.1 for the full test results, these small differences may be due to vertical resonances in the niche where the wall constructions were located. They could cause measured transmitted levels to vary with microphone height at positions 0.25 m from the test wall. However, the differences are small and mostly at lower frequencies which would be less important for the intelligibility of speech. In many of the following results, the LD(f) values are averaged over measured values at both microphone heights to give a clearer picture of the more important effects.
6.3 Effects of source-to-test-wall distance on LD(f) values
The effects of the loudspeaker-to-test-wall distance were larger and more complex than the effects of receiver height. LD(f) values measured for 4 different source-to-wall distances were compared with LD(f) values obtained from the full speech security test procedure. Results were averaged over the two microphone heights and these
comparisons were repeated for constructions with and without a door and for both types of loudspeaker, for the 3 different room absorption cases and for both source loudspeaker types.
Fig. 44 shows comparisons of LD(f) values for the wall-with-no-door and using the dodecahedron loudspeaker source. The LD(f ) values were obtained by averaging results at positions horizontally along the wall and at both microphone heights. For the quick test, the source was positioned at: 0.5, 0.75, 1.0 and 1.5 m from the test wall and at the
wall distance and the variations tended to be of similar magnitude for most included frequencies. The level differences from the quick test results were largest for the largest source-to-wall distance (1.5 m) indicating that this condition led to the lowest transmitted sound levels.
Fig. 44 also plots the measured sound transmission loss values for each absorption case. It is seen that the FSST (Full Speech Security Test) results agreed best with the TL(f) values for the most absorptive conditions (FF) in the two rooms. The LD(f) values obtained using the quick test procedure varied most with the source-to-wall distance, for the full foam absorption case.
Although there are differences between the quick test and full test results, and further variations in the quick test results with source-to wall-distance, the resulting LD(f) values follow approximately parallel trends.
Fig. 45 shows similar comparisons of LD(f) values for the same construction and measurement positions but using the directional loudspeaker source. When using the directional loudspeaker source, the variations of measured LD(f) values with source-to-wall distance were less but the range of variations varied more with frequency. In both Fig 44 and 45 the level differences from the quick test procedure were smaller than those from the full test results by the order of 5 dB for the full foam and half foam cases.
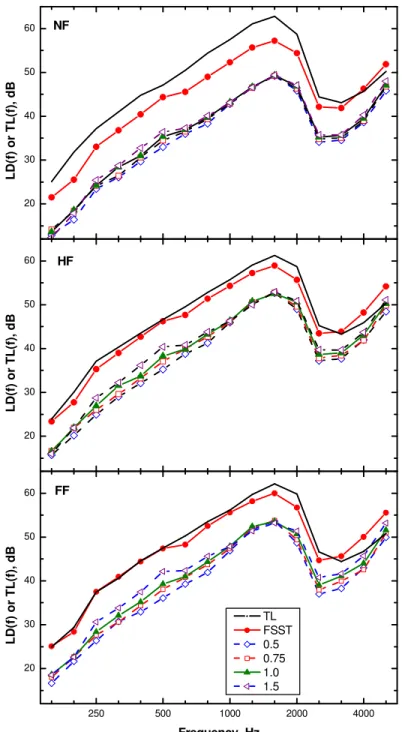
250 500 1000 2000 4000 20 30 40 50 60 TL FSST 0.5 0.75 1.0 1.5 LD (f) or TL(f ), dB Frequency, Hz FF 20 30 40 50 60 HF LD (f) or TL( f), d B 20 30 40 50 60 NF LD(f) or TL (f), d B
Fig. 44. Comparison of measured level differences using the full test (FSST) and quick test (QT) procedures with standard TL values for the wall-with-no-door (WnD) construction and using the dodecahedron source. For the quick test results the source-to-wall distance was varied (0.5, 0.75, 1.0 and 1.5 m) and all results are averages over the 8
microphone positions in the receiving space. Upper panel, no added foam absorption (NF); middle panel, half added foam absorption (HF), and bottom panel full foam
250 500 1000 2000 4000 20 30 40 50 60 TL FSST 0.5 0.75 1.0 1.5 LD (f ) or TL (f ), dB Frequency, Hz FF 20 30 40 50 60 HF L D (f) or TL (f ), dB 20 30 40 50 60 NF L D (f ) o r TL (f) , d B
Fig. 45. Comparison of measured level differences using the full test (FSST) and quick test (QT) procedures with standard TL values for the wall-with-no-door (WnD) construction and using the directional source. For the quick test results, the source-to-wall distance was varied (0.5, 0.75, 1.0 and 1.5 m) and all results are averages over the 8
microphone positions in the receiving space. Upper panel, no added foam absorption (NF); middle panel, half added foam absorption (HF), and bottom panel full foam
250 500 1000 2000 4000 10 20 30 40 50 TL FSST 0.5 0.75 1.0 1.5 LD (f ) or TL (f ), dB Frequency, Hz FF 10 20 30 40 50 HF L D (f) or TL (f ), dB 10 20 30 40 50 NF L D (f ) o r TL (f) , d B
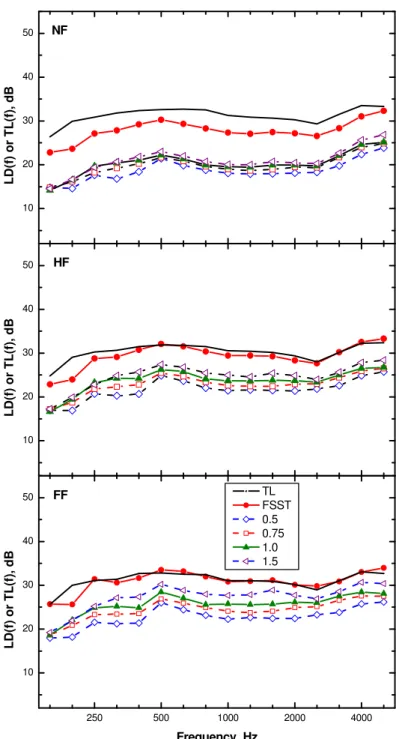
Fig. 46. Comparison of measured level differences using the full test (FSST) and quick test (QT) procedures with standard TL values for the wall-with-a-door (WwD) construction and using the dodecahedron source. For the quick test results, the source-to-wall distance was varied (0.5, 0.75, 1.0 and 1.5 m) and all results are averages over
the 8 microphone positions in the receiving space. Upper panel, no added foam absorption (NF); middle panel, half added foam absorption (HF), and bottom panel full
250 500 1000 2000 4000 10 20 30 40 50 TL FSST 0.5 0.75 1.0 1.5 LD (f) or TL(f ), dB Frequency, Hz FF 10 20 30 40 50 HF LD (f) or TL( f), d B 10 20 30 40 50 NF LD(f) or TL (f), d B
Fig. 47. Comparison of measured level differences using the full test (FSST) and quick test (QT) procedures with standard TL values for the wall-with-a-door (WwD) construction and using the directional source. For the quick test results, the source-to-wall distance was varied (0.5, 0.75, 1.0 and 1.5 m) and all results are averages over the 8
microphone positions in the receiving space. Upper panel, no added foam absorption (NF); middle panel, half added foam absorption (HF), and bottom panel full foam
Fig. 46 and Fig. 47 show similar comparisons of LD(f) values for the wall-with-a-door obtained using the dodecahedron and directional loudspeakers respectively. Although the LD(f) versus frequency characteristics are quite different than for the wall-with-no-door construction, the differences between the two measurement approaches are quite similar to those in the previous two figures. In both cases the LD(f) values from the quick test procedure are lower in value than those from the full test procedure. When using the dodecahedron loudspeaker, the results in Fig. 46 again show systematic variations of the quick test LD(f) values with source-to-wall distance and with the highest LD(f) values at the largest distance from the wall. For the directional source results in Fig. 47, the quick test level differences vary a little less with source-to-wall distance than do the results using the omni-directional source.
Although there was a systematic variation in measured LD(f) with varied source-to-wall distance, there was no clear reason to pick one distance over another from these
measurement results. A source-to-wall distance of 1.0 m was chosen as acceptable and further analyses focussed on using this distance and confirming its suitability. It was thought that a closer distance could lead to problems with reflections between the test wall and some sources and possible less accurate positioning of the source. On the other hand, larger distances would lead to results that are more influenced by room acoustics and the 1.0 m distance seemed a reasonable compromise. (The 1 m source-to-wall distance is also the same as used in ASTM E336-05 standard for the special case of a very large receiving room with a non-diffuse sound field).
It is important to examine the differences between the LD(f) values from the full test and the quick test results because we would like to be able to adjust the quick test results to be approximately equal to the full test results. For example, differences that did not vary significantly over frequency would make it easier to correct the quick test results to more closely equal the full test LD(f) values. Fig 48 plots the differences between the measured LD(f) values obtained using the quick test and full test procedures for the wall-with-no-door construction. The differences between the two methods are plotted for the 6 combinations of 3 absorption conditions and 2 loudspeaker types. In this plot the differences for the full foam and half foam cases when using the dodecahedron
loudspeaker tend to be smaller and vary less with frequency than those for the directional loudspeaker.
0 2 4 6 8 10 12 14 16 250 500 1k 2k 4k Frequency, Hz d iffe re n c e o f L D (f), d B
Direc FullFoam Dodec FullFoam Direc HalfFoam Dodec HalfFoam Direc NoFoam Dodec NoFoam
Fig. 48. Difference in measured level differences between the results of the full test and the quick test procedures (i.e. QT-FSST differences) for the 6 combinations of 3 absorption cases and 2 loudspeaker types. Results are for the wall-with-no-door (WnD)
construction.
Fig. 49 plots a similar set of 6 differences between pairs of LD(f) values for the wall-with-a-door construction. Again for this construction with either the full foam or half foam cases, the differences between the two methods are smaller when using the dodecahedron source and tend to vary less with frequency than when using the
directional source. For this construction, the quick test results seem to deviate most from the full test LD(f) values at high frequencies when using the directional source. This was due to the effects of transmission through the leaky door. Increased levels of higher frequency sound propagated through at the location of the edge of the door, which had no seals. The amount of increased high frequency sound varied with the type of loudspeaker as well as the position of the source loudspeaker and receiver microphone along the wall. The average results in Fig. 49 are most influenced by the higher levels transmitted when the directional source was at position #5 and #18 near the edge of the door.
Comparing the results of Fig. 48 and Fig 49 suggests that the quick test results obtained using the dodecahedron source could provide more accurate estimates of the
corresponding full test results because the differences between the quick test and full test results vary much less over frequency when using the dodecahedron source.
The differences plotted in Fig. 48, and to a lesser extent in Fig. 49, for the dodecahedron source tend to decrease with increasing frequency. This suggests that it might also be possible to correct for this effect when adjusting quick test results to provide approximate predictions of full test results. However the differences for the directional source in these two figures vary differently with frequency between the two constructions.
0 2 4 6 8 10 12 14 16 250 500 1k 2k 4k Frequency, Hz d iffe re n c e o f L D (f), d B
Direc FullFoam Dodec FullFoam Direc HalfFoam Dodec HalfFoam Direc NoFoam Dodec NoFoam
Fig. 49. Difference in measured level differences between the results of the full test and the quick test procedures (i.e. QT-FSST differences) for the 6 combinations of 3 absorption cases and 2 loudspeaker types. Results are for the wall-with-a-door (WwD)
construction. 6.4 Spectral variations along the test wall
The variations of the transmitted sound with frequency can be more clearly understood with plots of the spectrum of the measured level differences obtained using the quick test procedure. Fig. 50 (upper panel) plots the measured LD(f) values obtained using the quick test (QT) procedure at each of the 8 measurement positions using the dodecahedron source and for the full foam condition. The lower panel of this figure shows the
corresponding measured LD(f) values obtained when using the full speech security test (FSST) procedure at the same positions. Both of these results were for the wall-with-no-door construction. Although some small systematic variations along the wall were found for the complete full test results in the previous section, there are other larger variations in the results among the 8 positions for the quick test results than for the full test results. Fig 51 shows LD(f) values for the same conditions and both test procedures obtained using the directional loudspeaker source. Again there is greater variation in LD(f) values among the 8 positions for the quick test results than for the full test results.
250 500 1000 2000 4000 20 30 40 50 60 FSST-Position 1 14 5 18 9 22 13 26 L D (f), d B Frequency, Hz 20 30 40 50 60 QT-Position 1 14 5 18 9 22 13 26 LD (f ) WnD-FF
Fig. 50. Measured level differences versus frequency at the 8 positions used for the quick test results for the wall-with-no-door (WnD) construction and the full foam (FF) absorption case obtained using the dodecahedron source. The upper panel results were obtained using the quick test(QT) procedure and the lower panel using the full test(FSST)
250 500 1000 2000 4000 20 30 40 50 60 FSST-Position 0 13 4 25 8 21 12 17 L D (f), d B Frequency, Hz 20 30 40 50 60 QT-Position WnD-FF 0 13 4 25 8 21 12 17 LD (f )
Fig. 51. Measured level differences versus frequency at the 8 positions used for the quick test results for the wall-with-no-door (WnD) construction and the full foam (FF) absorption case obtained using the directional source. The upper panel results were obtained using the quick test(QT) procedure and the lower panel using the full test(FSST)
results.
The results for the construction consisting of a wall-with-a-door are shown in Fig 52 and Fig 53 for the dodecahedron source and directional source respectively. For these results there are larger variations among the results at the different microphone positions because the transmission characteristics of the wall vary along the wall due to the presence of the door. The LD(f) values at positions #5 and #18 are usually the lowest values at each frequency because these positions were at the location of the leaky door. However, the full test results still indicate less variation in LD(f) values with microphone position than
250 500 1000 2000 4000 10 20 30 40 50 FSST-Position 0 14 5 18 9 22 13 26 L D (f), d B Frequency, Hz 10 20 30 40 50 QT-Position WwD-FF 0 14 5 18 9 22 13 26 LD (f )
Fig. 52. Measured level differences versus frequency at the 8 positions used for the quick test results for the wall-with-a-door (WwD) construction and the full foam (FF) absorption case obtained using the dodecahedron source. The upper panel results were
obtained using the quick test (QT) procedure and the lower panel results using the full test (FSST) results.