Publisher’s version / Version de l'éditeur:
Vous avez des questions? Nous pouvons vous aider. Pour communiquer directement avec un auteur, consultez la première page de la revue dans laquelle son article a été publié afin de trouver ses coordonnées. Si vous n’arrivez pas à les repérer, communiquez avec nous à [email protected].
Questions? Contact the NRC Publications Archive team at
[email protected]. If you wish to email the authors directly, please see the first page of the publication for their contact information.
https://publications-cnrc.canada.ca/fra/droits
L’accès à ce site Web et l’utilisation de son contenu sont assujettis aux conditions présentées dans le site LISEZ CES CONDITIONS ATTENTIVEMENT AVANT D’UTILISER CE SITE WEB.
Physical Review. B, Condensed Matter and Materials Physics, 82, 9, pp.
094453-1-094453-6, 2010-09-30
READ THESE TERMS AND CONDITIONS CAREFULLY BEFORE USING THIS WEBSITE. https://nrc-publications.canada.ca/eng/copyright
NRC Publications Archive Record / Notice des Archives des publications du CNRC :
https://nrc-publications.canada.ca/eng/view/object/?id=0a506f04-1c22-4c35-879d-846a3711799f
https://publications-cnrc.canada.ca/fra/voir/objet/?id=0a506f04-1c22-4c35-879d-846a3711799f
NRC Publications Archive
Archives des publications du CNRC
This publication could be one of several versions: author’s original, accepted manuscript or the publisher’s version. / La version de cette publication peut être l’une des suivantes : la version prépublication de l’auteur, la version acceptée du manuscrit ou la version de l’éditeur.
For the publisher’s version, please access the DOI link below./ Pour consulter la version de l’éditeur, utilisez le lien DOI ci-dessous.
https://doi.org/10.1103/PhysRevB.82.094453
Access and use of this website and the material on it are subject to the Terms and Conditions set forth at
Magnetic phase transition in V2O3 nanocrystals
Blagojevic, V. A.; Carlo, J. P.; Brus, L. E.; Steigerwald, M. L.; Uemura, Y. J.;
Billinge, S. J. L.; Zhou, W.; Stephens, P. W.; Aczel, A. A.; Luke, G. M.
Magnetic phase transition in V
2O
3nanocrystals
V. A. Blagojevic,1J. P. Carlo,2,3,
*
L. E. Brus,1 M. L. Steigerwald,1Y. J. Uemura,2S. J. L. Billinge,4,5W. Zhou,4P. W. Stephens,6A. A. Aczel,7and G. M. Luke7
1Department of Chemistry, Columbia University, New York, New York 10027, USA 2Department of Physics, Columbia University, New York, New York 10027, USA
3Canadian Neutron Beam Centre, National Research Council, Chalk River, Ontario, Canada K0J 1J0 4Department of Applied Physics and Applied Mathematics, Columbia University, New York, New York 10027, USA 5Condensed Matter Physics and Materials Science Department, Brookhaven National Laboratory, Upton, New York 11973, USA
6Department of Physics, State University of New York at Stony Brook, Stony Brook, New York 11794, USA 7Department of Physics and Astronomy, McMaster University, Hamilton, Ontario, Canada L8S 4M1 共Received 15 July 2010; revised manuscript received 31 August 2010; published 30 September 2010兲 V2O3nanocrystals can be synthesized through hydrothermal reduction in VO共OH兲2 using hydrazine as a reducing agent. Addition of different ligands to the reaction produces nanoparticles, nanorods, and nanoplate-lets of different sizes. Small nanoparticles synthesized in this manner show suppression of the magnetic phase transition to lower temperatures. Using muon spin relaxation spectroscopy and synchrotron x-ray diffraction, we have determined that the volume fraction of the high-temperature phase, characterized by a rhombohedral structure and paramagnetism, gradually declines with decreasing temperature, in contrast to the sharp transition observed in bulk V2O3.
DOI:10.1103/PhysRevB.82.094453 PACS number共s兲: 75.75.⫺c, 75.30.Kz
I. INTRODUCTION
The unique characteristics of the transition-metal oxides make them an extraordinarily diverse class of materials, with properties covering almost all aspects of materials science and solid-state physics. The chemical and physical properties of the group V oxides—vanadium, niobium, and tantalum— show promise for applications in catalysis, electrochemistry, and electrochromical device technology. V2O3 has been the subject of many investigations due to a remarkable first-order metal-insulator transition at about 150–160 K,1,2from the low-temperature monoclinic3 into the rhombohedral phase, with an accompanying seven order-of-magnitude in-crease in conductivity and a shift from antiferromagnetic4to paramagnetic5–8 behavior. The low-temperature phase also exhibits an increase in volume of about 1.6%. The addition of a few percent of Cr,9Al,10Re,11or Mo 共Ref.12兲 shifts the conductivity increase to higher temperatures—between 170 and 470 K—depending on doping fraction. These properties make it possible to build temperature sensors and current regulators13,14 using these materials. Furthermore, V
2O3
powders have been used in conductive polymer composites15 and in catalysis.16 The potential uses of V
2O3 in the
nano-crystalline form will require high chemical and structural pu-rity and well-defined morphology, and careful characteriza-tion of the nanoparticle properties.
There have been a few successful syntheses reported of V2O3 nanocrystals.17–21 Zheng et al.18 obtained spherical V2O3 nanoparticles through reductive pyrolysis of
ammo-nium oxo-vanadium共IV兲 carbonate hydroxide, 共NH4兲2关共VO兲6共CO3兲4共OH兲9兴 · 10H2O, in a hydrogen flow at
650 ° C. Su and Schloegl19 made V
2O3 nanoparticles by
re-ducing V2O5crystals in high vacuum 共10−7 Torr兲 at 600 ° C.
Pinna et al.20 discovered a nonaqueous route to V
2O3
nano-crystals through solvothermal reaction of vanadium共V兲 tri-isopropoxide with benzyl alcohol. Benzyl alcohol plays the
roles of both reducing agent and surfactant and the reaction is performed at 200 ° C under nitrogen. Zhang et al.21 syn-thesized V2O3nanopowders using thermal decomposition of vanadium共IV兲 oxalate or mixture of vanadyl hydroxide and ammonium chloride in argon atmosphere at 500 ° C. Al-though there have been no successful syntheses of V2O3
na-norods, there have been a few reported syntheses of VO2
nanorods, which we have used as a starting point.22
We report an approach employing hydrothermal reaction in water solution in air to produce V2O3 nanorods. We use
different ligands to change nanocrystal shape in order to ob-tain particles, rods, and platelets of V2O3. One particular improvement over the previously reported syntheses is that the reaction is not air sensitive. We investigated the magnetic properties of small V2O3 nanoparticles and found them to
behave differently from the bulk material. II. SYNTHESIS
The synthesis follows a simple route: the vanadyl hydrox-ide precursor is heated with hydrazine in an autoclave at 230 ° C, in water. The reaction takes 2–14 days, depending on the ionic strength of the solution and the ligand used. We were able to obtain different shapes and sizes of V2O3
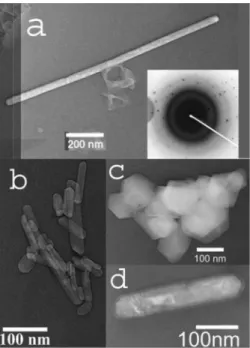
nano-crystals through change in the ligand as shown in transmis-sion electron microscopy 共TEM兲 images 共Fig. 1兲. Nanorods 40–60 nm in diameter and up to 1 m in length were pro-duced using succinic acid 关Fig. 1共a兲兴. Electron-diffraction measurements of a single nanorod reveal no variation along the length of the rod. Judging from the TEM images, nano-rods account for about 10% of the sample, the rest being nanoparticles. Nanorods produced using ethylene diamine as ligand have diameter of 40–60 nm and length of 300–500 nm 关Fig.1共b兲兴. Those produced using 2-propanol 关Fig.1共d兲兴 as a ligand were 70–90 nm in diameter and around 700 nm long. These ligands are more selective than succinic acid, with
nanorods comprising the majority of the sample: the approxi-mate yield of nanorods is around 70% for the reaction using 2-propanol and about 85% for reaction using ethylene di-amine as the ligand. Nanoplatelets of 80–200 nm diameter were obtained using ammonium citrate as ligand 关Fig.1共c兲兴. Finally, nanoparticles 共Fig. 2兲 were produced using 2-propanol as ligand, in a reaction where the precursor is washed to reduce the ionic strength of the solution. The par-ticle size distribution is broad—from less than 10 nm to around 50 nm in diameter.
Thermogravimetric analysis shows a gradual mass loss of about 2% when sample is heated to 860 ° C, indicating that the phase is stable and there is no water of crystallization. Elemental analysis of the sample reveals small percentages
of carbon and hydrogen and trace amounts of nitrogen and chlorine in the sample. The molar ratios of elements in the sample were consistent with stoichiometric V2O3 while the remaining carbon and hydrogen can almost completely be attributed to leftover ligand succinic acid 共C4H6O4—0.009
molecules per one vanadium兲, with the remaining hydrogen probably in the form of ammonium. The exact origin of the excess oxygen 共0.13 atoms for each vanadium atom兲 cannot be determined with any degree of certainty.
III. RESULTS A. Magnetic characterization
The temperature dependence of the magnetic susceptibil-ity of V2O3nanoparticles, measured using a superconducting
quantum interference device 共SQUID兲 magnetometer with applied fields of 100 G, 200 G, and 1 T 共Fig.3兲, shows that there is no large jump in susceptibility near 150 K but a more gradual rise in susceptibility at lower temperatures. This is very different from the behavior of the bulk V2O3 crystal,
which exhibits a sharp rise in magnetic susceptibility around 150 K as the sample shifts from low-temperature antiferro-magnetic ordering to the high-temperature paraantiferro-magnetic state. In external fields of 100 and 200 G, we see the appar-ent signature of a sudden change at T = 80 K. This, however, can be explained as spin freezing of a small impurity phase or the onset of a slight ferrimagnetic polarization of prima-rily antiferromagnetic spins, as even the largest values of susceptibility seen at low temperatures correspond to a mo-ment of approximately only 2 ⫻ 10−4
Bper V site. In
addi-tion, while the high-temperature state in bulk V2O3 is
char-acterized by a relatively constant Pauli-type susceptibility, the nanopowder sample exhibits distinctly Curie-Weiss-type behavior at high temperatures. In order to further investigate this behavior, we used muon spin relaxation 共SR兲 spectros-copy.
SR 共Refs.23and24兲 is an experimental technique based on the implantation of spin-polarized muons in matter and the influence of the atomic, molecular, or crystalline sur-roundings on the evolution of their spins. It is a pointlike FIG. 1. TEM images of V2O3 nanocrystals synthesized using
respective ligands: 共a兲 nanorod 共succinic acid兲; 共b兲 nanorods 共ethyl-ene diamine兲; 共c兲 nanoplatelets 共ammonium citrate兲; and 共d兲 nano-rod 共2-propanol兲.
FIG. 2. TEM image of V2O3 nanoparticles synthesized using 2-propanol as the ligand.
FIG. 3. 共Color online兲 Magnetic susceptibility of V2O3 nanopar-ticles as a function of temperature, in applied fields of 100 G 共red solid symbols兲, 200 G 共blue open symbols兲, and 1 T 共violet open symbols兲, with susceptibility data of McWhan et al. 共Ref.2兲 for the bulk sample 共green diamonds兲 included for reference. Zero-field-cooled and field-Zero-field-cooled measurements are denoted by inverted tri-angles and squares, respectively.
BLAGOJEVIC et al. PHYSICAL REVIEW B 82, 094453 共2010兲
magnetic probe in real space, similar to NMR and ESR, and complementary to the frequency space probed by scattering measurements. One key difference between SR and other related probes such as NMR and ESR is the time window in detecting dynamic phenomena: SR is sensitive to time scales over the range of 10−11– 10−5 s. As an added advan-tage, SR can be performed in the absence of an external magnetic field.
In a magnetic field, the muon spin precesses at a fre-quency of about 13.5 kHz G−1; the magnetic moment of the muon is about three times that of the proton, making it a very sensitive magnetic probe. The positive muons used in the measurement, produced by the parity-violating weak decay of pions at rest, exhibit almost 100% initial spin polarization, and decay into a positron and two neutrinos with a mean lifetime of 2.2 s. The positron is emitted preferentially along the direction of the instantaneous muon spin moment at the time of decay, with a typical overall 20– 30 % asym-metry between the directions parallel and antiparallel to the muon spin at time of decay. The time-dependent asymmetry of detected decay positrons correlates directly to the time evolution of the spins of the implanted muons, and thus to the internal local-field distribution in the sample.
Temperature-dependentSR measurements25,26were per-formed at the M15 beamline at TRIUMF in a transverse field of 50 G in the temperature range of 3–180 K 共Fig.4兲 using the HiTime spectrometer. The long-lived oscillating compo-nent represents muons in paramagnetic environments, while precessing muon spins in the antiferromagnetic environment quickly dephase due to local fields, resulting in rapid relax-ation of the initial muon spin asymmetry. The data indicate that the onset of magnetic ordering occurs at different tem-peratures in different parts of the sample 共presumably corre-sponding to different particle sizes兲. This is in stark compari-son to the rapid and hysteretic transition previously observed inSR measurements of bulk V2O3.27
B. Structural characterization
Bulk V2O3 exhibits concurrent magnetic, structural, and
metal-insulator phase transitions. To attempt to correlate the observed magnetic properties of V2O3nanopowder with any
structural changes, we performed synchrotron x-ray diffrac-tion 共XRD兲 measurements on our sample, as well as on com-mercially prepared bulk powder. These measurements were conducted at beamline X16C at the National Synchrotron Light Source 共NSLS兲 at Brookhaven National Laboratory 共BNL兲, with the samples packed in quartz capillaries and measured using x rays of wavelength 0.698955 Å. Complete data sets from 10° to 40° were collected for the bulk sample as a function of temperature, and complete data sets at 20 and 300 K, as well as shorter scans at intermediate tempera-tures, were taken for the nanopowder sample.
The bulk data were analyzed using theFULLPROFRietveld refinement program,28 and the data were fit to a rhombohe-dral high-temperature phase and a monoclinic low-temperature phase consistent with earlier published results. We confirm that, as in earlier published results,1,2the transi-tion occurs quite rapidly, and is associated with coexistence of the high- and low-temperature phases over a narrow range of temperatures, with the transition temperature exhibiting significant hysteresis, as expected for a strongly first-order phase transition.
In the nanopowder sample, broadening of Bragg peaks and a high background made Rietveld refinement impossible and necessitated much longer integration times for data col-lection. Measurements of the empty quartz capillary showed that this large background phase is in fact intrinsic to the sample, although it is temperature independent, and its origin remains unknown.
As a result of these limitations, we chose to focus on the region around 24° corresponding to the bulk 关116兴 peak. In the bulk sample, this peak exhibits a threefold splitting as the sample transitions from the rhombohedral to the monoclinic phase. Although the 关116兴 peak in the nanopowder sample overlaps with a broad background peak, this background is temperature independent and may be subtracted from the data after being fitted to a temperature-independent Gauss-ian. The sample signal was fit to a sum of a single Gaussian representing the high-temperature phase, and a sum of three Gaussians representing the low-temperature phase. Our re-sults are shown in Fig.5, revealing the gradual dropoff of the high-temperature peak intensity with decreasing temperature, and a corresponding rise in the more diffuse scattering rep-resenting the low-temperature phase. While limitations of the data do not allow us to quantitatively analyze the structure of the low-temperature phase, we can determine that coexist-ence of the high- and low-temperature phases does occur over a wide temperature range similar to that where the high-and low-temperature magnetic phases were seen to coexist in the SR measurements.
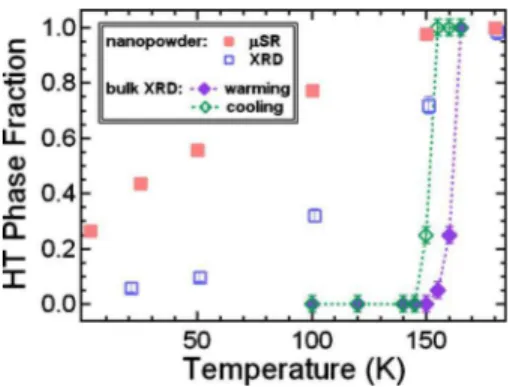
This motivated us to compare the relative phase fractions of high- and low-temperature phases obtained by the two techniques. In Fig. 6 we show with red filled squares the temperature dependence of the oscillating asymmetry com-ponent of muon spin relaxation, giving a relative measure of volume fraction of the paramagnetic region, and with blue open squares the temperature dependence of the integrated intensity coming from the high-temperature structural phase observed by x-ray diffraction. For comparison, the high-temperature rhombohedral phase fraction observed by x-ray diffraction in the bulk material is shown for both warming FIG. 4. 共Color online兲 Muon spin relaxation measurements
per-formed in a weak transverse magnetic field of nominally 50 G, as a function of temperature from 3 to 180 K.
and cooling cycles. Both methods reveal that the volume fraction of the rhombohedral/paramagnetic phase increases gradually with increasing temperature and levels off after T ⬃ 150 K, suggesting that these signals come from the same regions of the material.
IV. DISCUSSION A. Synthesis
The vanadyl hydroxide precursor obtained through differ-ent processes yields differdiffer-ent results. When it is obtained by reducing V2O5 with hydrazine, the reaction yields V2O3.
When the precursor is prepared by precipitation from VOSO4 solution without a reducing agent, the reduction to vanadium共III兲 does not occur. However, when the same re-action is performed with the addition of hydrazine to the precursor before placing it in the autoclave, the result is V2O3. This suggests that excess hydrazine is acting as a
re-ducing agent in the final step of the reaction, rere-ducing
vana-dium共IV兲 to vanadium共III兲. In fact, there is evidence in the literature19 suggesting that if the molar ratio of hydrazine to vanadium is 1:1, allowing only for reduction from vanadi-um共V兲 to vanadium共IV兲, that the product of hydrothermal reaction is VO2· xH2O. Reactions performed at temperatures
below 200 ° C failed to produce V2O3, suggesting that there is a minimum temperature required for vanadium reduction under hydrothermal conditions. 2-propanol accelerates the reaction as compared to equivalent ligand-free reaction: the reaction with 2-propanol as a ligand takes 1 day to produce V2O3at 230 ° C while a ligand-free reaction under the same conditions takes 3 days. There are two possible explanations, which are not mutually exclusive: 2-propanol might be act-ing as a weak reducact-ing agent, thus acceleratact-ing vanadium reduction, or the acceleration might simply come from the fact that the 2-propanol reaction produces much smaller par-ticles than any other we have performed. Small parpar-ticles might be reduced more quickly simply because they would expose a larger surface area to hydrazine in the solution. It is also interesting to note that the ionic strength of the solution appears to have an effect on both the reaction time and the morphology of the product. We can look at two reactions using 2-propanol as a ligand and differ only in the fact that, in the second one, the precursor was washed with water to reduce ionic strength. The first reaction takes eight times longer to complete and produces a mix of nanorods and nanoparticles 共70–90 nm in diameter兲. The second reaction produces only small nanoparticles 共7–50 nm in diameter兲. We also observed that using ethylene diamine as a ligand requires significantly longer reaction time 共14 days兲 than other reactions at the same conditions 共7 days兲. This suggests that ethylene diamine slows down the reaction, possibly by stabilizing vanadium共IV兲.
B. Characterization
Magnetic measurements on V2O3 nanoparticles synthe-sized using 2-propanol as ligand show that the magnetic tran-sition 共from antiferromagnetic to paramagnetic兲 appears to be occurring gradually as the temperature increases, rather than abruptly as it does in the bulk crystals. SQUID measure-ments 共Fig.3兲 show a gradual inflection in susceptibility be-low 150 K, and no bulklike sharp transition at 150–160 K. Analysis of the muon spin relaxation and x-ray diffraction measurements 共Fig. 6兲 show that the volume of the paramagnetic/rhombohedral region increases steadily with increasing temperature, suggesting a particle size depen-dence on transition temperature. By the time the temperature reaches 150 K the curve of the asymmetry amplitude depen-dence is almost leveled off. The asymmetry value at 180 K is about 0.16, indicating that all of the nanoparticles are in the paramagnetic state. The x-ray diffraction results largely fol-low this trend, indicating a gradual decrease in the high-temperature phase fraction with decreasing high-temperature. Characterization of the crystalline phases is impossible, how-ever, due to the limitations of the data, primarily from a large but temperature-independent signal arising from the sample itself. We are thus limited to a semiquantitative estimate of the phase fractions, which display the same trend as the mag-netic data.
FIG. 5. 共Color online兲 XRD Data around the 关116兴 peak. The nanopowder data are shown with a temperature-independent back-ground 共seen as the broad peak in the inset兲 subtracted. Comparison data for the bulk material is shown at the bottom 共arbitrary intensity offset兲. The high-temperature phase is represented by the single peak near 23.75°, whereas the low-temperature phase is seen in several broad peaks, most noticeably near 23.4°. A gradual cross-over is seen between the two phases as a function of temperature.
FIG. 6. 共Color online兲 Comparison of high-temperature phase fractions determined by SR 共red solid squares兲 and XRD 共blue open squares兲. Corresponding phase fractions determined by XRD on bulk V2O3 on warming 共violet filled diamonds兲 and cooling 共green open diamonds兲 are shown for reference.
BLAGOJEVIC et al. PHYSICAL REVIEW B 82, 094453 共2010兲
Magnetic ordering of the monoclinic phase of bulk V2O3 has been revealed by polarized neutron-scattering experi-ments to be ferromagnetic in planes perpendicular to the 关010兴 direction while adjacent planes are antiferromagneti-cally coupled.29,30This results in zero overall magnetic mo-ment, event though individual layers have a relatively high moment of 1.2 B per vanadium atom. Experiments31 have
shown that the magnetic transition can be shifted to a tem-perature below 150 K by application of pressure. At a pres-sure of about 15 kbar the magnetic transition decouples from the metal-insulator transition, and by about 26 kbar, both phase transitions are completely suppressed.
C. Possible size dependence of transition temperature It is apparent from the XRD data that the high-temperature 关116兴 peak in the nanopowder sample is shifted to an angle about 0.2% larger than is seen in the bulk mate-rial, indicating that the lattice parameters in the nanopowder sample are correspondingly smaller than in the bulk. Further-more, the 关116兴 peak in the bulk material exhibits significant broadening relative to its counterpart in the bulk. Bragg peak widths can be ascribed to several causes, including instru-mental resolution, finite particle size, variation in lattice pa-rameters throughout different parts of the specimen, and mi-crostrain effects. The width of the broadened nanopowder peak, well approximated by a Gaussian, may be param-etrized as NP2 =int2 +exc2 , where int is the intrinsic width
approximated by the width of the peak in the bulk material, andexc defined as the “excess width” due to the remaining
factors.
In our current data set, the full width at half maximum 共FWHM兲 in 2⌰ of the bulk peak is 0.152° while that of the nanopowder sample is 0.222°; this leaves an excess FWHM due to broadening of 0.162°. If we ascribe the entirety of this broadening to the finite size of the nanoparticles, we find by application of the Debye-Scherrer formula32
L= K /cos ⌰ 共where L represents the particle size, the wavelength, ⌰ the Bragg angle, and  the peak FWHM in radians兲 that the observed width corresponds to an average particle size of 23 nm, in the lower midrange of the 10–50 nm 共based on TEM images兲 particle size distribution, assum-ing a typical Debye-Scherrer constant value K = 0.9. Unfor-tunately, it is impossible to distinguish between the varying sources of broadening in the current data set, nor is it pos-sible to determine whether finite size effects alone are suffi-cient to explain the observed broadening.
One intriguing interpretation of the range of transition temperatures observed is that it arises from the relatively wide particle size distribution in the sample. In particular, since progressively smaller nanoparticles have an increas-ingly large ratio of surface area to volume, it is expected that surface tension would hold smaller particles in greater com-pression, resulting in smaller lattice parameters. If the lattice parameters are a critical determinant of the transition tem-perature, the transition temperature and its range over the sample may be determined from measurement of the lattice parameters.
Finger and Hazen33 have determined the variation in the lattice parameters of bulk V2O3under applied pressure up to
50 kbar, from which we may compute the 关116兴 peak d spac-ing as a function of pressure. McWhan et al.2 have charac-terized the depression of the transition temperature as a func-tion of applied pressure, finding that the transifunc-tion temperature drops linearly at a rate of approximately −5 K / kbar up to about 16 kbar, then more rapidly decreases toward zero at a sample-dependent critical pressure of 20–26 kbar. Combining these results, one may estimate approxi-mately the transition temperature as a function of 关116兴 d spacing. Using this relation, we find that the centroid of the nanopowder 关116兴 peak corresponds to an effective pressure of 14 kbar and an estimated transition temperature of 85 K. If there is a spread of lattice parameter values throughout the sample, it would also follow that this transition should be smeared out, with portions of the sample exhibiting smaller lattice parameters 共corresponding to a higher effective pres-sure兲 undergoing the transition at lower temperatures, and portions of the sample exhibiting larger lattice parameters 共corresponding to effective pressures closer to zero兲 under-going the transition at higher temperatures. This is roughly consistent with our SR and XRD observations indicating coexistence of the high- and low-temperature phases from base temperature up to over 150 K, although uncertainties about the precise distribution of particle shapes and sizes and unknown strain effects prevent a more quantitative compari-son.
Finally, since magnetic ordering in the low-temperature phase is long range, and because of the dimensions of the nanoparticles, the magnetic transition caused by the antipar-allel alignment of magnetic moments in adjacent planes might not necessarily occur concurrently with the structural transition. Further investigation is required to confirm these findings.
V. CONCLUSIONS
We present an approach for synthesis of V2O3 nanocrys-tals via hydrothermal reduction. Unlike any other reported syntheses, this reaction is done in water and under ambient atmosphere. We have obtained nanocrystals of varied shapes and sizes through choice of ligand.
The magnetic properties of V2O3nanoparticles have been measured with respect to temperature using susceptibility and muon spin relaxation, and it is found that unlike the behavior in the bulk material, there is a gradual onset of magnetic order with decreasing temperature.
Additionally, the structural properties of V2O3
nanopar-ticles have been studied using synchrotron x-ray diffraction. While a full structural refinement of the data was impossible due to the large background signal, clearly a high-temperature phase and a low-high-temperature phase trade off with one another as a function of temperature. Both the mag-netic and the structural results indicate coexistence of high-and low-temperature phases over a broad temperature range, with qualitative agreement between the phase fractions de-termined by magnetic and by structural measurements. The high-temperature phase is consistent with the observed bulk rhombohedral phase, although the low-temperature phase structure cannot be deduced with the available data.
These results suggest a correspondence between lattice parameters and transition temperature, with an intriguing ex-planation being that a particle size dependence to the transi-tion temperature exists due to compression by surface ten-sion. However, the relatively wide size distribution of the nanoparticle sample precludes any definitive conclusions, which await further investigation.
ACKNOWLEDGMENTS
We gratefully acknowledge T. J. Williams, G. J. MacDou-gall, J. A. Rodriguez, J. Janik, and C. R. Wiebe for help in
SR data acquisition, Emil Bozin and Peng Tian for help with the diffraction data analysis, I. P. Swainson and A. J. Millis for useful discussions, and the TRIUMF CMMS for
invaluable technical assistance withSR experiments. Work at Columbia University was supported by the U.S. National Science Foundation via Grants No. DMR-0703940, the Ma-terials World Network 共MWN: DMR-0502706, and No. DMR-0806846兲, the Partnership in International Research and Education initiative 共PIRE: OISE-0968226兲, the MRSEC program 共Grant No. DMR-0213574兲, and at McMaster Uni-versity by NSERC and the Canadian Institute for Advanced Research. W.Z. was supported by NSF under Grant No. DMR-0520547. Work in the Billinge group, and use of the National Synchrotron Light Source, Brookhaven National Laboratory, was supported by the U.S. Department of En-ergy, Office of Basic Energy Sciences, under Contract No. DE-AC02-98CH10886. Finally, we thank the NSF Partner-ships for International Research and Education 共PIRE兲 pro-gram for valuable support.
*Author to whom correspondence should be addressed; [email protected]
1A. I. Frenkel, E. A. Stern, and F. A. Chudnovsky, Solid State
Commun. 102, 637 共1997兲.
2D. B. McWhan, A. Menth, J. P. Remeika, W. F. Brinkman, and T. M. Rice,Phys. Rev. B 7, 1920 共1973兲.
3P. D. Dernier and M. Marezio,Phys. Rev. B 2, 3771 共1970兲. 4J. B. Goodenough,J. Appl. Phys. 39, 403 共1968兲.
5P. H. Carr and S. Foner,J. Appl. Phys. 31, S344 共1960兲. 6D. J. Arnold and R. W. Mires,J. Chem. Phys. 48, 2231 共1968兲. 7S. A. Carter, T. F. Rosenbaum, J. M. Honig, and J. Spalek,Phys.
Rev. Lett. 67, 3440 共1991兲.
8M. Greenwood, R. W. Mires, and A. R. Smith, J. Chem. Phys.
54, 1417 共1971兲.
9C. Smerdou, I. M. Anton, J. Plana, R. Curtis, L. Enjuanes, H. R. Kokabi, F. Studer, and M. Toulemonde,Nucl. Instrum. Methods Phys. Res. B 111, 75 共1996兲.
10M. G. Joshi and M. J. Honig, Rev. Chim. Miner. 19, 251 共1982兲. 11T. Suzuki, M. Ogino, T. Yoshizuka, K. Kunihara, and K. Tsuda,
Adv. Sci. Technol. 共Faenza, Italy兲 17, 135 共1999兲.
12C. Tenailleau, E. Suard, J. Rodriguez-Carvajal, M. P. Crosnier-Lopez, and P. Lacorre,Chem. Mater. 14, 3569 共2002兲.
13E. Andrich, Electron. Appl. 26, 123 共1996兲.
14S. R. Perkins, A. Ruegg, and M. Fischer, Adv. Ceram. 7, 166 共1983兲.
15Y. Pan, G. Wu, and X. Yi,J. Mater. Sci. 29, 5757 共1994兲. 16G. van der Lee, B. Schuller, H. Post, T. L. F. Favre, and V.
Ponec,J. Catal. 98, 522 共1986兲.
17O. Toshiyuki, I. Yasuhiro, and R. K. Kenkyu,J. Photopolym. Sci.
Technol. 10, 211 共1997兲.
18C. Zheng, X. Zhang, S. He, Q. Fu, and D. Lei, J. Solid State
Chem. 170, 221 共2003兲.
19D. S. Su and R. Schloegl,Catal. Lett. 83, 115 共2002兲.
20N. Pinna, M. Antonietti, and M. Niederberger,Colloids Surf., A
250, 211 共2004兲.
21K. Zhang, X. Sun, G. Lou, X. Liu, H. Li, and Z. Su,Mater. Lett.
59, 2729 共2005兲.
22Z. Gui, R. Fan, W. Mo, X. Chen, L. Yang, S. Zhang, Y. Hu, Z. Wang, and W. Fan,Chem. Mater. 14, 5053 共2002兲.
23A. Schenck, Muon Spin Rotation Spectroscopy 共Adam Hilger, Bristol, 1985兲.
24Muon Science: Proceedings of the Fifty First Scottish Universi-ties Summer School in Physics, edited by S. L. Lee, S. H. Kil-coyne, and R. Cywinski 共Institute of Physics, Bristol, 1998兲. 25Y. J. Uemura et al.,Nat. Phys. 3, 29 共2007兲.
26A. T. Savici et al.,Phys. Rev. B 66, 014524 共2002兲.
27Y. J. Uemura, T. Yamazaki, Y. Kitaoka, M. Takigawa, and H. Yasuoka,Hyperfine Interact. 17, 339 共1984兲.
28J. Rodríguez-Carvajal,Physica B 192, 55 共1993兲. 29R. M. Moon,Phys. Rev. Lett. 25, 527 共1970兲. 30A. Heidemann,Z. Phys. 238, 208 共1970兲.
31S. A. Carter, T. F. Rosenbaum, M. Lu, H. M. Jaeger, P. Metcalf, J. M. Honig, and J. Spalek,Phys. Rev. B 49, 7898 共1994兲.
32A. L. Patterson,Phys. Rev. 56, 978 共1939兲.
33L. W. Finger and R. M. Hazen,J. Appl. Phys. 51, 5362 共1980兲.
BLAGOJEVIC et al. PHYSICAL REVIEW B 82, 094453 共2010兲