Publisher’s version / Version de l'éditeur:
Vous avez des questions? Nous pouvons vous aider. Pour communiquer directement avec un auteur, consultez la première page de la revue dans laquelle son article a été publié afin de trouver ses coordonnées. Si vous n’arrivez pas à les repérer, communiquez avec nous à [email protected].
Questions? Contact the NRC Publications Archive team at
[email protected]. If you wish to email the authors directly, please see the first page of the publication for their contact information.
https://publications-cnrc.canada.ca/fra/droits
L’accès à ce site Web et l’utilisation de son contenu sont assujettis aux conditions présentées dans le site LISEZ CES CONDITIONS ATTENTIVEMENT AVANT D’UTILISER CE SITE WEB.
Proceedings of the International Symposium on Empirical Software Engineering
and Measurement (ESEM 2007), 2007
READ THESE TERMS AND CONDITIONS CAREFULLY BEFORE USING THIS WEBSITE. https://nrc-publications.canada.ca/eng/copyright
NRC Publications Archive Record / Notice des Archives des publications du CNRC : https://nrc-publications.canada.ca/eng/view/object/?id=f51984e9-7655-4cb1-bb76-7c4e787c348f https://publications-cnrc.canada.ca/fra/voir/objet/?id=f51984e9-7655-4cb1-bb76-7c4e787c348f
NRC Publications Archive
Archives des publications du CNRC
This publication could be one of several versions: author’s original, accepted manuscript or the publisher’s version. / La version de cette publication peut être l’une des suivantes : la version prépublication de l’auteur, la version acceptée du manuscrit ou la version de l’éditeur.
Access and use of this website and the material on it are subject to the Terms and Conditions set forth at
Cost-Effectiveness Indicator for Software Development
Cost-Effectiveness Indicator for Software
Development *
Erdogmus, H.
2007
* Proceedings of the International Symposium on Empirical Software Engineering and Measurement (ESEM 2007). September 20, 2007. NRC 49367.
Copyright 2007 by
National Research Council of Canada
Permission is granted to quote short excerpts and to reproduce figures and tables from this report, provided that the source of such material is fully acknowledged.
A cost effectiveness indicator for software development
Hakan Erdogmus
NRC Institute for Information Technology
Ottawa, Canada
[email protected]
Abstract
Product quality, development productivity, and staffing needs are main cost drivers in software development. The paper proposes a one-stop cost-effectiveness indicator that combines these three cost drivers through an economic criterion.
1. Introduction
Tradeoffs between development productivity and product quality make it hard to assess the cost-effectiveness of software development, both across software development projects and across development techniques and practices. Previous research confirms the variability in quality and productivity [1], and the tension between them [2]. This paper proposes an indicator that reconciles this tension by aggregating software development’s main cost drivers [3] -- team productivity, staffing needs, and product quality -- into a single coherent quantity. The indicator, called breakeven multiple, allows comparison among projects and development techniques based on their relative cost-effectiveness. The indicator incorporates productivity through its impact on direct development costs and product quality through its impact on indirect or downstream costs associated with rework [4].
Economic metrics for software development have existed since the late nineties. Erdogmus [5] developed a cost-benefit model based on net present value for comparing software initiatives. Muller and Padberg [6] adapted this model to evaluate extreme programming projects. Erdogmus and Williams [7] later combined net present value with breakeven analysis to derive an economic feasibility metric for pair programming. Padberg and Muller [8] used a similar approach in their own analysis of the same practice. Wagner [4] recently proposed an economic efficiency model for quality that aggregates costs and benefits of quality activities into a return-on-investment metric.
The work presented here builds on the metric defined by Erdogmus and Williams [7] for comparing two practices. It both generalizes and simplifies this metric, allowing more robust, multi-way comparison.
2. Basic Concepts
A project is work undertaken by a team. A project’s output is a partial or complete software product with working features and no known issues that require resolution. A project comprises production and rework activities. Production refers to all work that leads to the initial external release of parts or whole of a usable, but not necessarily perfect, product. Production results in a product that may contain issues requiring resolution. The output of production is the project’s nominal output. Rework refers to all work that resolves any identified issues in the nominal output. Rework transforms a released imperfect product into a finished product free of such issues. After rework, nominal output becomes the project’s real output.
Product quality, or simply quality, refers to absence of issues in a project’s output. Think of an issue as a defect or an undesirable property or behavior that incurs some latent cost, or prevents the benefits of a product from being realized as intended. Issues are discovered post-production and require resolution. They may relate to functionality, reliability, usability, maintainability or other external attributes. Rework captures cost of poor quality.
Schedule is the duration of an activity, measured in calendar time. Effort is the labor cost of an activity, measured in person-time.
3. Derived Measures
The following derived measures can be obtained from the base measures of nominal output, production effort, rework effort, issue count and staffing profile (salary loading of project as a function of schedule):
Load factor (L) quantifies a project’s average staffing load based on the staffing profile, in terms of a base salary’s a multiple.
Production speed (p) captures the production component of team productivity. It is the average delivery speed of nominal output by the project:
L p= × effort t Developmen output Nominal
Issue density (d) captures the level of rework that the released nominal product requires. It is the average issue count of a unit of nominal output.
Resolution speed (r) captures the rework component of team productivity. It is the average rate at which the project resolves issues in a nominal product.
4. Derivation of the indicator
Production efficiency is the ratio of production effort to the total effort. A project that is 100% efficient does not perform any rework, and its nominal productivity effectively equals its real productivity. A project having a production speed of p output units per unit schedule, an issue density of d issues per unit output, a resolution speed of r issues per unit schedule, has a production efficiency, ε, of r/(r + pd). If V denotes the hypothetical value earned by a single unit of real output, then for each unit schedule the project on average earns a value of Vpε.
Now suppose S is the base salary of a developer. If the project has a load factor of L persons, it incurs for each unit of schedule a cost of SL. Then the average net value, NV, earned by project per unit schedule is Vpε – LS. Of interest is the minimum level of the quaintly V that allows the project to break even. Solving the equation NV = 0 for V yields this breakeven unit value. Thus BUV = min{ V | Vpε – LS = 0 } = LS/pε.
BUV combines productivity and quality as desired, but it still depends on S. Normalizing the base salary S with respect to BUV results in a more compact indicator called the breakeven multiple, or BM, where:
BM = S/BUV = pε/L
BM expresses the base salary S in terms of a multiple of BUV, but it does not depend on S. Since S is invariant within and across projects in the same context, if a project’s BM increases, the project requires a lower unit value to break even, and the project’s cost-effectiveness and profitability increase as a result. A more intuitive interpretation of BM relies on its unit. BM is measured in output per person-time, the same unit as resource productivity. BM is indeed nominal calendar productivity adjusted by efficiency and de-normalized with respect to resource load. Therefore, it can be thought of as the real resource productivity of a production process.
5. Advantages, Limitations, and Uses
BM is an indicator that aggregates productivity, quality, and staffing needs into a single, simple quantity. It makes possible to compare projects with opposite productivity and quality characteristics, thus
reconciling the underlying trade-offs. BM is empirically determined through combining interdependent measures, but does not express a natural relationship among these measures.
Through alternative derivations, BM captures both cost-effectiveness and real (as opposed to nominal) productivity, both of which admit intuitive interpretations. It is also sound with respect to standard financial theory under the assumption of continuous incremental delivery [7].
BM requires simple base measures to be collected about a project. It can be customized for a given context by appropriately choosing the underlying base measures. A serious limitation of BM is its dependence on the unit of the particular output measure used. Thus projects having different output measures are not comparable by this indicator. The base measures of output and issue count should be interpretable on a ratio scale for realistically large ranges. Particularly problematic is the situation when base measures are highly variable. Software unfortunately does not admit a universal and uniform output measure. Although the ideal output measure is delivered business value, either size measures such as lines of code (low-level) and function points (high-level) or requirements-oriented measures like use-cases and stories are adopted as proxies. However, each proxy has advantages and disadvantages [9]. Finding portable, meaningful, sound measures of size, functionality, productivity and quality has been an elusive endeavor.
The breakeven multiple has two intended uses: (1) as a high-level, one-stop performance indicator inside a portfolio of projects; and (2) as a one-stop dependent variable in empirical studies of software development practices. In experimental contexts, BM’s limitations can be alleviated through study design.
6. Application Example
As an example, consider test-driven development (TDD), a coding technique in which development tasks are driven by unit tests written before production code. The example demonstrates BM’s use in conjunction with sensitivity analysis.
An empirical study by Erdogmus, Morisio, and Torchiano [10] evaluated the effects of writing unit tests before production code (Test-First) relative to writing units tests after production code (Test-Last). The study measured the average nominal productivity and product quality of two groups performing a programming task with a set of incremental requirements. The study measured external program quality (through failing acceptance tests) and production effort, but not rework productivity.
0 0.1 0.2 0.3 0.4 0.5 0.6 0.7 0.8 0% | 0% 16% | 14 % 27% | 25 % 36% | 33 % 42% | 39 % 48% | 45 % 53% | 49 % 56% | 53 % 60% | 57 % 62% | 59 % 65% | 62 %
Pr oduction Efficie ncy: Te s t-Las t | Te s t-Fir s t
Br eakev en M u lt ip le Test-Last Test-First
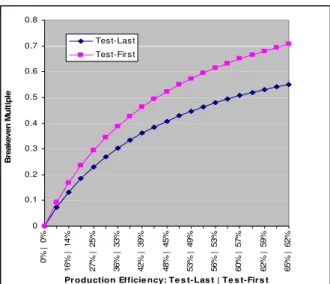
Figure 2. Breakeven multiples for the TDD study as a function of the resolution speed.
To calculate the two groups’ BM values, we treat them as two projects, setting the output measure to number of completed stories. The measure of production speed is stories per hour, which is readily adoptable. For the quality measure, we equate a failing acceptance test to an issue, and calculate issue density in failures per story. The load is constant since the two techniques were executed by single programmers.
Since the study did not measure rework productivity, we fix the production speed of Test-Last, and estimate the resolution speed of Test-First by applying its observed 28% nominal productivity speed-up. Subsequently, we vary Test-Last’s resolution speed, determine the corresponding Test-First resolution speed, compute the corresponding production efficiencies, and finally plot the BM values against the resulting production efficiency pairs. The chart in Figure 2 shows this analysis. The analysis suggests an increasing cost-effectiveness for the Test-First group relative to the Test-Last group as efficiency grows.
7. Summary
The breakeven multiple is an aggregate economic indicator for software development. It reduces what would ordinarily be multi-criteria comparisons based on separate quality, productivity, and staffing measures into single-criterion comparisons based on cost-effectiveness. It is indented for use as a high-level performance indicator for software projects and as a dependent variable in empirical studies of software development.
BM does not express a functional-empirical relationship among the base measures. Sensitivity analyses should be conducted with the recognition of
the base measures’ mutual dependence in mind. Measurement issues constitute BM’s main limitation. Availability of proper and meaningful base measures, ability to accurately capture them, and dependence on the output measure limit BM’s applicability and portability.
8. References
[1] K. Maxwell and P. Forselius, "Benchmarking software development productivity," IEEE Software, pp. 80-88, 2000.
[2] A. MacCormack, C. F. Kemerer, M. Cusumano, and B. Crandall, "Trade-offs between productivity and quality in selecting software development practices," IEEE Software, vol. Sep/Oct, pp. 78-85, 2003. [3] B. W. Boehm and P. N. Papaccio,
"Understanding and controlling software costs," IEEE Transactions on Software Engineering, vol. 14, pp. 1462-1477, 1988. [4] S. Wagner, "A literature survey of the quality
economics of defect-detection techniques," presented at International Symposium on Empirical Software Engineering, 2006. [5] H. Erdogmus, "Comparative evaluation of
software development strategies based on Net Present Value," presented at First ICSE Workshop on Economics-Driven Software Engineering Research, Los Angeles, California, 1999.
[6] M. Müller and F. Padberg, "On the economic evaluation of XP projects," presented at Jouint 9th European Software Engineering Conference and 11th ACM SIGSOFT Int'l Symposium on Foundations of Software Engineering, Helsinki, Finland, 2003. [7] H. Erdogmus and L. Williams, "The
Economics of Software Development by Pair Programmers," The Engineering Economist, vol. 48, 2003.
[8] F. Padberg and M. Müller, "Analyzing cost and benefits of pair programming," presented at 9th International Software Metrics
Symposium, 2003.
[9] M. Asmild, J. C. Paradi, and A. Kulkarni, "Using data envelopment analysis in sofware development productivity measurement," Software Process Improvement and Practice, vol. 11, pp. 561-572, 2006.
[10] H. Erdogmus, M. Morisio, and M. Torchiano, "On the Effectiveness of the Test-First Approach to Programming," IEEE
Transactions on Software Engineering, vol. 31, pp. 226-237, 2005.