Publisher’s version / Version de l'éditeur:
Vous avez des questions? Nous pouvons vous aider. Pour communiquer directement avec un auteur, consultez la
première page de la revue dans laquelle son article a été publié afin de trouver ses coordonnées. Si vous n’arrivez
pas à les repérer, communiquez avec nous à [email protected].
Questions? Contact the NRC Publications Archive team at
[email protected]. If you wish to email the authors directly, please see the
first page of the publication for their contact information.
https://publications-cnrc.canada.ca/fra/droits
L’accès à ce site Web et l’utilisation de son contenu sont assujettis aux conditions présentées dans le site
LISEZ CES CONDITIONS ATTENTIVEMENT AVANT D’UTILISER CE SITE WEB.
Technical Report (National Research Council of Canada. Institute for Ocean
Technology); no. TR-2007-05, 2007
READ THESE TERMS AND CONDITIONS CAREFULLY BEFORE USING THIS WEBSITE.
https://nrc-publications.canada.ca/eng/copyright
NRC Publications Archive Record / Notice des Archives des publications du CNRC :
https://nrc-publications.canada.ca/eng/view/object/?id=345b56a0-ff5a-4e39-9e09-eac699716e54
https://publications-cnrc.canada.ca/fra/voir/objet/?id=345b56a0-ff5a-4e39-9e09-eac699716e54
NRC Publications Archive
Archives des publications du CNRC
For the publisher’s version, please access the DOI link below./ Pour consulter la version de l’éditeur, utilisez le lien
DOI ci-dessous.
https://doi.org/10.4224/8895013
Access and use of this website and the material on it are subject to the Terms and Conditions set forth at
Uncertainty analysis of NSERC-NRC pod dynamometer system
DOCUMENTATION PAGE
REPORT NUMBERTR-2007-05
NRC REPORT NUMBER DATE
February 2007
REPORT SECURITY CLASSIFICATIONUnclassified
DISTRIBUTION
Unlimited
TITLEUNCERTAINTY ANALYSIS OF NSERC-NRC
POD DYNAMOMETER SYSTEM
AUTHOR(S)
Mohammed Fakhrul Islam
CORPORATE AUTHOR(S)/PERFORMING AGENCY(S)
Memorial University of Newfoundland
Institute for Ocean Technology, National Research Council, St. John’s, NL
PUBLICATIONSPONSORING AGENCY(S)
Memorial University of Newfoundland
Institute for Ocean Technology, National Research Council, St. John’s, NL
IOT PROJECT NUMBER NRC FILE NUMBER
KEY WORDS
Podded, propulsor, uncertainty, analysis
PAGES
vi, 87, App.
A-B
FIGS.8
TABLES9
SUMMARYThe report presents a detailed uncertainty analysis for a podded propulsor open water test. A brief overview of
the uncertainty analysis methodology has been provided, with a particular focus on the elements that are unique
to the experiments with podded propulsors. The method used follows that of the American National Standards
Institute (ANSI) and American Society of Mechanical Engineers (ASME) standard on Measurement uncertainty
and the approach described by Coleman and steele in their 1999 book Experimental and Uncertainty Analysis
for Engineers.
The variables of interest in the podded propulsors uncertainty analysis were propeller thrust, unit thrust, propeller
torque, forces and moments on the propulsor in the three orthogonal directions, propeller shaft rotational speed,
carriage advance speed, azimuthing angle, water density (function of water temperature) and propeller diameter.
The uncertainty analysis results of the experiments conducted using the NSERC-NRC dynamometer system
were compared to that of a very high quality, well-established equipment (tests done in the IOT towing tank)
used to measure the performance of some bare podded propellers and the results from the previous similar tests
using the same equipment. Comparison of the results showed that the podded propulsor tests using the
NSERC-NRC pod instrumentation in the current phase of tests provided the level of accuracy comparable with
the established equipment. The uncertainty levels observed in the propeller thrust and unit thrust in the podded
propulsor tests were found to be higher than the thrust uncertainty for the baseline tests, but less than the
corresponding uncertainties found in the previous tests done on the same podded propulsors with same
operating conditions with the same equipment.
For majority of the cases, the primary element of the uncertainty of the performance coefficients was the bias
error (90% or more on the total uncertainty). To reduce the overall uncertainty in the final results, the primary
focuses should be to reduce the bias error in the equipment.
The uncertainty analysis results provided strong evidence that the experimental data obtained using the
NSERC-NRC dynamometer system presented the true performance characteristics of the model scale podded
propulsors under consideration.
ADDRESS
National Research Council
Institute for Ocean Technology
Arctic Avenue, P. O. Box 12093
St. John's, NL A1B 3T5
National Research Council Conseil national de recherches
Canada Canada
Institute for Ocean
Institut des technologies
Technology
océaniques
UNCERTAINTY ANALYSIS OF NSERC-NRC
POD DYNAMOMETER SYSTEM
TR-2007-05
Mohammed Fakhrul Islam
iv
Summary
The report presents a detailed uncertainty analysis for a podded propulsor open water test. A
brief overview of the uncertainty analysis methodology has been provided, with a particular
focus on the elements that are unique to the experiments with podded propulsors. The
method used follows that of the American National Standards Institute (ANSI) and American
Society of Mechanical Engineers (ASME) standard on Measurement uncertainty and the
approach described by Coleman and steele in their 1999 book Experimental and Uncertainty
Analysis for Engineers.
The variables of interest in the podded propulsors uncertainty analysis were propeller thrust,
unit thrust, propeller torque, forces and moments on the propulsor in the three orthogonal
directions, propeller shaft rotational speed, carriage advance speed, azimuthing angle, water
density (function of water temperature) and propeller diameter.
The uncertainty analysis results of the experiments conducted using the NSERC-NRC
dynamometer system were compared to that of a very high quality, well-established
equipment (tests done in the IOT towing tank) used to measure the performance of some bare
podded propellers and the results from the previous similar tests using the same equipment.
Comparison of the results showed that the podded propulsor tests using the NSERC-NRC
pod instrumentation in the current phase of tests provided the level of accuracy comparable
with the established equipment. The uncertainty levels observed in the propeller thrust and
unit thrust in the podded propulsor tests were found to be higher than the thrust uncertainty
for the baseline tests, but less than the corresponding uncertainties found in the previous tests
done on the same podded propulsors with same operating conditions with the same
equipment.
For majority of the cases, the primary element of the uncertainty of the performance
coefficients was the bias error (90% or more on the total uncertainty). To reduce the overall
uncertainty in the final results, the primary focuses should be to reduce the bias error in the
equipment.
The uncertainty analysis results provided strong evidence that the experimental data obtained
using the NSERC-NRC dynamometer system presented the true performance characteristics
of the model scale podded propulsors under consideration.
v
TABLE OF CONTENTS
Summary ... iii
List of Figures ...v
List of Tables ...vi
Chapter 1. Introduction ...1
1-1 Bias Error:...1
1-2 Precision error: ...2
Chapter 2. The Methodology ...4
2-1 The Uncertainty Expressions...4
2-2 Uncertainly in the Six-Component Global Dynamometer ...7
2-3 Results on Uncertainty...12
2-4 Discussions on Uncertainty ...22
Chapter 3. Concluding Remarks ...24
References...25
Appendix A...27
vi
LIST OF FIGURES
Figure 2-1: Block diagram for podded propulsor open water tests and uncertainty analysis... 5
Figure 2-2: Performance Curves for Average Pod 01 with uncertainty (error) bars ... 18
Figure 2-3: Performance Curves for Average Pod 01 with uncertainty (error) bars ... 19
Figure 2-4: Performance Curves for Average Pod 01 with uncertainty (error) bars ... 20
Figure 2-5: Performance Curves for Average Pod 01 with uncertainty (error) bars ... 21
Figure A-1: The 2D drawing of the Average Pod 01... 29
Figure A-2: The Average Pod 01 physical model attached to the dynamometer system ... 30
Figure A-3: Major component of the NSERC-NRC Pod Dynamometer system installed in
the Towing Tank ... 31
vii
LIST OF TABLES
Table 2-1. List of performance coefficients for the podded propulsor unit...4
Table 2-2. List of performance coefficients for the podded propulsor unit...12
Table 2-3: Overall uncertainty estimates for podded propulsor variables...16
Table 2-4: Overall uncertainties in advance coefficients, propeller thrust and torque
coefficients and unit thrust coefficients ...17
Table 2-5: Overall uncertainties in global forces and moments in the three orthogonal
directions for the podded propulsors...17
Table A-1: Geometric particulars of Average Pod 01 ...28
Table A-2: Average Performance characteristics of the pods in the pod series in puller
configuration ...28
Table B-1: Bias and Precision uncertainties of the components of podded propulsor
variables ...87
Table B-2: Overall Uncertainties of the components of podded propulsor variables...90
1
Chapter 1
Introduction
The general recommendations and guidelines provided by the International Towing Tank
Conference (ITTC) for uncertainty analysis for resistance and propulsion tests are most
closely aligned with the testing techniques used to study the uncertainly in the NSERC-NRC
pod dynamometer (Macneill et al., 2004). The methodology used in the analysis of the
uncertainly in the experimentation of puller and pusher podded propulsors follows the
recommended guidelines set out by the ITTC in combination with approaches described by
Bose and Luznik (1996), as well as Coleman and Steele (1999).
Uncertainty in a measurement consists of two major components: bias error and precision
error. Bias error is a constant, systematic error in the system or process, which may be
reduced through calibration, whereas, precision error is the random contribution often
referred to as repeatability error, which can be reduced through the use of multiple readings.
1-1 Bias Error:
Considering the forces and moments applied to a dynamometer during calibration and
testing, analysis of the sources of bias error will depend upon the calibration as well as
testing methods employed. For example, consider a calibration stand using weight pans
connected to cables passing through pulleys to apply the loading to the dynamometer. If the
calibration stand has not been accurately levelled, applied forces and moments will not be as
expected. If various geometrical distances associated with the calibration stand are
inaccurately measured, applied forces and moments will be affected by this inaccuracy. If the
weights used to load the pans have drifted such that their true weight is not their stated
weight, additional bias errors will creep into the calibration. If the pulleys do not have ideal,
frictionless bearings, the true applied forces and moments will be altered by pulley
resistance. Variation in physical constants can lead to bias errors; this is often the case when
thermal variations are present. Incorrect experimental methods can lead to bias errors. For
example, application of forces and moments during calibration in ascending or descending
order as opposed to a random order can lead to a bias uncertainty. Identification of elemental
bias errors for other types of dynamometer calibration equipment, such as load cells, would
proceed in a similar fashion.
2
Sources of bias error are also present in the output from the dynamometer. For example,
biases may be present in the A/D converter, the amplifier gain, and the applied excitation
voltage. For example, a quantization bias error in the analog-to-digital converter is usually
taken to be one-half of the least significant bit. Biases from the amplifier and power supply
should be identified from manufacturer's specifications and should include factors such as
gain, linearity and zero errors. Hess et al. (2000) suggested that the biases in the output from
the dynamometer be calculated using equation 1-1.
⎟⎟
⎠
⎞
⎜⎜
⎝
⎛
⎟
⎠
⎞
⎜
⎝
⎛
⎟
⎠
⎞
⎜
⎝
⎛
⎟
⎠
⎞
⎜
⎝
⎛
=
ex exV
Gain
V
V
bit
V
bits
V
V
1
*
1
*
1000000
*
4096
20
*
µ
µ
……….(1-1)
Where,
V is the excitation voltage used to power the dynamometer.
exA detailed accounting of the sources of bias error is often difficult and requires a careful
analysis of the calibration device, physical constants and geometrical data, associated
experimental equipment and calibration procedures. Because of the expense that such a
thorough examination may entail, one should perform a cursory investigation to estimate the
order of magnitude of the biases. If all biases are negligible when compared to precision
uncertainties, then clearly precision uncertainty will dominate, and setting the biases to zero
will not significantly alter the calculation.
1-2 Precision error:
Precision error is determined by repetition. For the dynamometer calibration device, the
ability to repeatedly apply a given force or moment must be quantified. If F
iis a force
component applied by the calibration device during the i
threpetition, and N is the total
number of measurements (spots) by an independent force gauge (calibration standard), then
compute a mean and a standard deviation using:
Mean of forces or moments,
∑
=
=
N i iF
N
F
11
Standard deviation of forces or moments,
(
)
2 / 1 1 2
1
1
⎥
⎦
⎤
⎢
⎣
⎡
−
−
=
∑
= N i i FF
F
N
S
A 95% confidence estimate of the precision uncertainty at a specific magnitude of applied
force is estimated as:
N
tS
P
F3
where,
t
represents a value drawn from the Student's
t
-distribution for a 95% confidence level
and v = N -1 degrees of freedom. The parameter v is used to extract t value from the standard
t distribution table. It should be carefully noted that, if
N
is small, then a 95% confidence
level estimate will be large due to the paucity of the data; 5 to 10 trials should be sufficient to
characterize the uncertainty level for a given force magnitude. One must perform this
computation for a selection of force magnitudes throughout the dynamic range of the device.
Similarly, the precision uncertainty of the output from the dynamometer, expressed in
ex
V
V
µ
(see equation 1-1), should be determined from repetitions with the same applied force or
moment combination for a selection of force magnitudes throughout the dynamic range of
the device. If all precision errors are negligible when compared to bias uncertainties, then
clearly bias uncertainty will dominate, and setting the precision errors to zero will not
significantly alter the calculation.
4
Chapter 2
The Methodology
2-1 The Uncertainty Expressions
The overall uncertainly in the non-dimensional performance coefficients (Table 2-1) of the
podded propulsors require proper identification of all the variables contained within the data
reduction expressions. Thus the variables of interest in the podded propulsors uncertainty
analysis were propeller thrust, unit thrust, propeller torque, forces and moments on the
propulsor in the three orthogonal directions, propeller shaft rotational speed, carriage
advance speed, azimuthing angle, water density (function of water temperature) and propeller
diameter. Figure 2-1 shows a block diagram for the podded propulsor open water tests
including the individual measurement systems, measurement of individual variables, data
reduction and experimental results.
Table 2-1. List of performance coefficients for the podded propulsor unit.
Performance Characteristics
Data Reduction Equation
K
TProp– propeller thrust coefficient
T
Prop/
ρ
n
2D
4K
TUnit– unit thrust coefficient, K
Txor Longitudinal force coefficient, K
FX4 2 Unit
/
n
D
T
ρ
or
F
/
n
2D
4X
ρ
10K
Q– propeller torque coefficient
10
Q
/
ρ
n
2D
5J – propeller advance coefficient
V
A/
nD
η
Prop– propeller efficiency
J
/
2
π
×
(
K
TProp/
K
Q)
η
Unit– unit efficiency
J
/
2
π
×
(
K
TUnit/
K
Q)
K
FZ– transverse force coefficient
F
Y/
ρ
n
2D
4K
FZ– vertical force coefficient
F
Z/
ρ
n
2D
4K
MX– moment coefficient around x axis
10
M
X/
ρ
n
2D
5K
MY– moment coefficient around y axis
10
M
Y/
ρ
n
2D
5K
MZ– moment coefficient around z axis
(Steering moment)
10
5 2/
n
D
M
Zρ
Where,
T
Prop- propeller thrust
ρ – water density
T
Unit- unit thrust
n – propeller rotational speed
Q - propeller torque
D – propeller diameter
V
A- propeller advance speed, in the
direction of carriage motion
F
X, Y, Z- components of the hydrodynamic
force on the pod
M
X, Y, Z- components of the hydrodynamic
5
6
The experimental approaches used to obtain the data for each of these variables were
influenced by a variety of elemental sources of error. These elemental sources were
estimated, as detailed in Appendix B, and combined using the root-sum-square (RSS) method
to give the bias and precision limits for each of the variables. The bias errors were consisted
of many elemental sources of error, which basically depended on the approaches followed to
measure the variables. However, for the precision error estimates of most variables, only one
source of error (repeatability) was considered significant.
The error estimates used in the determination of the bias and precision errors in this study
were considered to be a 95% coverage estimates. The bias uncertainly and the precision
uncertainly were combined using the root-sum-square (RSS) method shown below to provide
estimates of overall uncertainty levels in these variables. The overall uncertainly was thus
considered to be a 95% coverage estimate.
2 2 v v v
B
P
U
=
+
The final step in the methodology of uncertainly analysis was to determine how uncertainties
in each of the variables propagate through the data reduction equations (see Table 2-1).
Using the approaches described by Bose and Luznik (1996), and Coleman and Steele (1999)
the uncertainty expressions for each set of experiments were developed as shown in equation
2-1 to 2-9.
2 2 2 2 Pr Prop 2 Prop16
4
Prop⎟
⎠
⎞
⎜
⎝
⎛
+
⎟
⎠
⎞
⎜
⎝
⎛
+
⎟⎟
⎠
⎞
⎜⎜
⎝
⎛
+
⎟
⎟
⎠
⎞
⎜
⎜
⎝
⎛
=
⎟
⎟
⎠
⎞
⎜
⎜
⎝
⎛
D
U
n
U
U
T
U
K
U
D n op T T KTρ
ρ………(2-1)
2 2 2 2 225
4
⎟
⎠
⎞
⎜
⎝
⎛
+
⎟
⎠
⎞
⎜
⎝
⎛
+
⎟⎟
⎠
⎞
⎜⎜
⎝
⎛
+
⎟⎟
⎠
⎞
⎜⎜
⎝
⎛
=
⎟
⎟
⎠
⎞
⎜
⎜
⎝
⎛
D
U
n
U
U
Q
U
K
U
D n Q Q KQρ
ρ……….………..…(2-2)
2 2 2 2 Unit Unit 2 Unit16
4
⎟
⎠
⎞
⎜
⎝
⎛
+
⎟
⎠
⎞
⎜
⎝
⎛
+
⎟⎟
⎠
⎞
⎜⎜
⎝
⎛
ρ
+
⎟⎟
⎠
⎞
⎜⎜
⎝
⎛
=
⎟⎟
⎠
⎞
⎜⎜
⎝
⎛
ρD
U
n
U
U
T
U
K
U
T n D T KTUnit……….…….………(2-3)
2 2 2 2 216
4
⎟
⎠
⎞
⎜
⎝
⎛
+
⎟
⎠
⎞
⎜
⎝
⎛
+
⎟⎟
⎠
⎞
⎜⎜
⎝
⎛
ρ
+
⎟⎟
⎠
⎞
⎜⎜
⎝
⎛
=
⎟⎟
⎠
⎞
⎜⎜
⎝
⎛
ρD
U
n
U
U
F
U
K
U
n D Y FY FY FY……….…………..………(2-4)
2 2 2 2 216
4
⎟
⎠
⎞
⎜
⎝
⎛
+
⎟
⎠
⎞
⎜
⎝
⎛
+
⎟⎟
⎠
⎞
⎜⎜
⎝
⎛
ρ
+
⎟⎟
⎠
⎞
⎜⎜
⎝
⎛
=
⎟⎟
⎠
⎞
⎜⎜
⎝
⎛
ρD
U
n
U
U
F
U
K
U
n D Z FZ FZ FZ……….……….……(2-5)
7
2 2 2 2 225
4
⎟
⎠
⎞
⎜
⎝
⎛
+
⎟
⎠
⎞
⎜
⎝
⎛
+
⎟⎟
⎠
⎞
⎜⎜
⎝
⎛
ρ
+
⎟⎟
⎠
⎞
⎜⎜
⎝
⎛
=
⎟⎟
⎠
⎞
⎜⎜
⎝
⎛
ρD
U
n
U
U
M
U
K
U
n D X MX MX KMX………(2-6)
2 2 2 2 225
4
⎟
⎠
⎞
⎜
⎝
⎛
+
⎟
⎠
⎞
⎜
⎝
⎛
+
⎟⎟
⎠
⎞
⎜⎜
⎝
⎛
ρ
+
⎟⎟
⎠
⎞
⎜⎜
⎝
⎛
=
⎟⎟
⎠
⎞
⎜⎜
⎝
⎛
ρD
U
n
U
U
M
U
K
U
n D Y MY MY KMY……….……(2-7)
2 2 2 2 225
4
⎟
⎠
⎞
⎜
⎝
⎛
+
⎟
⎠
⎞
⎜
⎝
⎛
+
⎟⎟
⎠
⎞
⎜⎜
⎝
⎛
ρ
+
⎟⎟
⎠
⎞
⎜⎜
⎝
⎛
=
⎟⎟
⎠
⎞
⎜⎜
⎝
⎛
ρD
U
n
U
U
M
U
K
U
n D Z MZ MZ KMZ………….………(2-8)
2 2 2 2⎟
⎠
⎞
⎜
⎝
⎛
+
⎟
⎠
⎞
⎜
⎝
⎛
+
⎟⎟
⎠
⎞
⎜⎜
⎝
⎛
=
⎟
⎠
⎞
⎜
⎝
⎛
D
U
n
U
V
U
J
U
n D A V J A………...…………..……….…(2-9)
In the expressions for the podded propulsors’ tests, it should be noted that for both thrust and
torque coefficient uncertainties, the tare thrust and frictional torque were imbedded in the
corresponding measurements. Since the tare thrust and frictional torque were part of the same
data stream as the thrust and torque readings, it had not been treated as an independent
contributor of error to the corresponding coefficients, but rather has been treated as a bias
error on the static-zero value of the thrust and the torque measurements.
2-2 Uncertainly in the Six-Component Global Dynamometer:
The calibration of the six-degree-of-freedom NSERC-NRC global dynamometer yielded an
N x M array of applied force and moment components,
F
, and an N x M array of
corresponding output voltages,
V
(Islam 2006c). To each element of the
F
and
V
arrays there
was a corresponding bias and precision uncertainty that had been determined as described in
Appendix B.
In order to calculate uncertainty in a six-component dynamometer measurement, one must
determine how the uncertainties in the calibration data propagates into each element of the
interaction matrix and into future measured forces and moments. As described in Hess et al.
(2000), the solution for interaction matrix is given as:
C=(V
T
V)
-1
V
T
F
If we consider one dynamometer axis at a time (one column of
C
and
F
), then the equation
can be rewritten as
8
V
T
V C
i
=V
T
F
i
which is a classic form of the normal equations for a least squares fit problem. To determine
the bias and precision uncertainty propagated into each column of the interaction matrix, one
must determine how uncertainty in input data propagates into the coefficients of a least
squares fit. Similarly, to determine the uncertainty present in future measured forces and
moments from the fit (
F
=
VA
), one must understand how uncertainty propagates through a
least squares fit into the output.
As given in Hess et al. (2000), the uncertainty propagated into the slope,
m
, for a linear least
square fit of the form,
y
=
mx+b
is of the form:
2 / 1 2 2 3 2 2 2 1 2 2 3 2 2 2 1
.
...
...
...
3 2 1 3 2 1⎥
⎥
⎥
⎥
⎥
⎦
⎤
⎢
⎢
⎢
⎢
⎢
⎣
⎡
⎟⎟
⎠
⎞
⎜⎜
⎝
⎛
∂
∂
+
+
⎟⎟
⎠
⎞
⎜⎜
⎝
⎛
∂
∂
+
⎟⎟
⎠
⎞
⎜⎜
⎝
⎛
∂
∂
+
⎟⎟
⎠
⎞
⎜⎜
⎝
⎛
∂
∂
+
⎟⎟
⎠
⎞
⎜⎜
⎝
⎛
∂
∂
+
+
⎟⎟
⎠
⎞
⎜⎜
⎝
⎛
∂
∂
+
⎟⎟
⎠
⎞
⎜⎜
⎝
⎛
∂
∂
+
⎟⎟
⎠
⎞
⎜⎜
⎝
⎛
∂
∂
=
N N y N y y y x N x x x mU
y
m
U
y
m
U
y
m
U
y
m
U
x
m
U
x
m
U
x
m
U
x
m
U
…………(2-10)
Thus, the uncertainty in the slope depends upon the uncertainties in each of the abscissas and
ordinates of the raw data used to construct the fit. Thus, one must determine the partial
derivatives,
ix
m
∂
∂
and
iy
m
∂
∂
, which are found to be of the form:
(
)
(
)
∑
∑
∑
∑
−
−
−
−
=
∂
∂
2 22
i i i i i i iN
x
x
x
Nx
m
y
Ny
x
m
and
(
)
∑
−
∑
∑
−
=
∂
∂
2 2 i i i i iN
x
x
x
Nx
y
m
where,
2 1 1 2 1 1 1⎟
⎠
⎞
⎜
⎝
⎛
−
−
=
∑
∑
∑
∑
∑
= = = = = N i i N i i N i i N i i N i i ix
x
N
y
x
y
x
N
m
9
For a six-degree-of –freedom dynamometer system, the uncertainty in each of the element of
the interaction matrix is obtained using equation 2-10 where
U
x1and
U
y1are the uncertainties
in the voltage and applied load measurements for each of the
N
loading conditions.
In the present case, a total loading cases of
N
=195 was obtained. The applied loads to the
calibration frame designed specifically for the dynamometer system (Islam 2006c) were
converted to forces and moments in the three coordinate directions. In the matrix form, the
forces and moments and the corresponding voltage output from the six-component
dynamometer are expressed as:
⎥
⎥
⎥
⎥
⎥
⎥
⎦
⎤
⎢
⎢
⎢
⎢
⎢
⎢
⎣
⎡
−
−
−
−
−
−
−
−
−
−
−
−
−
−
−
−
−
−
−
−
−
−
−
−
−
−
=
6
,
195
1
,
195
6
,
1
1
,
1
F
F
F
F
F
and
⎥
⎥
⎥
⎥
⎥
⎥
⎦
⎤
⎢
⎢
⎢
⎢
⎢
⎢
⎣
⎡
−
−
−
−
−
−
−
−
−
−
−
−
−
−
−
−
−
−
−
−
−
−
−
−
−
−
=
6
,
195
1
,
195
6
,
1
1
,
1
V
V
V
V
V
The
F
and
V
matrices used to calculate the uncertainties in the global components of the
dynamometer are given in Appendix B. The uncertainties in the interaction matrix were then
obtained using the equation 2-10. Each of the 36 elements of the interaction matrix had
corresponding uncertainties that were calculated using equation 2-10. It is to be noted that the
uncertainties in each elements in the
F
and
V
matrix is assumed to be equal for simplicity, as
described in Appendix B. The Interaction matrix and the uncertainties in each of the 36
elements are given in the following two matrices.
Interaction/Calibration Matrix=
514.9000
455.1000
1178.7000
2303.9000
1666.2000
1333.1000
773.9000
714.2000
866.7000
165.5000
80.0000
2552.9000
-755.6000
414.6000
248.2000
1421.4000
978.0000
1380.6000
156.6000
12.1000
131.6000
246.9000
491.1000
7.3000
1.7000
15.5000
48.8000
519.2000
42.2000
23.7000
11.9000
79.8000
249.0000
195.6000
107.9000
718.3000
=
C
10
Bias Uncertainties in the Interaction/Calibration Matrix=
0.1730
0.2303
0.2179
0.8201
0.2972
0.2050
0.1995
0.2656
0.2513
0.9464
0.3428
0.2364
0.1876
0.2498
0.2363
0.8899
0.3224
0.2223
0.0438
0.0573
0.0544
0.1969
0.0732
0.0513
0.0458
0.0601
0.0570
0.2070
0.0767
0.0537
0.0882
0.1171
0.1109
0.4143
0.1508
0.1043
U
C=
Next thing to do in the uncertainty analysis of the dynamometer is to consider how the
uncertainties in the calibration matrix propagate into a future calculation. A general formula
for the uncertainty, U
R, which propagates into a results, R, from uncertainties in M different
variables, X
i; i=1,2,……,M, where R=R(X
1, X
2,……..X
M) is given by (Hess et al. 1999):
2 1 2 2 3 2 2 2 1 3 2 1 / X n X X X R
X
U
nR
...
...
...
U
X
R
U
X
R
U
X
R
U
⎥
⎥
⎦
⎤
⎢
⎢
⎣
⎡
⎟⎟
⎠
⎞
⎜⎜
⎝
⎛
∂
∂
+
+
⎟⎟
⎠
⎞
⎜⎜
⎝
⎛
∂
∂
+
⎟⎟
⎠
⎞
⎜⎜
⎝
⎛
∂
∂
+
⎟⎟
⎠
⎞
⎜⎜
⎝
⎛
∂
∂
=
(2-11)
In the present case of the six component dynamometer, the defining equation,
F
=
VA,
where
F=F(F
X, F
Y, F
Z, M
X, M
Y, M
Z)
gives us:
6 16 5 15 4 14 3 13 2 12 1 11V
C
V
C
V
C
V
C
V
C
V
C
F
X=
+
+
+
+
+
6 26 5 25 4 24 3 23 2 22 1 21V
C
V
C
V
C
V
C
V
C
V
C
F
Y=
+
+
+
+
+
6 36 5 35 4 34 3 33 2 32 1 31V
C
V
C
V
C
V
C
V
C
V
C
F
Z=
+
+
+
+
+
6 46 5 45 4 44 3 43 2 42 1 41V
C
V
C
V
C
V
C
V
C
V
C
M
X=
+
+
+
+
+
6 56 5 55 4 54 3 53 2 52 1 51V
C
V
C
V
C
V
C
V
C
V
C
M
Y=
+
+
+
+
+
6 66 5 65 4 64 3 63 2 62 1 61V
C
V
C
V
C
V
C
V
C
V
C
M
Z=
+
+
+
+
+
Now applying equation 2-2 to these equations yielded:
2 1 2 6 2 5 2 4 2 3 2 2 2 1 2 16 2 15 2 14 2 13 2 12 2 11 6 5 4 3 2 1 16 15 14 13 12 11 / V X V X V X V X V X V X C X C X C X C X C X C X F
U
V
F
U
V
F
U
V
F
U
V
F
U
V
F
U
V
F
U
C
F
U
C
F
U
C
F
U
C
F
U
C
F
U
C
F
U
X⎥
⎥
⎥
⎥
⎥
⎦
⎤
⎢
⎢
⎢
⎢
⎢
⎣
⎡
⎟⎟
⎠
⎞
⎜⎜
⎝
⎛
∂
∂
+
⎟⎟
⎠
⎞
⎜⎜
⎝
⎛
∂
∂
+
⎟⎟
⎠
⎞
⎜⎜
⎝
⎛
∂
∂
+
⎟⎟
⎠
⎞
⎜⎜
⎝
⎛
∂
∂
+
⎟⎟
⎠
⎞
⎜⎜
⎝
⎛
∂
∂
+
⎟⎟
⎠
⎞
⎜⎜
⎝
⎛
∂
∂
+
⎟⎟
⎠
⎞
⎜⎜
⎝
⎛
∂
∂
+
⎟⎟
⎠
⎞
⎜⎜
⎝
⎛
∂
∂
+
⎟⎟
⎠
⎞
⎜⎜
⎝
⎛
∂
∂
+
⎟⎟
⎠
⎞
⎜⎜
⎝
⎛
∂
∂
+
⎟⎟
⎠
⎞
⎜⎜
⎝
⎛
∂
∂
+
⎟⎟
⎠
⎞
⎜⎜
⎝
⎛
∂
∂
=
11
Which reduces to
(
) (
)
(
)
(
)
(
) (
)
(
) (
)
(
)
(
)
(
) (
)
2 1 2 16 2 15 2 14 2 13 2 12 2 11 2 6 2 5 2 4 2 3 2 2 2 1 6 5 4 3 2 1 16 15 14 13 12 11 / V V V V V V C C C C C C FU
C
U
C
U
C
U
C
U
C
U
C
U
V
U
V
U
V
U
V
U
V
U
V
U
X⎥
⎥
⎦
⎤
⎢
⎢
⎣
⎡
+
+
+
+
+
+
+
+
+
+
+
=
In a similar fashion we get,
(
) (
)
(
)
(
)
(
) (
)
(
) (
)
(
)
(
)
(
) (
)
2 1 2 26 2 25 2 24 2 23 2 22 2 21 2 6 2 5 2 4 2 3 2 2 2 1 6 5 4 3 2 1 26 25 24 23 22 21 / V V V V V V C C C C C C FU
C
U
C
U
C
U
C
U
C
U
C
U
V
U
V
U
V
U
V
U
V
U
V
U
Y⎥
⎥
⎦
⎤
⎢
⎢
⎣
⎡
+
+
+
+
+
+
+
+
+
+
+
=
These equations and the rest four components when put in the matrix form yielded:
6 5 4 3 2 1 66 62 61 26 22 21 16 15 14 13 12 11 6 5 4 3 2 1 66 61 26 21 16 15 14 13 12 11 V V V V V V C C C C C C C C C C C C M M M F F F
U
U
U
U
U
U
V
V
V
V
V
V
C
C
U
U
U
C
C
U
U
U
C
C
C
C
C
C
U
U
U
U
U
U
U
U
U
U
U
U
Z Y X Z Y X×
−
−
−
−
−
−
−
−
−
−
−
−
−
−
−
−
−
−
−
−
−
−
−
−
−
−
−
−
−
−
−
−
−
−
−
−
−
−
−
−
−
−
−
−
−
−
−
−
−
−
=
12
2-3 Results on Uncertainties
The details of the uncertainty calculation for each component of the dynamometer are
provided in Appendix B.
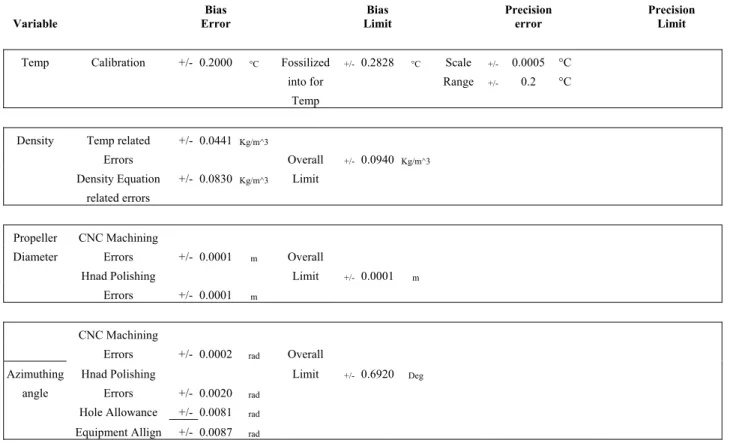
Table 2-2 summarizes the bias and precision limit estimated for the podded propulsors
obtained using the approach described in Appendix B.
Table 2-2. List of performance coefficients for the podded propulsor unit.
Variable Bias Error Bias Limit Precision error Precision Limit
Temp Calibration +/- 0.2000 °C Fossilized +/- 0.2828 °C Scale +/- 0.0005 °C
into for Range +/- 0.2 °C
Temp
Density Temp related +/- 0.0441 Kg/m^3
Errors Overall +/- 0.0940 Kg/m^3
Density Equation +/- 0.0830 Kg/m^3 Limit
related errors
Propeller CNC Machining
Diameter Errors +/- 0.0001 m Overall
Hnad Polishing Limit +/- 0.0001 m
Errors +/- 0.0001 m
CNC Machining
Errors +/- 0.0002 rad Overall
Azimuthing Hnad Polishing Limit +/- 0.6920 Deg
angle Errors +/- 0.0020 rad
Hole Allowance +/- 0.0081 rad
13
Variable Bias Error Bias Limit Precision error Precision Limit J=0.0 +/- 0.0100 rps J=0.1 +/- 0.0132 rps J=0.2 +/- 0.0124 rps J=0.3 +/- 0.0098 rps Shaft Techometer J=0.4 +/- 0.0118 rpsSpeed Reading Error +/- 0.0080 rps J=0.5 +/- 0.0117 rps
A/D Error +/- 0.0079 rps Overall J=0.6 +/- 0.0129 rps
Curve Fit Error +/- 0.0320 rps Limit +/- 0.0500 rps J=0.7 +/- 0.0124 rps
Static Zero Error +/- 0.0241 rps J=0.8 +/- 0.0114 rps
A/D Error +/- 0.0079 rps J=0.9 +/- 0.0111 rps J=1.0 +/- 0.0097 rps J=1.1 +/- 0.0126 rps J=1.2 +/- 0.0122 rps J=0.0 +/- 0.0001 m/s J=0.1 +/- 0.0000 m/s J=0.2 +/- 0.0001 m/s Calibration Error +/- 0.0050 m/s J=0.3 +/- 0.0002 m/s A/D Error +/- 0.0010 m/s J=0.4 +/- 0.0000 m/s
Wheel Dia Error +/- 0.0001 m/s Overall J=0.5 +/- 0.0001 m/s
Advance Tide Error +/- 0.0010 m/s Limit +/- 0.0154 m/s J=0.6 +/- 0.0003 m/s
Speed Curve Fit Error +/- 0.0143 m/s J=0.7 +/- 0.0008 m/s
A/D Error +/- 0.0010 m/s J=0.8 +/- 0.0005 m/s
Static Zero Error +/- 0.0024 m/s J=0.9 +/- 0.0008 m/s
J=1.0 +/- 0.0006 m/s J=1.1 +/- 0.0012 m/s J=1.2 +/- 0.0012 m/s J=0.0 +/- 0.3824 N J=0.1 +/- 0.1408 N J=0.2 +/- 0.4024 N Weights Error +/- 0.0003 N J=0.3 +/- 0.5376 N
Load Angle Error +/- 0.0114 N J=0.4 +/- 0.3261 N
Load Cell Align +/- 0.0005 N J=0.5 +/- 0.5898 N
Propeller Static Zero Error +/- 0.0356 N J=0.6 +/- 0.5319 N
Thrust A/D Card Error +/- 0.6041 N Overall J=0.7 +/- 0.3637 N
Curve Fit Error +/- 2.0439 N Limit +/- 2.2159 N J=0.8 +/- 0.1126 N
Equipment Align +/- 0.0114 N J=0.9 +/- 0.0239 N
Load Cell Align +/- 0.0005 N J=1.0 +/- 0.1432 N
Static Zero Error +/- 0.0356 N J=1.1 +/- 0.5068 N
14
Variable Error Bias LimitBias Precision error Precision Limit
J=0.0 +/- 0.0017 Nm
J=0.1 +/- 0.0362 Nm
J=0.2 +/- 0.0247 Nm
Calibration Error +/- 0.0008 Nm J=0.3 +/- 0.0191 Nm
Static Zero Error +/- 0.0217 Nm J=0.4 +/- 0.0048 Nm
A/D Card Error +/- 0.0171 Nm Overall J=0.5 +/- 0.0066 Nm
Propeller Curve Fit Error +/- 0.0557 Nm Limit +/- 0.0662 Nm J=0.6 +/- 0.0419 Nm
Torque Equipment Align +/- 0.0005 Nm J=0.7 +/- 0.0126 Nm
Static Zero Error +/- 0.0152 Nm J=0.8 +/- 0.0361 Nm
A/D Card Error +/- 0.0171 Nm J=0.9 +/- 0.0211 Nm
J=1.0 +/- 0.0589 Nm J=1.1 +/- 0.0216 Nm J=1.2 +/- 0.0096 Nm Overall Limit J=0.0 +/- 0.6391 N J=0.0 +/- 1.2450 N J=0.1 +/- 0.6391 N J=0.1 +/- 0.7886 N J=0.2 +/- 0.6391 N J=0.2 +/- 0.9099 N Weights Error +/- 0.0014 N J=0.3 +/- 0.6392 N J=0.3 +/- 0.8143 N
Load Angle Error +/- 0.0114 N J=0.4 +/- 0.6392 N J=0.4 +/- 0.9623 N
Load Cell Align +/- 0.0114 N J=0.5 +/- 0.6394 N J=0.5 +/- 0.9832 N
Unit Static Zero Error +/- 0.0356 N J=0.6 +/- 0.6395 N J=0.6 +/- 0.7479 N
Thrust A/D Card Error +/- 0.2014 N J=0.7 +/- 0.6397 N J=0.7 +/- 0.8920 N
Curve Fit Error +/- -0.0559 N J=0.8 +/- 0.6401 N J=0.8 +/- 0.8374 N
Equipment Align +/- 0.0114 N J=0.9 +/- 0.6403 N J=0.9 +/- 1.2828 N
Load Cell Align +/- 0.0005 N J=1.0 +/- 0.6406 N J=1.0 +/- 0.9188 N
Static Zero Error +/- 0.0356 N J=1.1 +/- 0.6411 N J=1.1 +/- 1.0128 N
A/D Card Error +/- 0.6041 N J=1.2 +/- 0.6415 N J=1.2 +/- 0.5676 N
Overall Limit J=0.0 +/- 0.7626 N J=0.0 +/- 0.8558 N J=0.1 +/- 0.7626 N J=0.1 +/- 1.0702 N J=0.2 +/- 0.7591 N J=0.2 +/- 0.8474 N Weights Error +/- 0.0014 N J=0.3 +/- 0.7530 N J=0.3 +/- 0.6915 N
Load Angle Error +/- 0.0114 N J=0.4 +/- 0.7516 N J=0.4 +/- 1.1776 N
Load Cell Align +/- 0.0114 N J=0.5 +/- 0.7476 N J=0.5 +/- 0.9410 N
Side Static Zero Error +/- 0.0356 N J=0.6 +/- 0.7456 N J=0.6 +/- 0.8047 N
Force A/D Card Error +/- 0.2014 N J=0.7 +/- 0.7429 N J=0.7 +/- 1.0712 N
Curve Fit Error +/- 0.4162 N J=0.8 +/- 0.7397 N J=0.8 +/- 1.1341 N
Equipment Align +/- 0.0114 N J=0.9 +/- 0.7374 N J=0.9 +/- 0.9027 N
Load Cell Align +/- 0.0005 N J=1.0 +/- 0.7353 N J=1.0 +/- 1.0157 N
Static Zero Error +/- 0.0356 N J=1.1 +/- 0.7318 N J=1.1 +/- 0.8930 N
15
Variable Bias Error Bias Limit Precision error Precision Limit Overall Limit J=0.0 +/- 1.8743 N J=0.0 +/- 0.4463 N J=0.1 +/- 1.8747 N J=0.1 +/- 0.5393 N J=0.2 +/- 1.8368 N J=0.2 +/- 0.4013 N Weights Error +/- 0.0014 N J=0.3 +/- 1.7673 N J=0.3 +/- 0.4272 NLoad Angle Error +/- 0.0114 N J=0.4 +/- 1.7529 N J=0.4 +/- 0.6584 N
Load Cell Align +/- 0.0114 N J=0.5 +/- 1.7076 N J=0.5 +/- 0.6634 N
Vertical Static Zero Error +/- 0.0356 N J=0.6 +/- 1.6865 N J=0.6 +/- 0.6921 N
Force A/D Card Error +/- 0.2014 N J=0.7 +/- 1.6560 N J=0.7 +/- 0.7357 N
Curve Fit Error +/- 1.7620 N J=0.8 +/- 1.6193 N J=0.8 +/- 0.6908 N
Equipment Align +/- 0.0114 N J=0.9 +/- 1.5930 N J=0.9 +/- 0.7486 N
Load Cell Align +/- 0.0005 N J=1.0 +/- 1.5695 N J=1.0 +/- 0.6885 N
Static Zero Error +/- 0.0356 N J=1.1 +/- 1.5286 N J=1.1 +/- 0.5180 N
A/D Card Error +/- 0.6041 N J=1.2 +/- 1.5016 N J=1.2 +/- 0.5110 N
Overall Limit J=0.0 +/- 0.5243 J=0.0 +/- 2.3265 Nm J=0.1 +/- 0.5240 J=0.1 +/- 1.2123 Nm J=0.2 +/- 0.5130 J=0.2 +/- 0.9070 Nm Calibration Error +/- 0.0081 Nm J=0.3 +/- 0.4931 J=0.3 +/- 0.9807 Nm
Static Zero Error +/- 0.0217 Nm J=0.4 +/- 0.4885 J=0.4 +/- 0.8905 Nm
A/D Card Error +/- 0.0098 Nm J=0.5 +/- 0.4752 J=0.5 +/- 0.8255 Nm
Axial Curve Fit Error +/- -0.5235 Nm J=0.6 +/- 0.4688 Nm J=0.6 +/- 0.9849 Nm
Moment Equipment Align +/- 0.0005 Nm J=0.7 +/- 0.4597 J=0.7 +/- 1.1349 Nm
Static Zero Error +/- 0.0087 Nm J=0.8 +/- 0.4487 J=0.8 +/- 0.5787 Nm
A/D Card Error +/- 0.0098 Nm J=0.9 +/- 0.4407 J=0.9 +/- 0.4877 Nm
J=1.0 +/- 0.4335 J=1.0 +/- 0.1552 Nm J=1.1 +/- 0.4211 J=1.1 +/- 0.4179 Nm J=1.2 +/- 0.4126 J=1.2 +/- 0.4890 Nm Overall Limit J=0.0 +/- 2.0743 J=0.0 +/- 1.2884 Nm J=0.1 +/- 2.0743 J=0.1 +/- 0.9576 Nm J=0.2 +/- 2.0765 J=0.2 +/- 1.0572 Nm Calibration Error +/- 0.0202 Nm J=0.3 +/- 2.0809 J=0.3 +/- 0.8891 Nm
Static Zero Error +/- 0.9536 Nm J=0.4 +/- 2.0818 J=0.4 +/- 0.9239 Nm
A/D Card Error +/- 1.0742 Nm J=0.5 +/- 2.0848 J=0.5 +/- 0.5615 Nm
Vertical Curve Fit Error +/- 0.4192 Nm J=0.6 +/- 2.0863 Nm J=0.6 +/- 0.2293 Nm
Moment Equipment Align +/- 0.0005 Nm J=0.7 +/- 2.0884 J=0.7 +/- 0.8934 Nm
Static Zero Error +/- 0.9536 Nm J=0.8 +/- 2.0910 J=0.8 +/- 0.8517 Nm
A/D Card Error +/- 1.0742 Nm J=0.9 +/- 2.0929 J=0.9 +/- 0.7744 Nm
J=1.0 +/- 2.0946 J=1.0 +/- 0.5021 Nm
J=1.1 +/- 2.0977 J=1.1 +/- 0.2432 Nm
16
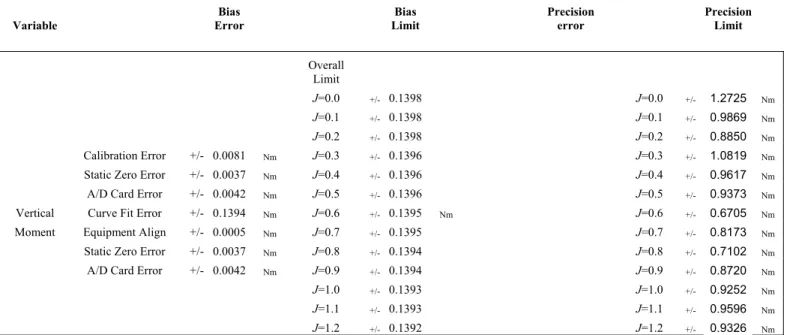
Variable Bias Error Bias Limit Precision error Precision Limit Overall Limit J=0.0 +/- 0.1398 J=0.0 +/- 1.2725 Nm J=0.1 +/- 0.1398 J=0.1 +/- 0.9869 Nm J=0.2 +/- 0.1398 J=0.2 +/- 0.8850 Nm Calibration Error +/- 0.0081 Nm J=0.3 +/- 0.1396 J=0.3 +/- 1.0819 NmStatic Zero Error +/- 0.0037 Nm J=0.4 +/- 0.1396 J=0.4 +/- 0.9617 Nm
A/D Card Error +/- 0.0042 Nm J=0.5 +/- 0.1396 J=0.5 +/- 0.9373 Nm
Vertical Curve Fit Error +/- 0.1394 Nm J=0.6 +/- 0.1395 Nm J=0.6 +/- 0.6705 Nm
Moment Equipment Align +/- 0.0005 Nm J=0.7 +/- 0.1395 J=0.7 +/- 0.8173 Nm
Static Zero Error +/- 0.0037 Nm J=0.8 +/- 0.1394 J=0.8 +/- 0.7102 Nm
A/D Card Error +/- 0.0042 Nm J=0.9 +/- 0.1394 J=0.9 +/- 0.8720 Nm
J=1.0 +/- 0.1393 J=1.0 +/- 0.9252 Nm
J=1.1 +/- 0.1393 J=1.1 +/- 0.9596 Nm
J=1.2 +/- 0.1392 J=1.2 +/- 0.9326 Nm
The biases and precision limits were combined using RSS to determine the overall
uncertainty estimates for each of the variables of interests as shown in Table 2-3.
Table 2-3: Overall uncertainty estimates for podded propulsor variables.
J U
ρU
DU
AAU
nU
VAU
TPropU
QU
TUnitU
FYU
FZU
MXU
MYU
MZ0.0
0.0940 0.0940 0.0940 0.0940 0.0940 0.0940 0.0940 0.0940 0.0940 0.0940 0.0940 0.09400.0940
0.1
0.0001 0.0001 0.0001 0.0001 0.0001 0.0001 0.0001 0.0001 0.0001 0.0001 0.0001 0.00010.0001
0.2
0.0508 0.0525 0.0522 0.0528 0.0521 0.0530 0.0530 0.0521 0.0530 0.0522 0.0528 0.05210.0531
0.3
0.0154 0.0154 0.0154 0.0154 0.0154 0.0154 0.0154 0.0154 0.0154 0.0154 0.0154 0.01540.0154
0.4
2.2789 2.2760 2.2536 2.2733 2.2479 2.3497 2.2369 2.2485 2.3954 2.3153 2.3699 2.35692.4384
0.5
0.0662 0.0769 0.0749 0.0682 0.0664 0.0666 0.0803 0.0674 0.0794 0.0702 0.0852 0.07140.0662
0.6
1.0823 0.7920 0.8550 0.9309 1.0273 0.9319 1.0607 1.1925 3.7040 1.1706 0.8736 0.6411-0.7897
0.7
1.2523 1.2528 1.4277 1.0634 1.3137 1.2702 1.1249 1.2815 1.2639 1.2136 1.0864 1.01821.1486
0.8
1.9170 1.9307 1.9085 1.8383 1.8736 1.8569 1.8593 1.8510 1.7746 1.7178 1.7100 1.61351.5827
0.9
1.9880 1.3465 1.1181 1.1284 0.9637 0.8465 0.9178 1.0239 0.7071 0.5921 -0.4653 -0.6530-0.6875
1.0
2.5301 2.2517 2.2774 2.3626 2.3299 2.1401 2.1009 2.2418 2.2393 2.1941 2.1608 2.1106-2.1477
1.1
1.3076 0.8556 0.9633 0.9827 1.2638 0.8930 0.6993 0.7820 0.6724 1.0635 0.9901 0.95680.9520
1.2
0.0940 0.0940 0.0940 0.0940 0.0940 0.0940 0.0940 0.0940 0.0940 0.0940 0.0940 0.09400.0940
Substitution of the uncertainty values from Table 2-3 into the appropriate uncertainty
equations (equations 2-1 to 2-9) yielded the overall uncertainty levels for the propulsive
performance coefficients of the podded propulsors as summarized in Table 2-4 and 2-5. The
uncertainty estimates were based on the test and calibration data presented in the reports:
Islam, 2006a, Islam 2006b and Islam 2006c).
17
Table 2-4: Overall uncertainties in advance coefficients, propeller thrust and torque
coefficients and unit thrust coefficients.
Advance Coefficient Value Advance Coefficient J (+/-) Advance Coefficient Error (+/-) Propeller Thrust Coefficient KTProp (+/-) Propeller Thrust Coefficient Error (+/-) Propeller Torque Coefficient KQ (+/-) Propeller Torque Coefficient Error (+/-) Unit Thrust Coefficient KTUnit (+/-) Unit Thrust Coefficient Error (+/-)
0.00 - - 5.78E-03 1.21 7.61E-03 1.11 4.75E-03 1.01
0.10 5.20E-03 5.20 5.59E-03 1.24 7.57E-03 1.17 4.39E-03 1.00
0.20 5.27E-03 2.63 5.28E-03 1.28 7.25E-03 1.20 4.05E-03 1.02
0.30 5.37E-03 1.79 5.02E-03 1.34 6.68E-03 1.19 3.74E-03 1.05
0.40 5.52E-03 1.38 4.74E-03 1.42 6.27E-03 1.23 3.40E-03 1.08
0.50 5.70E-03 1.14 4.62E-03 1.60 5.90E-03 1.28 3.07E-03 1.13
0.60 5.90E-03 0.98 4.22E-03 1.71 5.92E-03 1.45 2.66E-03 1.17
0.70 6.15E-03 0.88 4.02E-03 1.96 5.18E-03 1.47 2.44E-03 1.33
0.80 6.40E-03 0.80 3.33E-03 2.03 5.30E-03 1.79 5.22E-03 3.71
0.90 6.71E-03 0.75 2.89E-03 2.40 4.66E-03 2.00 2.21E-03 2.30
1.00 7.02E-03 0.70 2.43E-03 3.21 4.94E-03 2.94 1.43E-03 2.86
1.10 7.32E-03 0.67 1.43E-03 4.85 4.15E-03 4.38 9.99E-04 2.80
1.20 7.67E-03 0.64 -2.26E-03 12.58 3.82E-03 45.91 -1.34E-03 2.70
Table 2-5: Overall uncertainties in global forces and moments in the three orthogonal
directions for the podded propulsors.
Advance Coeff. Value Axial Force Coeff. KFX (+/-) Axial Force Coeff. Error (+/-) Side Force Coeff. KFY (+/-) Side Force Coeff. Error (+/-) Vertical Force Coeff. KFZ (+/-) Vertical Force Coeff. Error (+/-) Axial Moment Coeff. KMX (+/-) Axial Moment Coeff. Error (+/-) Vertical Moment Coeff. KYX (+/-) Vertical Moment Coeff. Error (+/-) Steering Moment Coeff. KZX (+/-) Steering Moment Coeff. Error (+/-)
0.00
4.76E-03 1.01 1.37E-03 4.33 3.01E-03 17.02 1.83E-02 2.08 1.44E-02 5.23 1.89E-02 1.040.10
4.86E-03 1.11 1.47E-03 4.75 3.02E-03 15.71 1.12E-02 1.41 1.34E-02 4.93 1.96E-02 1.130.20
4.44E-03 1.11 1.46E-03 4.77 2.94E-03 15.14 9.88E-03 1.40 1.34E-02 4.87 1.82E-02 1.130.30
4.08E-03 1.15 1.35E-03 4.95 2.89E-03 14.92 9.91E-03 1.66 1.40E-02 4.89 1.72E-02 1.150.40
3.67E-03 1.16 1.49E-03 5.64 2.90E-03 15.98 8.06E-03 1.56 1.36E-02 5.75 1.60E-02 1.160.50
3.20E-03 1.18 1.44E-03 6.21 2.92E-03 15.59 6.39E-03 1.59 1.26E-02 4.79 1.44E-02 1.170.60
2.93E-03 1.29 1.45E-03 7.33 2.86E-03 16.63 6.51E-03 2.04 1.24E-02 5.09 1.26E-02 1.150.70
2.60E-03 1.42 1.37E-03 7.92 2.80E-03 16.51 6.41E-03 2.71 1.31E-02 5.98 1.16E-02 1.190.80
4.47E-03 3.18 1.39E-03 8.93 2.81E-03 17.53 4.23E-03 2.63 1.31E-02 7.25 1.04E-02 1.220.90
2.18E-03 2.27 1.39E-03 9.95 2.72E-03 16.70 3.75E-03 4.50 1.30E-02 9.81 9.88E-03 1.331.00
1.56E-03 3.13 1.40E-03 11.64 2.70E-03 16.68 -2.66E-03 4.76 1.25E-02 14.46 8.65E-03 1.361.10
9.99E-04 2.80 1.34E-03 11.90 2.56E-03 15.15 -3.98E-03 5.07 1.22E-02 69.82 7.47E-03 1.4218
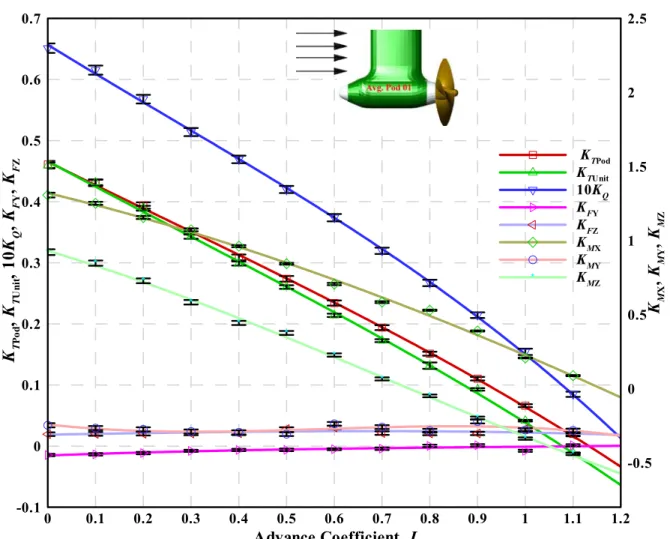
From Table 2-4 and 2-5, it can be seen that the uncertainty levels of the propeller thrust
coefficient are higher than those of the unit thrust coefficient. However, the uncertainty in
torque coefficient is comparable with that of the bare propeller test uncertainty presented in
Bose and Luznik (1998). Applying the uncertainty limits to the performance curves of
average pod 01 in the form of error bars results in a plot as shown in Figure 2-2.
* * * * * * * * * * * *