Publisher’s version / Version de l'éditeur:
ASHRAE Transactions, 112, Pt. 2, pp. 1-13, 2006-06-01
READ THESE TERMS AND CONDITIONS CAREFULLY BEFORE USING THIS WEBSITE. https://nrc-publications.canada.ca/eng/copyright
Vous avez des questions? Nous pouvons vous aider. Pour communiquer directement avec un auteur, consultez la première page de la revue dans laquelle son article a été publié afin de trouver ses coordonnées. Si vous n’arrivez pas à les repérer, communiquez avec nous à [email protected].
Questions? Contact the NRC Publications Archive team at
[email protected]. If you wish to email the authors directly, please see the first page of the publication for their contact information.
NRC Publications Archive
Archives des publications du CNRC
This publication could be one of several versions: author’s original, accepted manuscript or the publisher’s version. / La version de cette publication peut être l’une des suivantes : la version prépublication de l’auteur, la version acceptée du manuscrit ou la version de l’éditeur.
Access and use of this website and the material on it are subject to the Terms and Conditions set forth at
Validation of skylight performance assessment software
Laouadi, A.; Arsenault, C. D.
https://publications-cnrc.canada.ca/fra/droits
L’accès à ce site Web et l’utilisation de son contenu sont assujettis aux conditions présentées dans le site LISEZ CES CONDITIONS ATTENTIVEMENT AVANT D’UTILISER CE SITE WEB.
NRC Publications Record / Notice d'Archives des publications de CNRC:
https://nrc-publications.canada.ca/eng/view/object/?id=8148b72e-0fe9-40d2-a81f-03d03b66a26f https://publications-cnrc.canada.ca/fra/voir/objet/?id=8148b72e-0fe9-40d2-a81f-03d03b66a26fhttp://irc.nrc-cnrc.gc.ca
Validation of skylight performance assessment software
N R C C - 4 6 4 2 5
L a o u a d i , A . ; A r s e n a u l t , C .
A version of this document is published in / Une version de ce
document se trouve dans: ASHRAE Transactions, v. 112, pt. 2, 2006,
pp. 1-13
Validation of Skylight Performance
Assessment Software
A. Laouadi1, Ph.D., ASHRAE member, and C. Arsenault
ABSTRACT
This paper presents a comparison study between the simulations of SkyVision and measurements made in a scale model. SkyVision is a computer tool to calculate the overall optical characteristics, indoor daylight availability and energy saving potential of projecting and tubular skylights. The measurements included the overall visible transmittance and indoor daylight illuminance of the skylight. A rectangular wooden box was used as a scale model of a simple commercial building. The top surface of the box was fitted with a curbed opening to accommodate the skylights to be tested. Seven skylight shapes were tested: two circular dome models, one with clear and one with white acrylic glazing; two rectangular bubble dome models, one with clear and one with white acrylic glazing; a clear acrylic hexagonal pyramid model; a clear polycarbonate barrel vault model; and a tubular skylight model. The measurements were conducted for a whole day period, thereby covering different sky conditions: overcast, partly cloudy and clear sunny skies. SkyVision’s simulations for the skylight transmittance compared reasonably well with the actual measurements, except for the hexagonal pyramidal skylight. The hexagonal pyramid surface exhibited some lens effects around the surface vertices, which were not possible to model in SkyVision. As for the skylight indoor illuminance comparison, the SkyVision’s simulations were in good agreement with the actual measurements for all occurrences of sky conditions.
INTRODUCTION
Skylights are important architectural design elements of many building types such as commercial, institutional, and industrial buildings and houses. They connect building occupants to the changing outside environment, and provide the architectural spaces with natural illumination and solar heat. Properly designed skylights may save a substantial amount of energy for lighting, heating and cooling (Laouadi, 2004; McHugh et al., 2004), and help avoid peak energy demands and therefore reduce utility costs. Recent research has shown that the skylight shape and glazing type can significantly alter the skylight energy performance (Laouadi, 2004; Laouadi and Atif, 2002). The air space underneath the skylight may reduce the solar heat gains by up to 25% (Klems, 2003), the annual cooling energy by up to 6%, and heating/cooling peak loads by up to 15% (Laouadi et al., 2002). Furthermore, some studies around the world showed that skylights may improve non-energy aspects of buildings such as retail sales (HMG, 2003; HMG, 1999).
However, the potential energy benefits and amenities of skylights have not been fully exploited in today’s building designs due to some theoretical and technical challenges. The lack of design tools is one of the major hurdles building designers face to adopt such products and quantify their energy benefits. Currently available fenestration simulation software deals with only planar and transparent geometry, such as windows and flat skylights (CANMET, 2004; LBL, 2003a). Sophisticated lighting simulation software (LBL, 2003b; LT, 2003; IEA, 2000) are not only cumbersome to use, but they do not provide any output related to the skylight optical characteristics required for product rating and selection. Specialized skylight
1
A. Laouadi is a Research Officer at the Institute for Research in Construction of the National Research Council, Ottawa, Ontario, Canada. C. Arsenault is a Technical Officer at the Institute for Research in Construction of the National Research Council, Ottawa, Ontario, Canada.
software are very rare and limited. The SkyCalc program (HMG, 2003) is limited to some USA climate regions, and handles only flat translucent skylights.
Recognizing the limitations of the current fenestration computer tools, we developed SkyVision, a computer program to assess skylight performance. SkyVision aims to assist skylight manufacturers and building designers in developing appropriate skylight designs for given building types and daylighting applications. SkyVision may also help fenestration rating councils to rate skylight products. The current version of SkyVision calculates the overall optical characteristics of projecting and tubular skylights, performance indicators of skylight/room interfaces, indoor daylight availability, and monthly/annual lighting energy savings. To maximize the energy-saving potential of skylights, SkyVision accounts for the skylight shape, size and glazing type, curb/well geometry, building location and orientation, lighting and shading controls, and prevailing climate. Two beta versions of the program were released for evaluation by the end-users. This was followed by extensive measurements and comparison studies to validate the software’s simulations. The user’s feedback and comparison studies were extremely useful to shape the final look of the software and fine-tune its simulations models. The final version of SkyVision is now available free of charge on the web (http://irc.nrc-cnrc.gc.ca/ie/light/skyvision/). More details on the program can also be found in the distribution web site.
OBJECTIVES
The purpose of this paper is to conduct a validation study between SkyVision’s simulations and measurements carried out under real sky conditions. The measurements included the visible transmittance of the skylight and the indoor daylight illuminance. More details on the comparison study may be found in the report by Laouadi and Arsenault (2004). The report also includes additional comparison studies that used the experimental results of the California Public Interest Energy Research (PIER) program (McHugh et al., 2004). Other comparison studies (model to model comparisons) are found in Laouadi et al. (2003a) and (2003b). The specific objectives of this paper are to outline the measurement methodology and analyze the comparison results.
CALCULATION ENGINE OF SKYVISION
Simulation of skylight performance is a challenging task to the modeler since skylights come in limitless shapes and sizes through standard or custom-made products. Furthermore, modern skylight products employ optically-complex glazing such as partially diffusing, coated or prismatic glazing, which further complicates the problem. SkyVision uses a newly-developed concept, the Shape Parameter, to handle the skylight geometry, models based on the ray-tracing technique to compute the transmission, absorption and refection of the incident radiation on the skylight surface, and a new zonal model to compute daylight distribution on indoor surfaces.
The Concept of the Shape Parameter
The concept of the shape parameter stems from the fact that the diffuse (hemispherical) optical characteristics of skylights with translucent glazing do not depend on the skylight shape, but rather on a geometrical parameter. Calculation of the skylight optical characteristics may therefore be performed on an arbitrary representative shape. Other skylight shapes are converted to the representative shape through the use of the Shape Parameter. The skylight representative shape is chosen so that calculation of skylight performance is straightforward to perform. However, for skylights with transparent glazing under beam radiation, the method of the Shape Parameter becomes an approximation, and therefore the arbitrariness of the representative shape is lost. To remedy to this problem, a representative shape is selected for a given category of skylight shapes. For example, a circular hemispherical dome is representative of segmented domes (with any number of horizontal or meridian segments) and square-based bubbles.
Simulation Algorithms
Once the real skylight shape is converted to the representative shape, the ray-tracing method is applied in closed form formulation to compute the overall optical characteristics of the skylight based on the optical properties of the flat glazing sheets making up the skylight. The optics algorithms of the current version of SkyVision employ the broadband monolithic model (Rubin et al., 1998) to compute the optical properties of a composite glazing pane at oblique incidence angles for each light polarization component. The
algorithms may handle clear, or diffusing glazing. The zonal model, in which the space below the skylight is split into a number of vertical zones, combines the flux transfer method to compute the diffuse and inter-reflected components of surface light fluxes, and a ray-tracing based method to compute the direct components of surface fluxes. In addition, SkyVision employs a number of standard sky conditions (which do not change with daytime hour) and weather-based dynamic sky conditions (which change with daytime hour).
MEASUREMENT METHODOLOGY
Projecting skylights exhibit different performance than planar fenestration (Laouadi and Atif, 1998, 2002; McHugh et al., 2004). One of the most important parameters of skylights is their optical properties. Skylight optical properties are not only important for product rating but also for daylighting and energy performance simulations. Contrary to planar fenestration, there is no standard procedure to measure the skylight optical properties under laboratory or real settings. For example, the ASTM Standard E972-96 (or E1084-86/96) to measure the transmittance of flat sheets of glazing under sunlight cannot be used for projecting skylights for a number of reasons. One main reason is that the use of one illuminance sensor underneath the glazing is not adequate to calculate the transmitted energy through the skylight, especially for large skylight apertures. Furthermore, due to the forming process of skylight glazing, the skylight surface may exhibit a variable thickness, and therefore variable local transmittance, for example, some surface points may exhibit lens effects. This effect may result in the misrepresentation of the overall performance. In addition, skylights transmit radiation not only by direct transmission but also by inter-reflection within the inside surfaces of the skylight. Capturing the inter-reflected energy needs some sensors placed close to the bottom edge surface of the skylight. Recognizing this gap in skylight performance measurements, we adopted an experimental procedure to measure the skylight visible transmittance and skylight daylight illuminance under real sky conditions.
Experimental Setup
A rectangular wooden box was used as a scale model of a simple commercial building, and was placed
on a building roof, located in Ottawa (latitude = 45.32o north, and longitude = 75.67o East), Ontario,
Canada. The box measured 2.32 m (91.5”) length x 1.73 m (68”) width x 1.22 m (48”) height, and its
length-axis was oriented southwest with an angle of 28o from the south cardinal direction. The inside
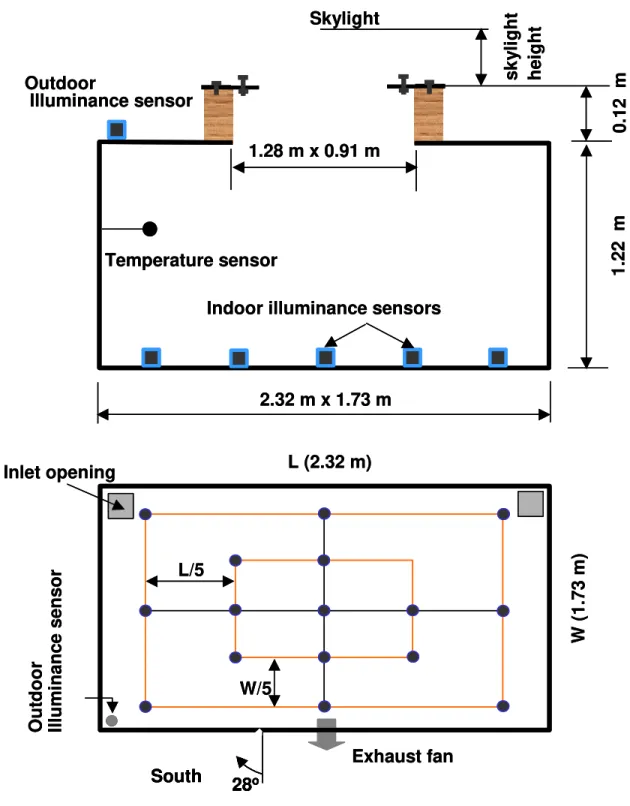
surfaces of the box were uniformly painted. The reflectance of the inside surface of a sample cut from box ceiling was measured and found to be 55%. The outside surface of the box was painted with a paint that looks like the surroundings (gravel) with an approximate reflectance of 25% (measured using a hand-held luminance meter). The top surface of the box was fitted with a curbed opening to accommodate the skylights to be tested. The opening measured 1.28 m (50.5”) length x 0.92 m (36”) width. The curb was made of wood and measured 0.12 m (4.75”) in height. The curb inside surface was painted with the same paint as the box interior surfaces. Two small openings (6” x 6”) were made in the floor surface near the north border, and one at the top of the south-facing wall to ventilate the inside space. The south-facing opening was equipped with an exhaust fan to evacuate any moisture and to avoid any possible space overheating that may affect the readings of illuminance sensors described in the next section. The outdoor and indoor space temperatures were monitored using thermocouple sensors whose locations are illustrated in Figure 1.
Skylight Daylight Illuminance Measurement Setup
To measure the average illuminance of the box floor surface, 16 illuminance sensors were used and uniformly spaced over the floor surface: one in the center, seven on an inner ring and eight on an outer ring near the walls. The illuminance sensors were spaced at intervals of one fifth (1/5) of the floor length or width distance. One additional illuminance sensor was placed on the southwest corner of the box roof to measure the outdoor global (sky-diffuse and sun-beam) horizontal illuminance. Figure 1 shows a schematic description of the measurement setup and illuminance sensor positions on the floor surface.
The average floor illuminance was calculated using the area-weighting method for each sensor as follows:
25
E
2
E
7
8
E
E
8 1 i outer i 7 1 i nner i i center floor∑
∑
= =⋅
+
⋅
+
=
/
, , (1) where:Efloor: average illuminance of the floor surface;
Ecenter: illuminance from the center sensor;
Ei, inner: illuminance from the ith sensor of the inner ring; and
Ei, outer : illuminance from the ith sensor of the outer ring.
Skylight Visible Transmittance Measurement Setup
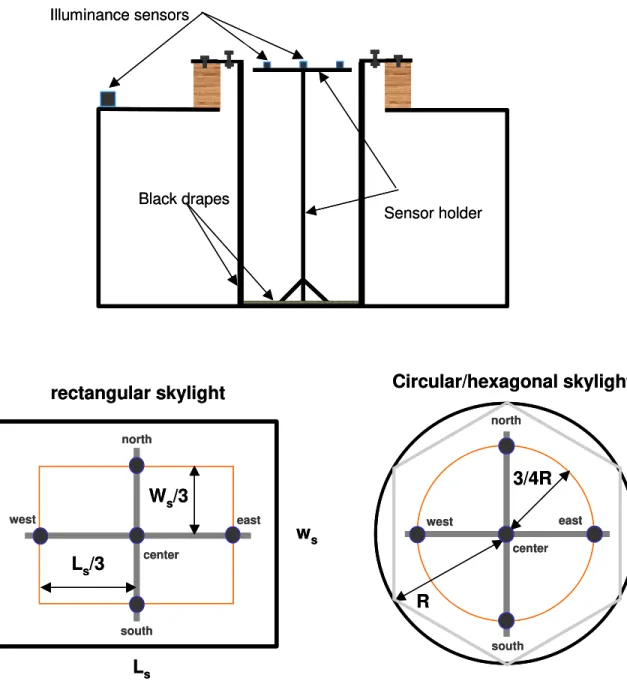
The skylight visible transmittance is defined as the ratio of the transmitted energy flux exiting from the skylight aperture opening to the flux incident on the horizontally projected skylight surface. In this regard, the effects of the curb or well spaces are not included in this definition. To measure the transmitted energy flux, five illuminance sensors (except for the tubular skylight that used one sensor) were placed at the top level of the curb, one in the center and one on each side between the center and the edge of the skylight. The sensor spacing was chosen so that each sensor represented the same surface area. To avoid any significant reflected light back to the skylight surface, black fabric was dropped from the edges of the skylight to the floor surface of the box. The five sensors were placed on a black wooden support. Figure 2 shows a schematic description of the measurement setup and sensor positions.
The skylight visible transmittance was calculated as follows:
glob 5 1 i i m E 5 E VT /
∑
= = (2) where:Ei : illuminance from the ith sensor;
Eglob : outdoor global horizontal illuminance from the sky diffuse and sun beam lights; and
VTm: measured skylight visible transmittance for the global light.
Weather Station
The outdoor solar radiation and illuminance were measured at the rooftop permanent weather station using a YANKEE SDR-1 radiometer. The YANKEE had two sensors for the solar irradiance and illuminance measurements. An automatic controlled shadow band periodically passed over the sensors in order to measure the diffuse horizontal irradiance and illuminance. When the band was removed from the sensor, global horizontal irradiance and illuminance measurements were taken. Direct normal irradiance and illuminance were automatically calculated from the diffuse and the global measurement results. The complete cycle took 15 seconds to switch from global to diffuse measurements.
Measurement Equipment Calibration
The illuminance sensors were of type LI-COR model LI-210SA. The illuminance sensors were cosine
corrected up to an incidence angle of 80o, and had a sensitivity response function within 5% of the CIE Vλ
photometric efficiency function. All the illuminance sensors were calibrated by the manufacturer against an Eppley Precision Spectral Pyranometer. However, as part of our quality assurance procedure, all illuminance sensors were checked at our laboratory by comparing their readings with a calibrated hand-held illuminance meter. Sensors whose readings deviated by more than their uncertainty limit from the hand-held illuminance meter were not used in the experiment. As stated by the manufacture, the maximum
calibration uncertainty was about 5% within the sensor sensitivity range (from an incidence angle of 0o to
80o; the error is very large beyond this angle). The YANKEE radiometer of the weather station was
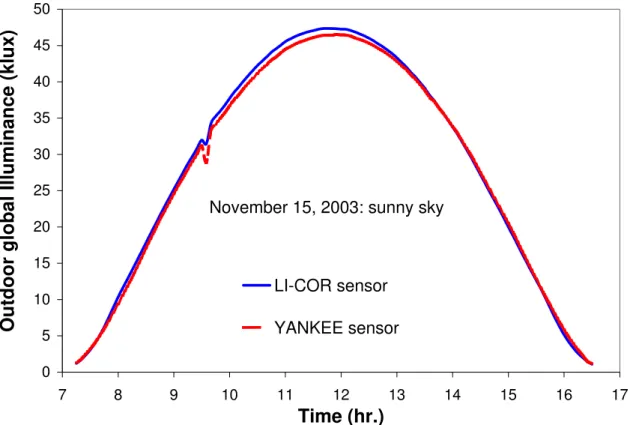
calibrated by the manufacturer, and checked on-site by comparing its readings with an outdoor illuminance sensor. This sensor comparison is presented in figure 3 under a clear and sunny sky.
2.32 m x 1.73 m
1.28 m x 0.91 m
Skylight
Indoor illuminance sensors
Outdoor
Illuminance sensor
Inlet opening
Temperature sensor
W (1
.7
3
m
)
L (2.32 m)
W/5
L/5
South
28
o1.22 m
sk
y
li
g
h
t
he
ight
0.
12 m
Exhaust fan
Out
door
Illum
inanc
e s
e
ns
or
2.32 m x 1.73 m
1.28 m x 0.91 m
Skylight
Indoor illuminance sensors
Outdoor
Illuminance sensor
Inlet opening
Temperature sensor
W (1
.7
3
m
)
L (2.32 m)
W/5
L/5
South
28
oSouth
28
28
oo1.22 m
sk
y
li
g
h
t
he
ight
0.
12 m
Exhaust fan
Out
door
Illum
inanc
e s
e
ns
or
Figure 1 Schematic description of the skylight illuminance measurement setup (section above and plan below)
Black drapes Sensor holder
L
sw
srectangular skylight
L
s/3
W
s/3
Circular/hexagonal skylight
3/4R
R
Illuminance sensors center north west east south center north west east south Black drapes Sensor holderL
sw
srectangular skylight
L
s/3
W
s/3
Circular/hexagonal skylight
3/4R
R
Illuminance sensors center north west east south center north west east southFigure 2 Schematic description of the skylight visible transmittance measurement setup (section above and plan below)
0 5 10 15 20 25 30 35 40 45 50 7 8 9 10 11 12 13 14 15 16 17
Time (hr.)
Outdoor global Illuminance (klux)
LI-COR sensor
YANKEE sensor
November 15, 2003: sunny sky
Figure 3 Comparison of the LI-COR and YANKEE illuminance sensor readings
Test Specimen
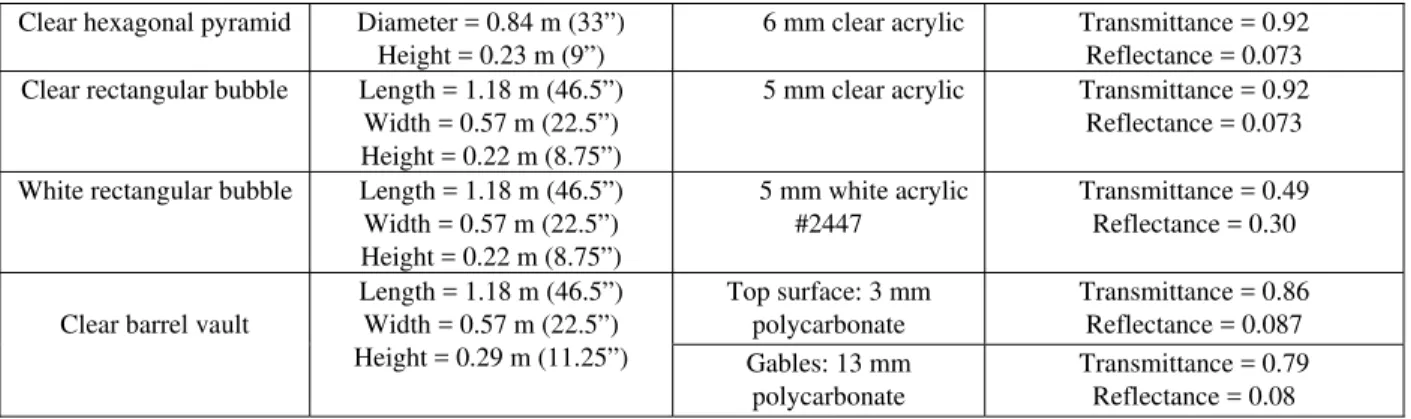
Seven skylight of different shapes were tested: (1) circular dome with single clear acrylic glazing, (2) circular dome with single white acrylic glazing, (3) hexagonal pyramid with single clear acrylic glazing, (4) rectangular bubble with single clear acrylic glazing, (5) rectangular bubble with single white acrylic glazing, (6) barrel vault with single clear polycarbonate glazing, and (7) tubular skylight. Table 1 summarizes the physical properties of the tested shapes (except the tubular skylight whose results were not considered in paper). All skylights were supplied by the manufacturers, except the barrel vault, which was made in our laboratory.
Data Acquisition
The illuminance sensors and the exhaust fan were connected to a data acquisition system. The solar radiation radiometers were connected to a separate data acquisition system of the permanent weather station. Each data acquisition system was connected to a personal computer, which ran the data acquisition program. The sensor signals were collected and sent to the personal computer in voltage unit, which were then transformed to the desired units using the sensor calibration curves supplied by the sensor manufacturers. The sampling rate of the data acquisition systems was fixed at one minute, and sensor readings were averaged over a five-minute interval. The measurements were conducted over a whole day period, thereby covering different sky conditions: overcast, partly cloudy and clear sunny skies. Measurements under rainy or foggy days were discarded. The measurement results were presented for each sensor averaged-reading on a five-minute time step.
Measurement Uncertainty Analysis
Calculation of the measurement uncertainty was performed on the data-reduction equations (1) and (2). The measurement errors were due only to the uncertainties of the illuminance sensors. For single-sample measurements, the relative errors in the measurements of the Visible Transmittance and indoor average illuminance are expressed as follows (Kline and McClintock, 1953):
(
)
( )
[
21/2 g 2 a RE RE RVT= +]
(3) a RE RE= (4) where:RVT: relative error in the measurement of the Visible Transmittance.
RE : relative error in the measurement of the indoor floor average illuminance.
REa : relative error in the measurement of the average illuminance over a given surface.
REg : relative error in the measurement of the outdoor global illuminance.
By straightforward mathematical manipulation, the relative error in the measurement of the average
illuminance over a given surface (REa) is equal to the relative error of the illuminance sensor. Given the
uncertainty of the illuminance sensors of 5%, equations (3) and (4) thus yield RVT = 7% and RE = 5%.
SIMULATION METHODOLOGY
The following inputs were used in simulation:
1. Location of the building: the site latitude and longitude as well as the ground reflectance value (0.25).
2. Geometry of the measurement box: dimensions and indoor surface reflectances.
3. Geometry of the skylight and its dimensions: the width and length of the skylight aperture, and skylight height/raise from its base plane.
4. Optical properties (transmittance and reflectance) of the glazing sheet the skylight is made of at normal incidence angle. These inputs are used to calculate the optical properties at oblique incidence angles.
5. Measurement day, and the outdoor diffuse and global horizontal illuminances and irradiances at each time step (five minutes).
Based on these inputs, SkyVision calculates at each time step the floor average illuminance, and the overall skylight optical properties for the sun’s beam and diffuse lights. The skylight transmittance for the global light incident on the skylight surface (sun beam, and sky and ground-reflected diffuse lights) is calculated as follows:
(
)
glob dif dif dif glob beam sE
E
VT
E
E
VT
VT
=
⋅
−
+
⋅
(5) where:Edif : outdoor horizontal diffuse illuminance (measured).
Eglob : outdoor horizontal global illuminance (measured).
VTbeam: skylight visible transmittance for the sun beam light for the given sun’s altitude angle
(simulated).
VTdif: skylight visible transmittance for the sky and ground-reflected diffuse light (simulated).
VTs : skylight visible transmittance for the global light (simulated).
Table 1 Physical characteristics of the tested skylights. The optical characteristics of the glazing sheets the skylights are made of at a normal incidence angle were taken from the
glazing database of the Optics program, version 5.1 (LBL, 2004c).
Skylight Shape Interior Dimensions Material Sheet optical properties
(visible spectrum)
Clear circular dome Diameter = 0.84 m (33”) Height = 0.2 m (8”)
6 mm clear acrylic Transmittance = 0.92 Reflectance = 0.073 White circular dome Diameter = 0.84 m (33”)
Height = 0.2 m (8”)
6 mm white acrylic (#2447)
Transmittance = 0.49 Reflectance = 0.30
Clear hexagonal pyramid Diameter = 0.84 m (33”) Height = 0.23 m (9”)
6 mm clear acrylic Transmittance = 0.92 Reflectance = 0.073 Clear rectangular bubble Length = 1.18 m (46.5”)
Width = 0.57 m (22.5”) Height = 0.22 m (8.75”)
5 mm clear acrylic Transmittance = 0.92 Reflectance = 0.073 White rectangular bubble Length = 1.18 m (46.5”)
Width = 0.57 m (22.5”) Height = 0.22 m (8.75”) 5 mm white acrylic #2447 Transmittance = 0.49 Reflectance = 0.30 Top surface: 3 mm polycarbonate Transmittance = 0.86 Reflectance = 0.087 Clear barrel vault
Length = 1.18 m (46.5”) Width = 0.57 m (22.5”) Height = 0.29 m (11.25”) Gables: 13 mm polycarbonate Transmittance = 0.79 Reflectance = 0.08
RESULTS COMPARISON AND DISCUSSION
In the following, the results and comparison between the measurements and the SkyVision’s simulations are presented for each skylight for both the skylight transmittance and indoor daylight illuminance. For some shapes, the indoor illuminance measurements for skylights were not carried out due to the restrictions in time and funding. The measurement results for the tubular skylight are not presented in this paper due the use of one illuminance sensor to measure the visible transmittance, which turned out not accurate for tubular skylights with not a perfect diffuser. In addition, the simulations results presented in this paper are slightly different from the ones presented in the validation report (Laouadi and Arsenault, 2004). This paper used the inputs of the optical properties of the skylight glazing taken from the International Glazing Database (see Table 1), which are quite different from the supplied manufacture data used in the validation report.
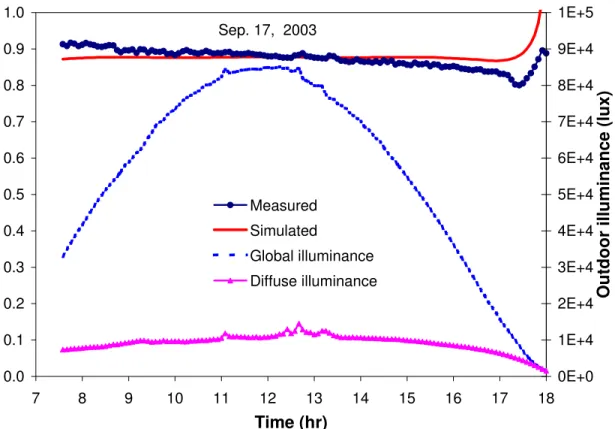
Clear Dome
Figure 4 shows a comparison between the measured and simulated skylight visible transmittance for the clear circular dome skylight on September 17, 2003. Sky conditions were clear and sunny with a few scattered clouds in the early afternoon. Given the measurement uncertainty of 7%, the simulations compared reasonably well with the measurements with a maximum difference less than 10%, except at the sunset hours where the simulations were about 16% higher than the measurements. This difference at low sun altitude angles may be due to a number of factors: (1) the theoretical optical properties of the glazing, especially the reflectance, used in the simulation are different from the actual ones. The glazing surface conditions (such as dust accumulation, scratches, etc.) can significantly affect the surface transmittance and reflectance and consequently the measurement results (e.g., changing the reflectance from 7% to 5% produced better simulation results). (2) The measurements had a higher uncertainty at very low sun altitude
angles (sensor cosine uncertainty is very large at sun altitude angles lower than 10o). And (3) the five
sensors were not probably sufficient to accurately measure the inter-reflected light. Light transmission by inter-reflection occurs at the lower part of the skylight surface and is more significant at low sun altitude angles. Sensors placed close to the skylight surface would capture the inter-reflected light.
Figure 5 shows a comparison between the measured and simulated floor average illuminance for the clear circular dome skylight under a partly cloudy sky condition. Overall, the simulations compared reasonably well with the measurements, with a daily-average difference of 13% (the maximum difference was about 45% at the illuminance peaks). The difference between the simulated and measured values was due in fact to two main error sources. First, the outdoor diffuse and global illuminance measurements, which were measured by the weather station system and used in the simulation, were not completely synchronized with the measurements of the indoor illuminances (time delay or advance was in the order of 1 to 3 minutes). This time delay/advance had a significant impact in the simulation, especially for highly changing sky conditions such as the partly cloudy conditions. Second, the use of 16 illuminance sensors was perhaps not enough to fully represent the average illuminance.
0.0 0.1 0.2 0.3 0.4 0.5 0.6 0.7 0.8 0.9 1.0 7 8 9 10 11 12 13 14 15 16 17 18
Time (hr)
Visible Transmittance
0E+0 1E+4 2E+4 3E+4 4E+4 5E+4 6E+4 7E+4 8E+4 9E+4 1E+5Outdoor illuminance (lux)
Measured Simulated
Global illuminance Diffuse illuminance Sep. 17, 2003
Figure 4 Profiles of the measured and simulated skylight visible transmittance as a function of daytime - clear circular dome.
0 500 1000 1500 2000 2500 3000 7 8 9 10 11 12 13 14 15 16 17 Time (hr)
Floor average illuminance (lux)
0E+0 2E+4 4E+4 6E+4 8E+4 1E+5 1E+5 1E+5
Outdoor illuminance (lux)
Measured Simulated
Global illuminance Diffuse illuminance
Nov. 1, 2003
Figure 5 Profile of the floor average illuminance as a function of daytime under a partly cloudy sky - clear circular dome.
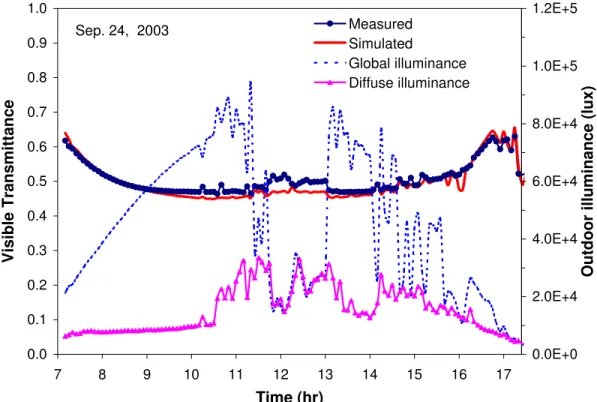
Diffuse Dome
Figure 6 shows a comparison between the measured and simulated skylight transmittance for the diffuse (white) circular dome skylight on September 24, 2003. Sky conditions were clear in the morning, overcast around noontime, and partly cloudy in the afternoon. Given the measurement uncertainty of 7%, the simulations compared very well with the measurements with a maximum difference less than 10%. This relatively small difference was mainly due to the fact that the theoretical optical properties of the glazing may be different from the actual ones (skylight surface is subject to dust accumulation and scratches), and the five sensors were not probably sufficient to accurately measure the transmitted light flux. Indeed, the measurements showed that sensor readings were significantly different from each other, particularly during sunny or partly-cloudy hours.
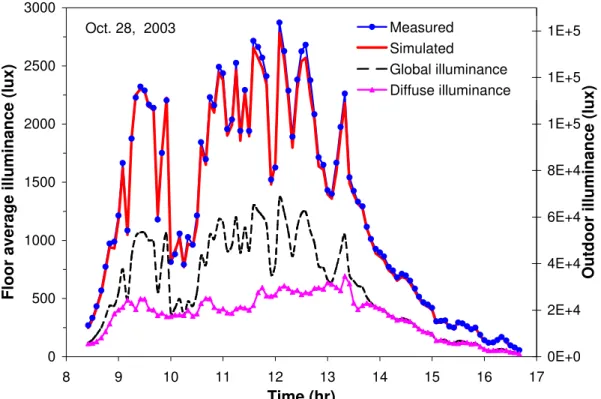
Figure 7 shows a comparison between the measured and simulated floor average illuminance for the white circular dome skylight. The sky conditions were partly cloudy all day. Given the measurement uncertainty of 5%, the simulations were in excellent agreement with the measurements, with a maximum difference of 8%. 0.0 0.1 0.2 0.3 0.4 0.5 0.6 0.7 0.8 0.9 1.0 7 8 9 10 11 12 13 14 15 16 17 Time (hr) Visible Transmittance 0.0E+0 2.0E+4 4.0E+4 6.0E+4 8.0E+4 1.0E+5 1.2E+5
Outdoor illuminance (lux)
Measured Simulated
Global illuminance Diffuse illuminance Sep. 24, 2003
Figure 6 Profile of the skylight visible transmittance as a function of daytime - diffuse circular dome.
0 500 1000 1500 2000 2500 3000 8 9 10 11 12 13 14 15 16 17 Time (hr)
Floor average illuminance (lux)
0E+0 2E+4 4E+4 6E+4 8E+4 1E+5 1E+5 1E+5
Outdoor illuminance (lux)
Measured Simulated
Global illuminance Diffuse illuminance Oct. 28, 2003
Figure 7 Profile of the floor average illuminance as a function of daytime under a partly cloudy sky - diffuse circular dome.
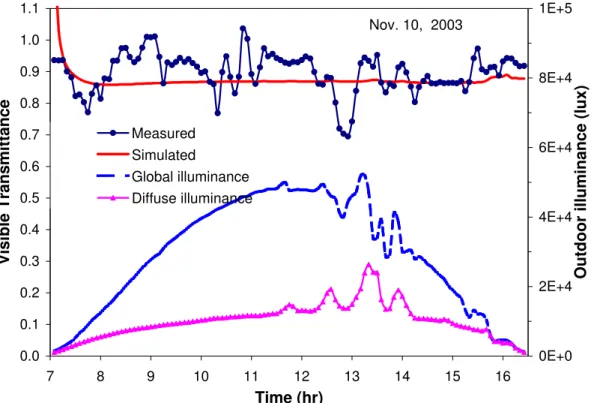
Clear Hexagonal Pyramid
Figures 8 and 9 show a comparison between the measured and simulated skylight transmittance for the clear hexagonal pyramid under clear and overcast sky conditions, respectively. Contrary to the previous results for the clear dome skylight, the measured transmittance of the clear hexagonal pyramid exhibited an unusual behavior under clear sky conditions (Figure 8). The measured transmittance oscillated between low and high values within a period of about 20 to 40 min, depending on the sun position in the sky. When the sensor readings were closely examined, it was found that some of the sensors measured much higher or lower illuminances than the others, sometimes higher than the outdoor illuminance. When the sun’s rays hit the surface vertices of the pyramid, alternating darker and brighter segments of about ½” wide, were cast on some of the sensors. The darker segments corresponded to the thickest portion of the surface vertex, and brighter segments corresponded to the thinnest portion. This observation suggests a lens effect along the vertices of the pyramid surfaces. Consequently, the software’s simulations deviated from the measurements by a maximum difference of about ±25% (6% on average). This lens effect is not desirable in real applications since it may cause an excessive glare problem, and affect the correct operation of a daylight-linked lighting control system. To overcome this localized lens effect (which is due to the curvature and non-uniform thickness of the skylight glazing panes), skylights should be multi-pane with at least one diffusing glazing, or they should be employed with a well diffuser. Under overcast skies (Figure 9), where the lens effects were not significant, the simulation results compared reasonably well with the measurements with a daily averaged error of about 4%.
0.0 0.1 0.2 0.3 0.4 0.5 0.6 0.7 0.8 0.9 1.0 1.1 7 8 9 10 11 12 13 14 15 16 Time (hr) Visible Transmittance 0E+0 2E+4 4E+4 6E+4 8E+4 1E+5
Outdoor illuminance (lux)
Measured Simulated
Global illuminance Diffuse illuminance
Nov. 10, 2003
Figure 8 Profile of the skyight visible transmittance as a function of daytime under a sunny sky - clear hexagonal pyramid.
0.0 0.1 0.2 0.3 0.4 0.5 0.6 0.7 0.8 0.9 1.0 1.1 7 8 9 10 11 12 13 14 15 16 Time (hr) Visible Transmittance 0E+0 2E+4 4E+4 6E+4 8E+4 1E+5
Outdoor illuminance (lux)
Measured Simulated
Global illuminance Diffuse illuminance
Nov. 9, 2003
Figure 9 Profile of the skylight visible transmittance as a function of daytime under an overcast sky - clear hexagonal pyramid.
Clear Bubble Dome
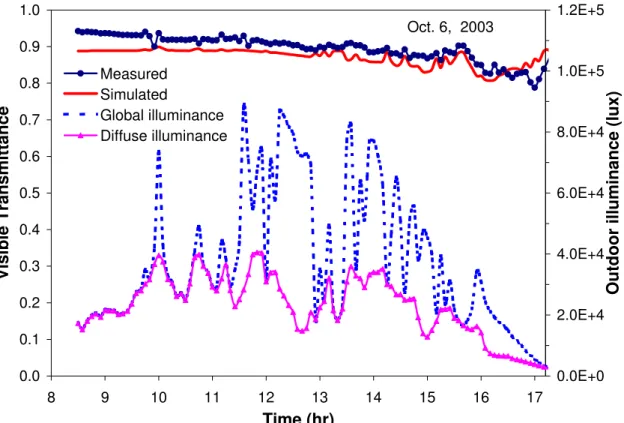
Figure 10 shows a comparison between the measured and simulated skylight transmittance for the clear rectangular bubble skylight on October 6, 2003. The sky conditions were mostly overcast in the morning, partly cloudy in the afternoon (about 60% cloud cover), and sunny at sunset. Given the measurement uncertainty of 7%, the simulations compared very well with the measurements, with a maximum difference less than 10%. This difference was attributed primarily to the use of five sensors, which were not probably sufficient to cover the large skylight opening and, therefore, accurately measure the transmitted light flux, especially the inter-reflected component. Transmission by inter-reflection occurs at the lower part of the skylight surface and is more significant at low sun’s altitude angles. Sensors placed close to skylight surface would capture the inter-reflected light.
0.0 0.1 0.2 0.3 0.4 0.5 0.6 0.7 0.8 0.9 1.0 8 9 10 11 12 13 14 15 16 17 Time (hr) Visible Transmittance 0.0E+0 2.0E+4 4.0E+4 6.0E+4 8.0E+4 1.0E+5 1.2E+5
Outdoor illuminance (lux)
Measured Simulated
Global illuminance Diffuse illuminance
Oct. 6, 2003
Figure 10 Profile of the skylight visible transmittance as a function of daytime under a partly cloudy sky - clear rectangular bubble.
Diffuse Bubble Dome
Figure 11 shows a comparison between the measured and simulated skylight transmittance for the diffuse (white) rectangular bubble skylight on October 9, 2003. Sky conditions were hazy in the morning, overcast around noontime (sun not visible), and sunny with a little haze in the late afternoon. Given the measurement uncertainty of 7%, the simulations compared quite well with the measurements, particularly on clear sky conditions (e.g., at late afternoon). The maximum difference between the measurements and simulations was less than 18%. This difference was perhaps due to the number of sensors not being adequate to cover the large skylight opening, and to accurately measure the transmitted energy. Indeed, the measurements showed that sensor readings were significantly different from each other, particularly during sunny or partly cloudy hours.
Figure 12 shows a comparison between the measured and simulated floor average illuminance for the white rectangular bubble skylight under partly cloudy conditions. Given the 5% uncertainty in the measurements, the simulations compared reasonably well with the measurements, with a maximum difference less than 12%. This difference was likely due to the use of only 16 illuminance sensors to represent the average illuminance.
0.0 0.1 0.2 0.3 0.4 0.5 0.6 0.7 0.8 0.9 1.0 7 8 9 10 11 12 13 14 15 16 17 Time (hr) Visible Transmittance 0E+0 2E+4 4E+4 6E+4 8E+4 1E+5
Outdoor illuminance (lux)
Measured Simulated
Global illuminance Diffuse illuminance
Oct. 9, 2003
Figure 11 Profile of the skylight visible transmittance as a function of daytime – diffuse rectangular bubble. 0 500 1000 1500 2000 2500 3000 7 8 9 10 11 12 13 14 15 16
Time (hr)
Floor average illuminance (lux)
0E+0 2E+4 4E+4 6E+4 8E+4 1E+5 1E+5 1E+5
Outdoor illuminance (lux)
Measured Simulated
Global illuminance Diffuse illuminance
Figure 12 Profile of the floor average illuminance as a function of daytime under an overcast sky - diffuse rectangular bubble.
Clear Barrel Vault Skylight
Figure 13 shows a comparison between the measured and simulated skylight transmittance for the clear barrel vault skylight on October 24, 2003. Sky conditions were partly cloudy in the morning and mostly sunny in the afternoon. Given the measurement uncertainty of 7%, the simulation results were in good agreement with the measurements, with a maximum difference of about 11%. This difference may be attributed to the five sensors of not being adequate to cover the large skylight opening and to accurately measure the transmitted energy.
Figure 14 shows a comparison between the measured and simulated floor average illuminance for the clear barrel vault skylight under partly cloudy sky conditions. Given the measurement uncertainty of 5%, the simulations compared very well with the measurements, with a maximum uncertainty less than 11%. This difference was mainly due to: (1) the 16 sensors were not probably enough to represent the average illuminance; and (2) the outdoor illuminance measurements, which were measured by the weather station system and used in the simulation, were not completely synchronized with the measurements of the indoor illuminances. The time difference between both measurements had a significant impact in the simulation, especially for highly changing sky conditions such as the partly cloudy conditions.
0.0 0.1 0.2 0.3 0.4 0.5 0.6 0.7 0.8 0.9 1.0 8 9 10 11 12 13 14 15 16 Time (hr) Visible Transmittance 0.0E+0 2.0E+4 4.0E+4 6.0E+4 8.0E+4 1.0E+5 1.2E+5
Outdoor illuminance (lux)
Measured Simulated
Global illuminance Diffuse illuminance
Oct. 24, 2003
Figure 13 Profile of the skylight visible transmittance as a function of daytime – clear barrel vault.
0 1000 2000 3000 4000 6 7 8 9 10 11 12 13 14 15 16 17 Time (hr)
Floor average illuminance (lux)
0E+0 2E+4 4E+4 6E+4 8E+4 1E+5 1E+5 1E+5
Outdoor illuminance (lux)
Measured Simulated
Global illuminance Diffuse illuminance
Oct. 19, 2003
Figure 14 Profile of the floor average illuminance as a function of daytime under a partly cloudy sky - clear barrel vault.
CONCLUSIONS
A series of measurements were conducted under real sky conditions to validate the simulations of the SkyVision software. The measurements included the visible transmittance and indoor daylight illuminance of seven skylight types: two circular dome models, one with clear and one with white acrylic glazing; two rectangular bubble dome models, one with clear and one with white acrylic glazing; a clear acrylic hexagonal pyramid model; a clear polycarbonate barrel vault model; and a tubular skylight model. When the software’s simulations for the skylight transmittance were compared with the actual measurements, they presented reasonable agreement with each other, except for the hexagonal pyramidal skylight. The simulations for the hexagonal pyramid deviated from the measurements by a maximum error of about 25% (daily average error of 6%), particularly under clear sky conditions. This was due to the fact that the hexagonal pyramid surface exhibited some lens effects around the surface vertices. This effect caused the sensors to measure very low or very high illuminances (under some conditions the indoor illuminance sensor readings were about 50% more than the outside illuminance!). The surface lens effect was not possible to model in SkyVision. As for the skylight indoor illuminance comparison, the software’s simulations compared reasonably well with the actual measurements for all occurrences of sky conditions.
RECOMMENDATIONS
The lessons learned from this work suggest the following recommendations:
1. Should a similar methodology be adopted to measure the skylight transmittance, an adequate number of illuminance sensors should be used, particularly for skylights with diffuse glazing, or skylights with surface lens effects. The adequate number of sensors depends on the size of skylight. Sensors should also be adequately placed under the lower part of the skylight surface to capture the transmitted energy by inter-reflection.
2. A similar standard to the ASTM Standard E972-96 (or E1084-86/96) should be developed to measure the skylight transmittance under sunlight. Such a standard should be flexible to accommodate different shapes of skylights.
3. In practical applications, skylights with lens effects could be used with an additional diffusing glazing pane or with a well diffuser to eliminate/reduce any potential risk of excessive glare and lighting control difficulties.
ACKNOWLDGEMENTS
This work was funded by the Institute for Research in Construction (IRC) of the National Research Council Canada; the CETC Buildings Group and Panel on Energy Research and Development (PERD) of Natural Resources Canada; and Public Works and Government Services Canada (PWGSC). In addition, a number of companies donated skylight products for testing, including: Artistic Skylight Domes Ltd. in Etobicoke, Ontario; Mac Plastics Ltd. in Edmonton, Alberta; and Energy Harmony in St. Catharines, Ontario. The authors were very thankful for their contribution. The authors would also like to extend their gratitude to Dr. Guy Newsham (Group leader at IRC/IE), Dr. Christoph Reinhart (IRC/IE), Roger Marchand (IRC/IE), Ivan Pasini and Karen Pero (PWGSC), and Francois Dubrous (NRCan) for their continuous technical support and advice throughout the project.
REFERENCES
1. ASTM Standard E972-96, Standard test method for solar photometric transmittance of sheet materials using sunlight. American Society for Testing and Materials.
2. ASTM Standard E1084-86/96, Standard test method for solar transmittance (terrestrial) of sheet materials using sunlight. American Society for Testing and Materials.
3. CANMET, FRAMEplus 5.1: web site: www.frameplus.net, 2003.
4. HMG (Heschong Mahone Group), SkyCalc: Skylighting Tool for California and the Pacific: www.h-m-g.com, 2003.
5. HMG (Heschong Mahone Group). Daylight and retail sales. California Energy Commission, 2003. 6. HMG (Heschong Mahone Group). Skylighting and retail sales. Pacific Gas and Electric, 1999. 7. IEA SHC Task 21, ADELINE 3.0, RADIANCE and SUPERLITE User’s Manual, 2000.
8. Klems J.K., Solar heat gain through a skylight in a light well. ASHRAE Transactions, 2003; 109(1). 9. Kline S.J., and McClintock F.A., Describing Uncertainties in Single Sample Experiments. Mechanical
Engineering 1953; 75: 3-8.
10. Laouadi A. and Arsenault C. Validation of SkyVision. Report No. IRC-RR-167, http://irc.nrc-cnrc.gc.ca/ie/light/skyvision/publications.html. National Research Council of Canada: Ottawa, 2004. 11. Laouadi, A. Design with SkyVision: a computer tool to predict daylighting performance of skylights.
Proceedings of the CIB World Building Conference, Toronto. Ontario: National Research Council of Canada, May 2004.
12. Laouadi A., and Atif M.R. Simulation model of optical characteristics for barrel vault skylights. Journal of Illuminating Engineering Society of North America, 2002; 31(2): 52-65.
13. Laouadi, A.; Galasiu, A.D.; Atif, M.R.; Haqqani, A. "SkyVision: a software tool to calculate the optical characteristics and daylighting performance of skylights," Building Simulation, 8th IBPSA Conference (Eindhoven, Netherlands, 2003-08-11), pp. 705-712, Aug, 2003a.
14. Laouadi, A.; Galasiu, A.; Atif, M.R. "A New software tool for predicting skylight performance," International Daylighting, (5), March, pp. 15-18, Mar, 2003b.
15. Laouadi A., and M.R. Atif, Simulation model of optical characteristics for barrel vault skylights. Journal of the Illuminating Engineering Society of North America, 2002.
16. Laouadi, A., Atif, M.R. and Galasiu, A.D. Towards developing skylight design tools for thermal and energy performance of atriums in cold climates. Building and Environment, 37(12), pp. 1289-1316, 2002.
17. Laouadi A., and M.R. Atif, Transparent Domed Skylights: Optical Model For Predicting Transmittance, Absorptance And Reflectance, International Journal of Lighting Research and Technology 30(3), pp. 111-118,1998.
18. LBL, WINDOWS 5.1, Lawrence Berkeley Laboratory: http://windows.lbl.gov/, 2004a. 19. LBL, RADIANCE 3.5, Lawrence Berkeley Laboratory: http://radsite.lbl.gov/radiance/, 2004b. 20. LBL, Optics 5.1, Lawrence Berkeley Laboratory: http://windows.lbl.gov/, 2004c.
21. LT (Lighting Technologies, Inc.), LUMEN MICRO 2000: www.lighting-technologies.com, 2003. 22. McHugh J. Dee R. and Saxena M., Visible Light Transmittance of Skylights, PIER report, California
Energy Commission, 2004.