Assembly Lead Time Reduction in a Semiconductor Capital Equipment Plant
through Constraint Based Scheduling
by
Blake William Clark Sedore MASSACUSETTS INBTTUTE OF TECHNOLOGY BScEng, Mechanical Engineering
Queen's University, 2007
MASc, Mechanical Engineering
LIBRARIES
Queen's University, 2013
Submitted to the Department of Mechanical Engineering in Partial Fulfillment of the Requirements for the Degree of
MASTER OF ENGINEERING IN MANUFACTURING at the
MASSACHUSETTS INSTITUTE OF TECHNOLOGY
September 2014
2014 Blake William Clark Sedore. All rights reserved. The author hereby grants to MIT permission to reproduce and to
distribute publicly paper and electronic copies of this thesis document in whole or in part in any medium now known or hereafter created.
Signature redacted
Signature of Author...Blake William Clark Sedore Department of Mechanical Engineering August 15, 2014
Certified by...Signature
redacted
Stephen C. Graves Abraham Siegel Professor of Management Sciences Thesis SupervisorSignature redacted"
A cce pted by... ... David E. Hardt Ralph E. and Eloise F. Cross Professor of Mechanical Engineering Chairman, Committee for Graduate Student
Assembly Lead Time Reduction in a Semiconductor Capital Equipment Plant
through Constraint Based Scheduling
by
Blake William Clark Sedore
Submitted to the Department of Mechanical Engineering on August 15, 2014 in Partial Fulfillment of the
Requirements for the Degree of Master of Engineering in Manufacturing
Abstract
The assembly protocols for a semiconductor capital equipment machine were analyzed for potential lead time reduction. The objective of this study was to determine the minimum assembly lead time for the machine based on the constraints of design, space, and labor availability.
An assembly requires the completion of a set of procedures that each contains assembly tasks. Precedence relationships between tasks indicate for each procedure what other tasks must be completed before it can start. Each procedure was assumed to have constant resource requirements throughout its duration. The Critical Path Method (CPM) was used to identify 13 procedures on the critical path, based on design and space constraints. A preliminary build schedule was developed that prioritized critical path procedures. A trial of this build schedule achieved an assembly lead time of 39 hours, resulting in a 70% reduction from the current average of 5.5 days. This trial was also
accomplished with 76% of the average labor hours for assembly.
A production build schedule with a lead time of 43 hours was developed based on the trial results. This schedule allows for production rates of up to 5 machines per week to be achieved with the current shift structure of the company, without the incurrence of overtime.
A critical path drag analysis identified critical procedures with the highest potential for lead time
reduction. The highest drag of a critical path item was 260 minutes, accounting for 10% of the assembly lead time.
Thesis Supervisor: Stephen C. Graves
Acknowledgements
I would like to express my sincere gratitude to my faculty advisor, Professor Stephen Graves, who provided valuable guidance throughout this project and the writing of this thesis, and to my supervisor at Varian, Dan Martin, whose advice and continual support helped propel this project to successful completion.
I would also like to thank Tom Faulkner and Dan Martin for Varian's continual support of the MEngM program at MIT. The projects and experience that Varian provides to students is invaluable, and I hope the relationship between Varian and the MEngM program continues for many years.
This thesis would not have been possible without the managers, shift leads, and assemblers of the UES line, in particular Brian McLaughlin, Dave Adkins, Rusty Lake, Brian Hines, and Jon Lane. I truly admire their patience and their willingness to help me understand the complexities of the UES assembly, and I greatly appreciate their support throughout the time studies and trial implementation.
I would also like to thank my team members, Sonam Jain and Anubha Bhadauria, for always wanting to engage in discussion and for always being willing to provide support and lend a hand when needed. This project has created many lasting memories that will always stay with me, specifically time studies that lasted many days and nights. I would also like to thank Sonam for being such a dedicated team member on so many projects that we have been a part of over this year. I have found your work ethic and determination to be both motivating and contagious, and I hope we can find an opportunity to team up again at some point in our careers.
And thank you to Jose Pacheco, David Hardt, and Brian Anthony, for providing such a valuable educational program, and to Jennifer Craig for her continued support to the students. The MEngM degree is unique, and needed, and it has been a privilege to be a part of it.
And finally, I wish to thank my parents, Leslie and Bob, and my brother and sister, Rob and Kim, for providing relentless support, encouragement, and enthusiasm throughout this year. I couldn't have done it without you.
Table of Contents
1. Introduction ...----.-. 12
1.1. Sem iconductor Industry Overview ... 12
1.2. Sem iconductor M anufacturing ... 12
1.3. VSEA Background ... .-...--- 13
1.3.1. VSEA Product Line...14
1.3.2. M achine Architecture ... 15
1.3.3. Universal End Station Architecture ... 17
1.4. Current Operations of the UES Line ... 18
1.4.1. Process Flow ... 18
1.4.2. Inventory ...--... 20
1.4.3. Schedulning ... 21
1.5. Problem Statem ent...23
1.5.1. M otivation...23
1.5.2. Problem Identification ... 23
1.5.3. Approach... ... 25
1.6. Thesis Organization...26
2. Assem bly and Testing Tim e Studies of the UES ... 27
2.1. Objectives...---.27
2.2. M ethodology...27
2.3. Assem bly Tim e Study Results... 30
2.4. Testing Tim e Study Results ... 36
2.5. Discussion...38
2.6. Sum m ary ... 40
3. Constrained Critical Path Analysis... 41
3.1. Literature Review ... 41
3.2. Objectives...42
3.3. M ethodology...42
3.4. Task Reorganization into Blocks ... 43
3.5. Constrained Critical Path by Block Durations and Dependencies... 45
3.6. Constrained Critical Path by Block Durations and Dependencies, and Space Availability...46
3.7. Constrained Critical Path by Block Durations and Dependencies, Space, and Labor Availability 49 3.8. Discussion...52
3.9. Sum m a ry ... 53
4. Trial of a Preliminary Build Schedule ... 55
4.1. Objectives...55
4.2. M ethodology...55
4.3. Prelim inary Build Schedule Developm ent ... 55
4.4. Prelim inary Build Schedule Trial ... 58
4.5. Discussion...60 4.6. Sum m ary ... 61 5. Production Scheduling ... 62 5.1. Literature Review ... 62 5.2. Objectives...63 5.3. M ethodology...63
5.4. Production Build Schedule Development ... 64
5.5. Build Schedule Robustness Analysis ... 67
5.6. Critical Path Drag Analysis...68
5.7. Production Scheduling ... 70
5.7.1. One M achine per W eek ... 70
5.7.2. Three M achines per W eek ... 73
5.7.3. Five M achines per W eek... 74
5.8. Discussion...75
5.9. Sum m ary ... 76
6. Conclusions, Recom m endations, and Future W ork... 77
6.1. Conclusions ... 77
6.2. Recom m endations...77
6.3. Future W ork...79
7. Endnotes ... 80
8. Appendix ... 81
8.1. Critical Path Drag Calculations... 81
List of Figures
Figure 1: V IlSta product line...15
Figure 2: Schem atic of ion im planter ... 15
Figure 3: Universal End Station schematic... 16
Figure 4: Process flow for UES production with labor requirements indicated for Build, Integration, and T e st [8 ]...19
Figure 5: UES Flow Line schem atic [7] ... 20
Figure 6: Average lead times compared to lead times predicted by Little's Law ... 22
Figure 7: Cause and Effect diagram for UES lead time ... 24
Figure 8: Project process flow ... 26
Figure 9: Logbook structure with Lotus Notes database. Each task requires a sign-off by the assembler upo n co m pletio n ... 29
Figure 10: Activity of assembly sub-mod procedures... 30
Figure 11: Overall of activity level of sub-mods (a), breakdown of the total Active period (b), breakdown of the Inactive period (c) ... 31
Figure 12: Grand state of machine during Assembly time study... 32
Figure 13: Overall grand state of machine during assembly (a), with unavailable production time omitted (b ) ... 3 2 Figure 14: Activity-on-Node diagram showing the sub-mod dependency network... 33
Figure 15: Location zones on the UES... 34
Figure 16: Test activity levels for Testing time study... 36
Figure 17: Overall activity level of tests with delay from ECO omitted (a), breakdown of Active period (b), breakdow n of Inactive period (c) ... 37
Figure 18: Grand State of the machine during testing time study ... 38
Figure 19: Overall activity level of the machine (a), with delay from ECO and unavailable production time o m itte d (b )...3 8 Figure 20: Activity-on-Node diagram showing the Block dependency network with builds (blue), installations (yellow), and integrations (green). Block IDs and durations (in minutes) are shown, and the critical path is indicated with red arrows...45 Figure 21: Gantt chart showing the critical path for assembly, based off of block durations and
Figure 22: Gantt chart showing the critical path for assembly, based on block durations and
dependencies, and space constraints ... 48
Figure 23: Activity on Node diagram showing design and location-based dependencies between Blocks. Red arrow s indicate the critical path ... 49
Figure 24: Typical labor availability during weekdays. Vertical columns indicate scheduled break times. The increase in available labor between 9 PM and 11 PM is due to the overlap between 2nd and 3rd sh ifts...5 0 Figure 25: Gantt chart showing a build schedule that satisfies location and labor constraints...52
Figure 26: Preliminary build schedule with balanced labor requirements...57
Figure 27: Gantt chart showing actual Block durations during trial of preliminary build schedule...59
Figure 28: Production build schedule ... 65
Figure 29: Activity on Node diagram showing the Block dependency network for the Production Build Schedule, showing design, location, and labor dependencies. Build Blocks are shown in blue, installation Blocks in yellow, and integration Blocks in green. ... 66
Figure 30: Gantt chart showing measured Block durations that are scheduled for JIT completion with the sequence of the Production Build Schedule ... 68
Figure 31: Labor requirements for one machine per week with assembly starting on Wednesday...71
Figure 32: Labor requirements for one machine per week with assembly starting on Thursday...72
Figure 33: Labor requirements for one machine per week with assembly starting on Friday...72
Figure 34: Labor requirements for a production rate of three machines per week, with machines starting on M onday, W ednesday, and Friday... 73
Figure 35: Space requirements for a production rate of three machines per week ... 74
Figure 36: Labor requirements for a production rate of five machines per week, with machines starting on M onday through Friday...74
List of Tables
Table 1: U ES shift structure... 21
Table 2: Time study categories for assem bly steps ... 28
Table 3: Time study recording sheet with examples of documented assembly steps ... 29
Table 4: Locations of tasks within current sub-mod procedures... 35
Table 5: Reorganization of tasks into Blocks. Grey cells indicate <10 minutes work in that location...44
Table 6: W eekday shift structure...50
Table 7: Shift schedules and Workload Percentage for each shift schedule for the Preliminary Build Sch e d u le ... 5 8 Table 8: Shift schedules and worker Availabilities for Production Build Schedule...67
1. Introduction
Varian Semiconductor Equipment and Associates (VSEA) designs and manufactures ion implantation machine tools for use in semiconductor manufacturing. These complex tools are assembled and tested at VSEA's manufacturing facility in Gloucester, MA. The tool is comprised of four modules that are built and tested in parallel: the Source, the Analyzer and Corrector of the Beam Line, and the Universal End Station (UES). Currently, the lead time for assembling and testing the UES is significantly longer than the lead time for the Source and Beam Line modules. This thesis analyzes the practices of the UES flow line and proposes means to reduce the overall lead time. This chapter provides background information on the semiconductor industry and VSEA, and the operations at VSEA's plant in Gloucester, MA.
1.1. Semiconductor Industry Overview
The semiconductor industry is comprised of two segments: microchip manufacturers and capital equipment manufacturers. Microchip manufacturers consist of companies that fabricate integrated circuits, whereas capital equipment manufacturers are companies that make the machine tools for the fabrication process. Companies within the microchip manufacturing segment include Intel, Samsung, Taiwan Semiconductor, Analog Devices, and Global Foundries. Capital equipment manufacturers
include Applied Materials, KLA-Tencor, and Lam Research Corp.
The capital equipment segment can be further divided based on the process for which the machine tool is used. Front End of the Line (FEOL) tools create circuit elements on the device layer such as resistors, transistors, and capacitors. Back End of the Line (BEOL) tools create the interconnecting layers of the chip. Varian designs and manufactures machine tools for ion implantation, which is an FEOL process.
1.2. Semiconductor Manufacturing
Fabrication of semiconductors begins with a wafer of single crystal silicon that acts as the substrate on which the integrated circuit is fabricated. The largest and most common wafer size has a diameter of 300 mm and thickness of 775 lim; however, the size of the next generation of wafers will have a 450 mm diameter with a 925 um thickness [1]. Varian's tools currently accommodate 200 mm and 300 mm wafers.
Fabricating integrated circuits is a complex process consisting of several hundred processing steps [1]. The device layer contains the transistor elements and is built first using FEOL processes. These include
Once the device layer has been formed, BEOL processes build the interconnecting layers using photolithography, chemical etching, chemical vapor deposition (CVD), and chemical mechanical planarization (CMP).
Ion implantation is the primary means for doping the semiconductor substrate to alter its electrical conductivity. This is necessary to form junctions and specific types of transistors. The process involves bombarding the wafer with an ion beam that is formed from gases such as boron, phosphorous, arsenic, and antimony [1]. These gases are ionized and accelerated through electromagnetics towards the wafer surface. Photolithography is typically performed before ion implantation to provide a patterned surface that controls the implant locations [1]. Upon colliding with the wafer, the ions penetrate into the crystal lattice of the substrate. The depth of penetration depends on the energy of the ion beam and the path of the ion through the crystal lattice; ions may be stopped by either colliding with nuclei of atoms within the lattice, or by interacting with the electrons of lattice atoms [1]. The result of the doping operation is a distribution of ions within the crystal lattice of the substrate that locally alter the substrate's conductivity.
1.3.VSEA Background
Varian Associates was founded in 1948 in California. The company's early years focused on the development of klystrons, linear particle accelerators, and instrumentation equipment [2]. In 1968, Varian Associates acquired Extrion Corporation in Gloucester, MA, a manufacturer of medium current ion implantation machines. Continual research and development activities on ion implantation established Varian as a market leader throughout the following decades. Varian Semiconductor Equipment Associates Inc. (VSEA) was spun out of Varian Associates in 1999 [3].
Applied Materials was founded in 1967 in Santa Clara, CA, and is currently a market leader in the semiconductor capex industry, reporting $7.5B in revenue for 2013 [4]. Applied has developed a portfolio of machine tools for the majority of the semiconductor processing steps, beginning with chemical vapor deposition in the 1960s. VSEA was acquired by Applied in November 2011 for approximately $4.2B [4].
1.3.1. VSEA Product Line
Varian currently offers five machine types under the VIlSta machine platform: Medium Current, High Current, High Energy, Ultra High Dose, and Solion. This section provides a brief overview of each machine type, however the scope of this thesis is limited to the Trident High Current model.
Medium Current, High Current, and High Energy systems utilize a focused beam; therefore, they use the same machine architecture. These machines generate an ion beam that is accelerated, shaped, and focused using electromagnets. The silicon wafer is then passed through the focused beam to perform the implant. Each machine type is used for different types of implants, depending on the transistor requirements. In 2009, Medium Current, High Current, and High Energy comprised 28%, 46%, and 15% of the ion implantation market, respectively [5].
The High Current line includes the VIlSta Trident platform. Trident was introduced in 2012 and is the industry's most advanced high current ion implanter, offering superior contamination control and beam uniformity. Trident is also available with a cryogenic wafer cooling system that improves the quality of the implant [6]. The demand for Trident machines has constantly increased throughout 2013 and 2014 and is currently Varian's most popular model.
Ultra High Dose machines utilize an architecture that does not utilize a focused beam but rather an ion cloud. Gas is ionized in the wafer chamber and is uniformly accelerated towards the wafer via a DC voltage pulse. This type of implant has been used for DRAM and flash memory production; however, it
has the lowest demand, comprising 12% of the ion implantation market in 2009 [5].
SolionTM is an ion implantation tool that was launched in 2010 for solar cell manufacturing. The tool is based on the VllSta platform and utilizes a focused beam; however, the architecture of the machine is markedly different from the other focused beam implant tools.
The VIlSta product line is summarized in Figure 1. This thesis focuses on the Trident model as it is Varian's most popular tool; however, the similar architectures of the High Current, Medium Current, and
VIISta Platform
Medium Current High Current High Energy Ultra High Dose SolionTM
VIlSta 810XP
VIlSta 81OXE VIlSta Trident VllSta 3000XP VIISta PLAD VIlSta SolionTM
VIlISta 900XPT VIlSta HCP
Figure 1: VIlSta product line
1.3.2. Machine Architecture
Varian's Medium Current, High Current, and High Energy ion implantation machines are comprised of four modules that are assembled and tested in parallel at the Varian plant: the Facilities, the Analyzer and Corrector Modules of the Beam Line, and the Universal End Station. The Equipment Front End Module (EFEM) is a vendor-supplied unit that does not require additional work at Varian. The ion implantation machine is too large for standard shipping methods; thus, these modules are shipped separately to the client's location and the implanter is integrated on site. Figure 2 provides a schematic of the machine.
Beam Line
Analyzer Corrector
I 550 = Beam Path
SMagnet
I Magnet I = Wafer Path
rI
I
I
*
I
-Wafer System0L
i --Equipment Fronti Source Universal End Station End Module
Figure 2: Schematic of ion implanter
The Source module contains the facilities connections for the implanter, the Gas Box and the ionizing cathode. The Gas Box stores the source gases that are used to create the ion beam. The gases are transformed into ions within a heated cathode and are extracted by electromagnets. The current lead time for the assembly and testing of the Source module is 1.8 days.
The Beam Line receives the ion beam from the Source module and further directs, analyzes, focuses and cleanses the beam. This is accomplished with two powerful electromagnets that steer the beam 90* and 550, respectively. These electromagnets are coupled with an analyzer that is used during beam set-up to tune the Facilities module components and the 90* magnet to achieve the desired beam characteristics. The lead times for the assembly and testing of the Beam Line's Analyzer and Corrector modules are 2.0
and 1.0 days, respectively.
The Universal End Station (UES) interfaces with the Beam Line module and is the focus of this thesis. The UES is the most complex module on the machine, consisting of a process chamber that enables the ion implant processing of the wafers, and a wafer handling system. The current lead times for assembly and testing of the UES module are 5.5 and 5.4 days, respectively, for the Trident model. Figure 3 provides a schematic of the UES.
Equipment Front End Module Universal End Station
I Loadport * Loadlock Wafer Handler
I111 (Left) Robot (Left)
I Il
Loadport *
Trabf Orienter Roplat
Loadport
L
~Loadlock
Wafer HandlerLoadport 41 (Right) Robot (Right)
Figure 3: Universal End Station schematic
One of the major functions of the UES is to bring new wafers into a vacuum environment where the ion implant is performed. The UES receives wafers from the EFEM's transfer robot which exchanges wafers from the loadports to a cassette in the UES load locks. The load locks are filled with wafers at atmospheric pressure, are pumped down to vacuum, then release the wafers to the vacuum robots.
The second major function of the UES is to perform the ion implant on the wafer by passing the wafer through the ion beam. This is accomplished with the wafer handler robots, the orienter, and the platen. The robots pass a wafer to the orienter for rotational positioning, then move the wafer from the
orienter to the platen. The platen then passes the wafer through the ion beam to perform the implant. The wafer handler robot then returns the wafer from the platen to the load lock, and the process repeats until all of the wafers in a load lock have been processed. The load lock is then pressurized, and exchanges the processed wafers for new wafers via the transfer robot.
The entire wafer handling process is choreographed to provide maximum throughput. The system can operate at rates of up to 500 wafers per hour.
1.3.3. Universal End Station Architecture
Six major assemblies are integrated to form the Universal End Station. These include the Frame, Wafer Handler, Bottom Process Chamber, Top Process Chamber, Electronics Control Rack (ECR) and Tool Control Rack (TCR). Each assembly has components and subassemblies supplied to the UES line by Varian's warehouse, supermarket, Gold Squares, line side inventory, and short lead-time vendors.
The Frame assembly is considered a High Level Assembly (HLA) that is supplied to Varian by a vendor, and consists of a weldment that serves as the underlying structure for the UES and its harnessing. The Frame is used for all models of the UES.
The Wafer Handler assembly contains the load locks, wafer handler robots, and the orienter. The load locks act as an interface between the Equipment Front End Module which operates at atmospheric pressure, and the UES which operates under vacuum. Each load lock contains a cassette to store the wafers, and two pneumatic doors that open to the Equipment Front End Module and the wafer handler robots, respectively. Turbo pumps allow for the load locks to be pumped down to vacuum, and vents allow for a return to atmospheric pressure. The role of the orienter is to rotationally position the wafer using an LED sensor. Each wafer has a notch to indicate the crystallographic orientation of the lattice that the LED sensor locates. The wafer handler robots act as an interface between the load locks, the orienter, and the Roplat that is contained in the Bottom Process Chamber.
The Bottom Process Chamber attaches to the Wafer Handler and contains the Roplat mounted on an air bearing that serves as an elevator. The Wafer Handler Robots pass a wafer to the Roplat, which rotates the wafer about a horizontal axis to set the implant angle before passing the wafer through the ion beam. The air bearing then raises the Roplat and wafer through the beam to perform the implant.
The Top Process Chamber attaches to the Bottom Process Chamber a.nd accepts the ion beam from the Beam Line module. The Top Process Chamber contains a roughing pump and three cryo-pumps that achieve the required vacuum of -10-7 torr for ion implantation.
The Electronics Control Rack and Tool Control Rack contain the power supplies, drives, and the computer that control the tool. These racks are built in a cell that is separate from the UES line.
1.4. Current Operations of the UES Line
1.4.1. Process Flow
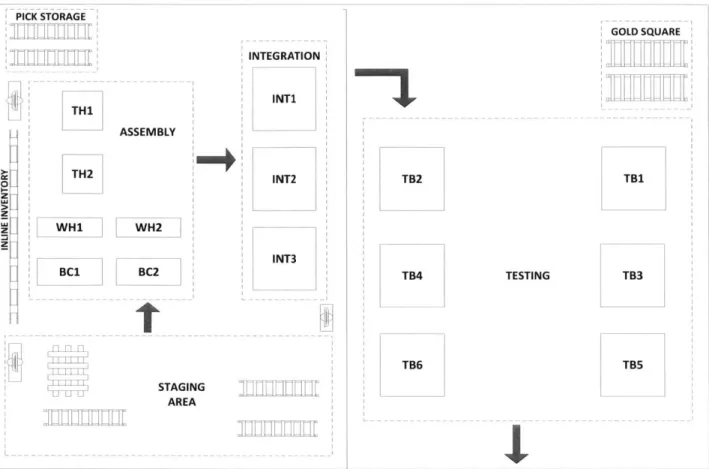
Figure 4 shows the process flow for the UES flow line, and Figure 5 shows the shop floor layout. The five major assemblies described in section 1.3.3 are built independently and are then integrated. Integration consists of mechanical, electrical, gas, and pneumatic connections. The shop floor allows for two machines to be in Assembly and three machines to be in Integration at one time (see Figure 5). The current average lead time for the assembly and integration of a Trident High Current UES is 5.5 days.
After integration is complete, the UES is moved to a testing bay. Testing consists of calibrations, alignments, and functional tests that are performed in series. After the UES has passed all tests, including a 2,500 wafer cycling test, the machine is cleaned and prepped for shipping. The current average lead time for the testing of a Trident High Current UES is 5.4 days.
Production Control EZVI Customer Buid Fram--- e ---Suppliers Warehouse I Supermarket Gold I Square I Inline Inventory Bottom Chamber Waer Handier TCRI 1e~
ECRJ
Testing Prep/Ship 3 Q 1 Q I L---I 5.5 days Asebyand Test Lead Time5.4fdays
Figure 4: Process flow for UES production with labor requirements indicated for Build, Integration, and Test [7]
Integration
PICK STORAGE THi TH2
z
z
WH1i BC1 ASSEMBLY WH2]
BC2
INTEGRATION INT1 INT2 INT3 STAGING AREA TB2 TB4 TB6 TESTING GOLD SQUARE TB1 TB3 TB5Ir
Figure 5: UES Flow Line schematic [71
1.4.2. Inventory
There are five inventory sources for the UES line: inline inventory, warehouse inventory, Gold Square inventory, supermarket inventory, and vendor managed inventory. Inventory movement, including vendor managed inventory, is managed through a Material Requirements Planning (MRP) system.
Inline inventory consists of common components such as fasteners and o-rings. These parts are stored in bins beside the assembly area and an order is placed with the warehouse when a bin level is low.
Warehouse inventory arrives at the UES line in bins. Warehouse deliveries are made multiple times per shift and the parts are ordered 24 hours before they are required on the UES line.
Gold Square inventory is a Kanban system that is managed by the VSEA supermarket. Gold Square items are subassemblies that are common across many models, and are built and tested in the supermarket. A Kanban transaction card is completed by the assembler when a Gold Square item is used. This information is later entered into the MRP system by a production supervisor.
Vendor managed inventory consists of HLA's and large machined castings. Vendor agreements allow for these items to be ordered with a two day lead time. Varian's MRP system provides vendor's with a portal to view active and received orders, and to also monitor the forecasted production schedule. Upon arrival to the UES line the vendor supplied items are stored in the staging area until needed.
1.4.3. Scheduling
VSEA operates four shifts allowing for 24 hour production during the week and 12 hours of production on Saturdays and Sundays. Table 1 shows the shift structure. Weekday shifts allow for 30 minutes of overlap for exiting workers to transition tasks to incoming workers. Each shift has a dedicated number of assemblers to the UES line; however, some test technicians "float" between the UES line and the
Mixed Model Line, and some also work in Final Test.
Table 1: UES shift structure
No. Workers
Shift Days Time
_______________________Assembly
Test
1 Dedicated
1 Monday - Friday 7am - 3:30pm 9 Dedicated 6 Float
2 Final Test
4 Float
2 Monday - Friday 3pm - 11:30pm 5 Dedicated 6 Final Test
2 Dedicated
3 Monday - Thursday 9pm - 7:30am 5 Dedicated
2 Final Test 4 Float 4 Saturday, Sunday, and one weekday 7am - 7pm 4 Dedicated
7 Final Test
A Production Build Order (PBO) is issued for each machine. The PBO contains all of the order specific information such as the customer, ship date, configurations, optional features, and any unique order specific instructions. It is common for customers to make changes to the PBO even after production has
begun.
The production start date (hereafter referred to as laydown) for a machine is back calculated by the MRP system from its ship date based off of historical assembly and testing lead times. Currently, 10 days are provided for the combined assembly and testing of a UES. The MRP calculated laydowns are then used by the production manager to create a weekly laydown schedule.
Little's Law [8] is a theorem that relates the number of units in a system (L) to the time spent in the system (W) and the arrival rate (X) through the equation:
L = AW
Little's Law can be used to calculate the expected lead time (W) of an ion implant machine if the amount of WIP (L) and the laydown rate (A) is known. Figure 6 uses historical assembly start and testing finish dates to calculate the number of laydown's per week and the average WIP from the first six months of Varian's Fiscal Year 2014 to compare the lead time predicted by Little's Law to the actual lead times of machines.
Actual vs. Theoretical Lead Times
18 16 -14 -12 0 E N Average Lead F8 Time (Days) 4 - Little's Law 2 Lead Time (Days) 0 1 2 3 4 5 6
Fiscal Year Month Number
Figure 6: Average lead times compared to lead times predicted by Little's Law
The predicted lead time in Figure 6 is between 1% and 26% different from the actual lead time. Little's Law assumes the system's inputs and outputs are balanced, and work is processed in some equitable way such as First In, First Out (FIFO). The discrepancy in Figure 6 may be due to deviations from a FIFO policy due to Varian's customers requesting changes to a machine's ship date, or from the number of new laydowns in a month not equaling the number of machines shipped. Nevertheless, Figure 6 does show that Little's Law can be generally applied to the UES line.
1.5. Problem Statement
1.5.1. Motivation
Reducing the assembly and testing lead times of modules has been a focal point of Varian's lean
projects. Lowering these lead times allows for less Work in Process (WIP) and a higher response level to
changes in demand.
Lowering WIP allows for less money to be tied up in in-process inventory, reduces storage requirements,
and mitigates the risk of obsolescence. Ion implant machines are high in cost and are physically large;
thus, the benefits of reduced WIP are of high value to Varian.
Varian also experiences frequent client requested changes to PBO's. Varian allows clients to change the
specifications of a machine at any time during production, or cancel the order entirely, without penalty.
Shortening the lead times will mitigate the risks associated with PBO changes by allowing the tool to be
produced as close to the ship date as possible.
The ion implant tool is comprised of four modules that are built in parallel at the Gloucester facility, with
a fifth module supplied by a vendor. Currently, the assembly and testing lead time for the UES is the
longest of the modules at 10.9 days for the Trident model, whereas the lead times for the Source
,
Analyzer, and Corrector modules are each less than 2 days. Varian is interested in reducing the
assembly and testing lead time of the UES, as it will directly reduce the overall lead time of the tool.
1.5.2. Problem Identification
A Cause-and-Effect diagram was created after interviews with shift leads and production managers, and
first person observations (see Figure 7). Many factors contribute towards the long lead time of the UES,
with People, Procedures, and Process being the most prevalent categories.
People Pr Inefficient Scheduling Understaffed Inefficien Se ocedures 4- Proced 4- Pr t Process quencing Detail-Supplier Quality Issues Material Shortages Materials Environment
Figure 7: Cause and Effect diagram for UES lead time
Process
ures Out of Date NVA Activities
ocedures Not Followed High WIP
Rework
SLUong Lead
ow Morale/Motivation
Frequent Schedule Changes Frequent Order Changes
-Management
Two time studies were performed, one to observe assembly and integration and the second for the testing of a UES, to understand the impact of each factor. These time studies are described in chapter 2 of this thesis. The results of the assembly time study showed that the greatest impact on the assembly lead time will be realized by improving the sequencing of assembly tasks and the scheduling of the workforce, and by reducing the time spent on Non-Value Added activities. The testing time study also identified simultaneous testing as a candidate for lead time reduction (see chapter 2).
Improving the assembly sequencing and the efficiency of workforce scheduling is the focus of this thesis. The assembly time study (see sections 2.3 and 2.5) showed that the time durations for tasks and the critical sequencing of tasks that would achieve the lowest lead time were not known. Furthermore, the scheduling of workers during assembly and integration was found to be inefficient. We observed that the available labor resources were allocated across a high amount of WIP, preventing any single machine from having the number of workers that would be required to achieve an optimized assembly sequence. Little's Law (see equation 1) shows that reducing WIP reduces lead time; however, there is a lower limit to lead time that is defined by the constraints of the system such as required assembly sequences, and the availability of space and labor. This thesis documents a reorganization of assembly tasks that allows for this minimum lead time to be identified and achieved. The overarching goal of this thesis is to propose means to have the assembly and integration of the UES follow a critical path.
Reducing the duration of tasks during assembly and integration will have the greatest impact once a critical path is followed. Jain (2014) identified that the greatest contributor to Non-Value Added activities during assembly and integration was related to searching for components, specifically those that arrived from the warehouse [7]. These components are ordered from the warehouse via pick lists; however, there is currently no system to separate and organize the components for different procedures. Jain proposes a kitting system that will reduce the amount of time workers spend searching for parts. The system will also allow for workers to easily identify missing components. This will reduce Non-Value Added time for all tasks that use kitted components that arrive from the warehouse, effectively reducing both labor hours and the length of the critical path [7].
The testing phase of the UES is currently assumed to be a sequence of tests that must be performed in series. Bhadauria (2014) investigated the possibility of performing tests simultaneously [9]. Through pairing of tests, the potential impact that simultaneous testing could have on the UES lead time was quantified [9].
1.5.3. Approach
First person observations, interviews, and the two time studies (see chapter 2) were used to develop the problem statement. This thesis proposes a means to achieve the minimum assembly lead time for a Trident UES by optimized scheduling of assembly and integration tasks within the system's constraints.
This project was undertaken in three main phases: identification of the critical path for assembly based on system constraints (Phase 1), development and piloting of a preliminary build schedule that prioritized the critical path (Phase 2), and the development of sustainable cyclic production schedules (Phase 3).
Determining the critical path for assembly and integration was achieved in multiple stages. Task durations, dependencies, and locations were used to group tasks into new procedures called Blocks. Space and labor constraints were then added. The result of Phase 1 was the identification of the critical path that achieves the minimum lead time with the current shift structure, assuming there are no other machines as WIP.
Phase 2 extended the findings from Phase 1 to develop a preliminary build schedule that prioritized the critical path and satisfied the labor constraints for production rates up to one machire per day. The build schedule was then piloted to obtain an additional time measurement for each Block.
Phase 3 then developed a refined build schedule based off of the results of the pilot study performed in Phase 2. This build schedule was used to develop cyclic schedules for different production rates. These schedules accommodate the current shift structure and consider all machines that are WIP for assembly and integration. Figure 8 outlines the process flow for this project.
Preliminary
Analysis
Phase 1
Phase 2
Phase 3
*Assembly and Testing time studies *Problem identification
eConsolidation of tasks into Blocks
*Critical path constrained by Block dependencies and durations eCritical path constrained by Blocks and space
*Critical path constrained by Blocks , space and labor availability
eTrial of a preliminary build schedule that prioritized the critical path for assembly
*Creation of a production build schedule from results of Phase 2 *Robustness and drag analyses of proposed build schedule
eCreation of cyclic schedules for various production rates
Figure 8: Project process flow1.6.Thesis Organization
Chapter 2 describes the assembly and testing time studies that were used to develop the problem statement discussed in this chapter. Chapter 3 performs a critical path analysis on the assembly of the UES, and describes the rearranging of procedures required for the analysis. Chapter 4 develops a preliminary build schedule based off of the critical path analysis, and describes the results of a trial of this schedule. Chapter 5 develops a production build schedule that is based off of the trial results from chapter 4. The robustness of this schedule is analyzed by calculating the float of all non-critical procedures. A critical path drag analysis is also performed to identify the critical procedures with the highest potential for lead time reduction. Finally, production schedules are developed using this build
schedule for rates of up to five machines per week. Chapter 6 provides conclusions and
2. Assembly and Testing Time Studies of the UES
A time study involves observing an activity and recording the time spent performing certain tasks. The practice of time studies began in the manufacturing industry at the turn of the 1 9th century [10] and
continue to be commonly practiced. This chapter outlines the two time studies that were performed on the assembly and testing phases of a Trident High Current UES. These time studies led to the problem statement described earlier in chapter 1.
2.1.Objectives
The objectives of the assembly and testing time studies were to capture time measurements for tasks that are outlined in Varian's procedures, to observe the relative start and end times of the tasks and procedures, to determine the dependencies between tasks, and to categorize activities as Value Added or Non-Value Added. The results of these time studies were then used to identify three potential areas for improving the lead time of the UES.
2.2. Methodology
The time studies were performed on the Trident UES model to align with the scope of this thesis. The assembly time study was performed over six days in March of 2014, while the testing time study was
performed over five days in June of 2014.
A minimum of one team member was on the shop floor across all shifts during each time study to achieve uninterrupted observation of the machine. Global start and end times were recorded for each assembly step performed by the assemblers (e.g., gathering components, preparing hardware, assembling components, etc.). Each step was then categorized as either Value Added (VA) or Non-Value Added. The team further categorized the Non-Value Added steps as either Non-Value Added Process (NVA-P), Non-Value Added Movement (NVA-M), Non-Value Added Waiting (NVA-W), or Non-Value Added Idle (NVA-l). Definitions and examples of each of these classifications are shown in Table 2.
Table 2: Time study categories for assembly steps
Category Definition Example(s)
Value Added (VA) An assembly step that changes the * Making mechanical connections form, fit, or function the machine between components
A Inspecting sealing surfaces for
A step that does not add value to
dust/hair/debris.
Non-Value Added the machine but is a necessary
Process (NVA-P) manufacturing step. A step that the * Searching for components customer is not willing to pay for. * Re-work due to vendor quality or
internal quality issues
Non-Value Added Any movement of the machine or 0 Using the crane or dolly
jack
to move Movement (NVA-M) major assemblies an assembly to the integration bay* Moving the machine to a testing bay Non-Value Added A procedure has been started but * The procedure for installing a
Waiting (NVA-W) cannot proceed due to a material subassembly cannot continue due to
shortage a shortage of o-rings
A A procedure that actively worked on
Non-Value Added during 1st shift cannot be continued
Idle (NVA-l) cannot proceed due to a labor by 2nd shift due to a labor shortage
shortage
s Scheduled breaks
Varian uses a Lotus Notes database to document the assembly and testing details for every ion implant tool that is produced. A Logbook is generated within the database for each tool and contains order specific information including assembly and testing procedures, sign-offs, and daily logs. The assembly of the UES module is documented in 21 unique procedures, hereafter referred to as sub-mods. Each sub-mod procedure contains multiple tasks that require a sign-off by the assembler once the task is complete.
Each sub-mod task was assigned a task ID number for the time studies. These ID numbers were generated based on the sub-mod structure currently used by Varian. A task ID consists of two parts: the sub-mod ID and the task number within the sub-mod procedure. The 21 assembly sub-mod procedures were assigned sub-mod ID's Al through A21, and the 61 testing sub-mods were assigned T1 through T61. Tasks within each sub-mod were numbered sequentially, beginning with 1. Thus, the third task in sub-mod A12 had a task ID of A12.03, the eighth task of T25 has a task ID of T25.08, and so forth. Figure
Modules
Gas Box Module
Universal End Station Module
Sub-mods -+ Al -+ A21 -> T61 Tasks -+ A1.01 - Al.02 -> A21.01 - A21.02 -+ T1.01 -4 T1.02 T61.01 T61.02
Figure 9: Logbook structure with Lotus Notes database. Each task requires a sign-off by the assembler upon completion
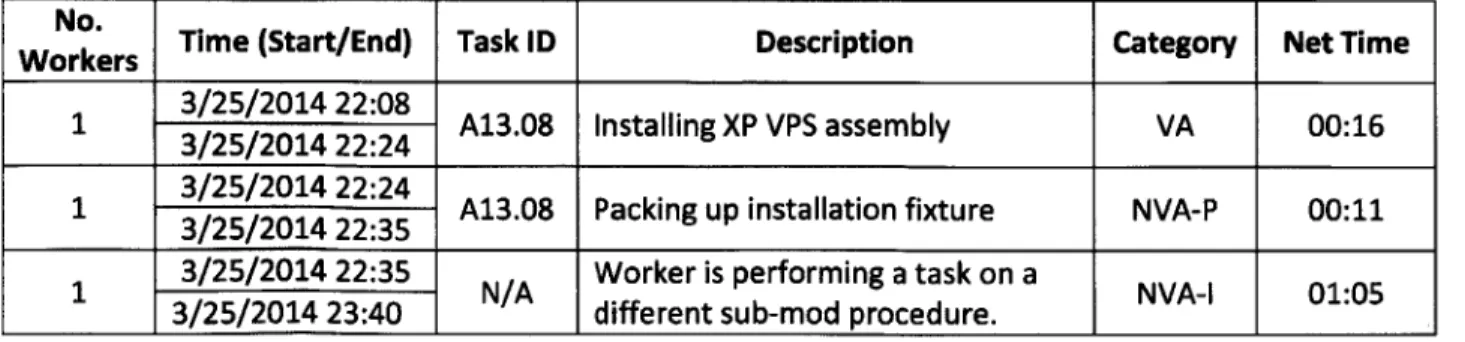
Each step that was observed during the time study was assigned to one of the task ID numbers, with the exception of idle time, which was not assigned to any task. The duration of each task was later calculated by summing the times of each assembly step assigned to each task ID. Table 3 shows an example of the time study recording sheet.
Table 3: Time study recording sheet with examples of documented assembly steps
No.
Workers Time (Start/End) Task ID Description Category Net Time
3/25/2014 22:08
1 3/25/2014 22:24 A13.08 Installing XP VPS assembly VA 00:16
3/25/2014 22:24
1 3/25/2014 22:24 A13.08 Packing up installation fixture NVA-P 00:11
1 3/25/2014 22:35 N/A Worker is performing a task on a NVA-l 01:05
3/25/2014 23:40 different sub-mod procedure.
+ Assembly
2.3.Assembly Time Study Results
The time study for the assembly and integration of a Trident UES was performed in March, 2014, with an observed lead time of 5.8 days, which is similar to the 5.5 day average assembly lead time of a Trident
UES tool. The planned assembly lead time for this Trident UES was 5 days.
Figure 10 illustrates the activity level of the assembly sub-mod procedures. An Active period has at least one person working on the sub-mod procedure and corresponds to VA, NVA-P, or NVA-M activities. An Inactive period occurs when the sub-mod has been started but is not completed (hereafter referred to as an open sub-mod), and either a labor resource is unavailable or not assigned to the sub-mod, or a material resource is unavailable; this corresponds to the activity categories NVA-l and NVA-W, respectively. Figure 10 shows that sub-mod's have a high degree of inactivity. The dependencies for the first task of each sub-mod are also shown.
Assembly lime Study: Trident ES131234 Laydown and Prep Frame
Wafer H andler/Load Lock Buildup Bottom Hat Buildup
ECR Build Bottom Hat Installation to Frame Wafer Handler/Load Lock Installation
TCR Build Top Hat Buildup Roplat Installation Process Chamber Lin ers Top Hat to Bottom Hat installation Trough and Manifolding Tool and Electronics Rack Installation Process Chamber Buildup Scan Rotate Harness Load Lock Additions Tubing, Harnessing, and Light Links Misc End Station Items 8 Gas Control Final Steps
2
-3
Time from Start of Build (Days)
4 1 = Ative = = Inactive 0 5 6
Figure 10: Activity of assembly sub-mod procedures
Figure 11a shows the ratio of the cumulative Active and Inactive periods for the entire build, while Figure 11b and 11c show the total breakdown within these periods. The high degree of inactivity indicates that sub-mod procedures are often started but are not immediately followed through to
become Inactive during the 2nd and 3rd shifts which have fewer laborers. Inactivity may also be a result of the task organization between sub-mods. Each task is dependent on other tasks that must be completed before it can be started. A sub-mod would be forced to become Inactive if one of its tasks has dependencies on a different sub-mod that are not completed. A sub-mod could also become Inactive if it is forced into a NVA-W state due to a material shortage; however, this was found to be infrequent as is shown in Figure 11c. Lastly, a sub-mod could be Inactive simply due to scheduled breaks.
The breakdown of activities in Figure 11b shows that the majority of time during the Active period is spent on Value Added activities. However, the total amount of Non-Value Added Process (16%) activities is not insignificant, corresponding to 17 labor hours.
a. % b. 16% 2% c. 3%
26%
74% NEVA
* Active 82% U NVA-P 97% N NVA-W
* Inactive U NVA-M U NVA-1
Figure 11: Overall of activity level of sub-mods (a), breakdown of the total Active period (b), breakdown of the Inactive period
(c)
While Figure 10 and Figure 11 assess the state of sub-mod procedures during the build, it is also useful to analyze the overall state of the machine, hereafter referred to as the Grand State. Figure 12 shows the Grand State of the machine observed during the assembly time study. The machine is Active when one or more mods are Active, and is Inactive when all of the open mods are Inactive, or no sub-mods are open. The long periods of inactivity at the end of days one and two are due to unavailable production time since Varian does not operate a 3rd shift on Friday, Saturday, or Sunday. Other periods of inactivity are due to scheduled breaks, or labor shortages. Figure 13 shows the ratio of the states. The Grand State of the machine spent 21% (24 hours) of the available production time in the Inactive state; 9 of these hours were due to scheduled breaks.
Grand State of Machine During Assembly Active
Inactive
0 1 2 3 4 5 6
Time from Start of Build (Days)
Figure 12: Grand state of machine during Assembly time study
a. b. 21% 35% 65% 79% * Active m Active * Inactive E Inactive
Figure 13: Overall grand state of machine during assembly (a), with unavailable production time omitted (b)
The dependencies for each task were determined through interviewing the assemblers and observing the assembly process during the time study. A dependency is defined as the tasks direct predecessor(s); second order predecessors were not recorded, as they were inherently included as a dependency of the direct predecessor task. Tasks can have many dependencies, or no dependencies.
Of the 198 tasks that are contained in the 21 assembly sub-mods, a total of 324 first order dependencies were recorded. These dependencies were then used to analyze the dependencies between sub-mods. A sub-mod was considered to be dependent on any other sub-mod that contained predecessor tasks.
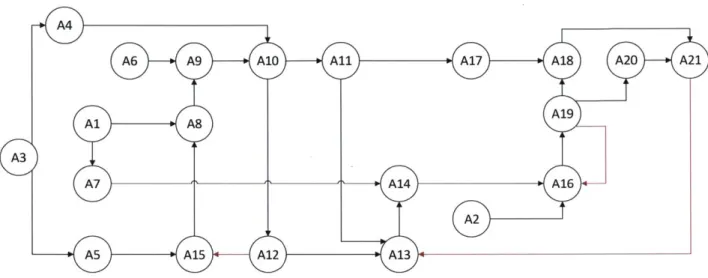
Figure 14 shows the dependency network for the current sub-mod structure. There are three sub-mods
assembly and therefore should have no successors; however, A13 contains tasks that have dependencies to tasks within A21. This results in a circular dependency relationship, indicated by a red arrow in Figure 14 (A13-A14-A16-A19-A18-A21-A13). Two other circular dependency loops were also identified (A15-A8-A9-A1O-A12-A15, and A16-A-19-A16). Circular relationships result in sub-mods being left incomplete until the loop is able to be closed.
A6 A9 A10 All A1 A18 A20 A21
A19
Al A8
A7 """ A14 A16
A132
Figure 14: Activity-on-Node diagram showing the sub-mod dependency network
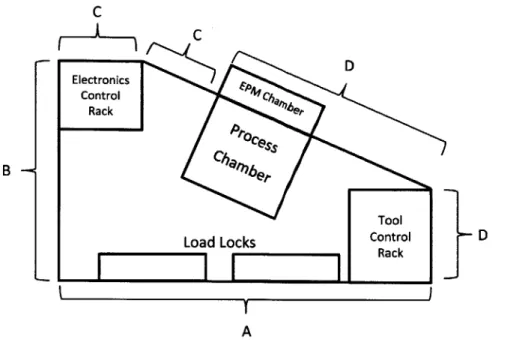
The location of each assembly task was also recorded; a location was defined as a work space suitable for one worker at any given time. The individual work benches that facilitate the building of the large assemblies (e.g., Wafer Handler, Top Process Chamber, etc.) were each considered to be one location. During integration, the UES was divided into four locations (see Figure 15). Location A captured the load lock side of the machine, B included the front of the ECR and the top of the machine, C captured the side and back of the ECR and the door-side of the Process Chamber, and Location D included the EPM side of the process chamber and the TCR.
C C D Electronics F Control 1Ch Rack
e
B - 0"bet. ToolLoad Locks Control D
F
I I I RackA
Figure 15: Location zones on the UES
The majority of tasks take place in a single location, with the exception of the installation tasks for the large assemblies which occupy two location zones on the UES. Sub-mods ranged from having all tasks being performed in the same location, to having up to 5 locations where tasks occur. Table 4 shows the locations of the tasks within each sub-mod procedure.
Table 4: Locations of tasks within current sub-mod procedures
I
Location
Sub-mod Procedure -C U C a) L. a) C Cu I-C) 4- Il-a) -0 C E -c U U 0 E 0 0 U-LU LU U U 0 -0 4-J ca -J (0 C 0 4-4 C U -J 0 0 0 -J 4-J r_ Cu C In a) H Al - Laydown and Prep FrameA2 - Misc End Station Items A
A3 - Mount Chambers & Wafer Handler - SLICE e *
A4 - Top Hat Buildup e
A5 - Bottom Hat Buildup e
A6 - Wafer Handler/Load Lock Buildup e
A7 - ECR & TCR Build * *
A8 - Bottom Hat Installation to Frame
A9 -Wafer Handler/Load Lock Installation * e
A10 - Top Hat to Bottom Hat Installation
All - Trough and Manifolding * *
A12 - Process Chamber Liners
A13 - Process Chamber Buildup * * * *
A14 - Tool and Electronics Rack Installation 0
A15 - Roplat Installation e
A16 - Scan Rotate Harness Installation *
Al7 -Load Lock Additions * *
A18 - Tubing, Harnessing, and Link Lights * *
A19 - Misc. End Station Items B . .
A20 - Gas Control . .
2.4.Testing Time Study Results
A time study was conducted on the testing of a Trident UES in June of 2014. The total lead time for the testing of the observed machine was 5.0 days, which is similar to the current average testing lead time for a Trident UES of 5.4 days. Varian currently plans for a 5 day testing lead time.
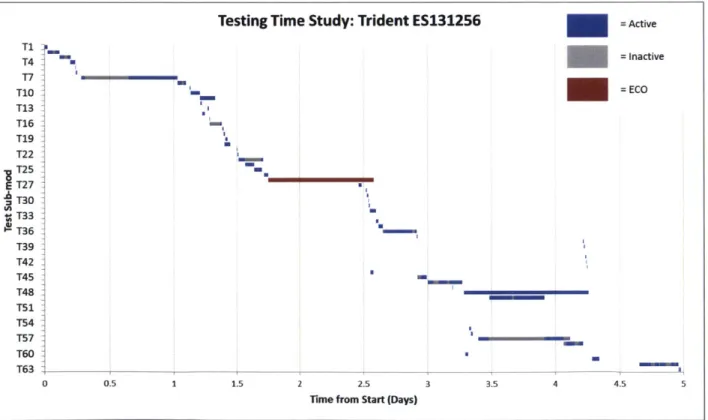
Figure 16 shows the observed activity level for each of the 61 tests that were performed. The test durations ranged from a few minutes to many hours. One test technician was assigned to the machine at any given time for the time study; thus, the majority of tests were performed sequentially. There were, however, a small number of tests that were performed in parallel - for example, a test that required ultra-high vacuum had the long pump-down step remain Active while other tests were performed in parallel. Figure 16 also shows the impact of an Engineering Change Order (ECO) that was carried out on the machine during the time study. All testing was halted for the majority of the ECO period. T1 T4 T7: T10 T13 T16 T19 T22 T25 E T27 tT30 T33 T36 T39 T42 T45 T48 T51 T54 T57 T60
T63-Testing Time Study: Trident ES131256 =Active
= Inactive
= ECO
0 0.5 1.5 2
2.5
1.5 2 2.5
Time from Start (Days)
3 3.5 4 4.5 5
Figure 16: Test activity levels for Testing time study
Figure 17 shows the breakdown of activities during the time study. Figure 17a shows the ratio of test procedures being in an Active or Inactive state, Figure 17b shows the breakdown of activities within the
".---==,
Active period, and Figure 17c shows the breakdown during the Inactive period. These charts exclude the downtime that was caused by the ECO.
Figure 17a shows that test procedures spent an average of 26% of their duration in an Inactive state. This relatively high percentage is not indicative of every test; Figure 16 shows that many tests were performed without any inactivity. Rather, there were relatively few tests that had extremely long periods of inactivity (tests 7 and 57 in Figure 16, for example). The inactivity of test 7 was due to a labor shortage, while test 57 had a long waiting period due to a perceived error in the cable lengths of a vendor supplied component.
Figure 17b shows the breakdown of activities during the Active period. The majority of testing is considered to be Non-value Added (90%) as tests that verify functionality do not add value to the machine. Calibrations and alignments, however, were considered to be Value Added activities, and make up 10% of the Active time.
a. b. 0.4% 10% c.
26%
35%
74%
EVA
* Active U NVA-P 65% U NVA-W
* Inactive 90% U NVA-M E NVA-I
Figure 17: Overall activity level of tests with delay from ECO omitted (a), breakdown of Active period (b), breakdown of Inactive period (c)
Figure 18 shows the Grand State of the machine during the testing time study. There are three periods where the machine was completely Inactive. The first of these periods, at approximately 0.5 days, was due to a labor shortage. The second period, at approximately 2 days, was due to the ECO that required all testing to be halted. The third period, at 4.5 days, was over a Friday night when Varian does not operate a 3rd shift.
Figure 19a shows the ratio of the overall Active to Inactive time for the machine. This includes the delay from the ECO and the unavailable production time. Figure 19b shows the Grand State with the ECO delay and unavailable production time omitted. The machine spent 20% (19 hours) of the available production time in the Inactive state, of which 7 hours are attributed to scheduled breaks.
Active
Inactive
0 1
Grand State of Machine During Testing
2 3 4 5
Time from Start of Build (Days)
Figure 18: Grand State of the machine during testing time study
a. b. 20%
37%
63% 80%
" Active U Active
* Inactive E Inactive
Figure 19: Overall activity level of the machine (a), with delay from ECO and unavailable production time omitted (b)
2.5. Discussion
The assembly and testing time studies provided a baseline of data for the team to build upon. While there are many positive aspects to the current assembly and testing activities, this section focuses on identifying areas that could improve the UES lead time. Three improvement opportunities were
identification of tasks on the critical path for assembly and the staggering of breaks to minimize critical path idle time, and the kitting of parts to reduce NVA time. The testing time study identified simultaneous testing as an opportunity for lead time reduction.
The creation of a build schedule requires the durations and dependencies of the scheduled items to be known. For the UES, a build schedule could be created by scheduling sub-mods based on their durations and dependencies; however, this is not possible with the current organization of the sub-mod procedures. Sub-mods currently have tasks that are performed at different stages during the build which results in a high amount of Inactive time of sub-mods. The current sub-mod structure also has circular dependencies that prevent the creation of a dependency-based schedule. Lastly, the tasks within sub-mods occur across many locations. A reorganization of the sub-mod procedures would allow for a dependency-based build schedule to be constructed.
The absence of a build schedule also results in the critical path to be unknown. Workers currently self-diagnose the assembly state of the machine and decide on the next task to perform based on their own understanding of the optimal build sequence, their skill level, and their personal preference. This results in ad-hoc sequencing of tasks. It also prevents the identification of the critical path - the sequence of tasks that drives the overall assembly lead time. Setting assembly milestone dates and times is also difficult. A build schedule would allow for the critical path for assembly to be identified and prioritized. Analyzing the Grand State of the machine showed that scheduled breaks contributed at least 9 hours to the assembly lead time. If a critical path were to be known, breaks could be staggered to prevent the critical path tasks during assembly from becoming idle, effectively preventing breaks from contributing to the assembly lead time of the machine.
A large amount of Non-Value Added time was also observed during assembly, with the most significant NVA activity attributed to searching for parts that arrived from the Varian warehouse [7]. Improving the organization of these parts and the method for communicating a part shortage could reduce this NVA time.
The testing time study showed that the majority of testing is considered to be Non-Value Added; however, these activities are not necessarily due to inefficiencies but rather are tests that verify critical functionality. The organization of sub-mods for testing was found to be highly efficient with the

![Figure 4: Process flow for UES production with labor requirements indicated for Build, Integration, and Test [7]](https://thumb-eu.123doks.com/thumbv2/123doknet/14098043.465265/19.918.88.789.98.618/figure-process-production-labor-requirements-indicated-build-integration.webp)