Stereo CUTLASS - A new capability for the SuperDARN HF radars
16
0
0
Texte intégral
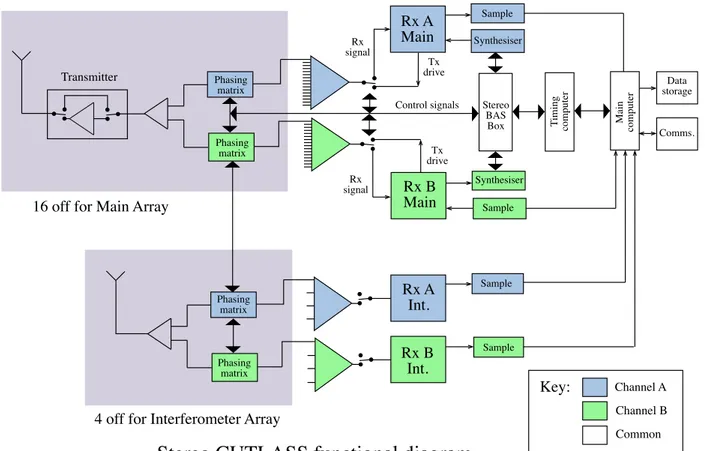
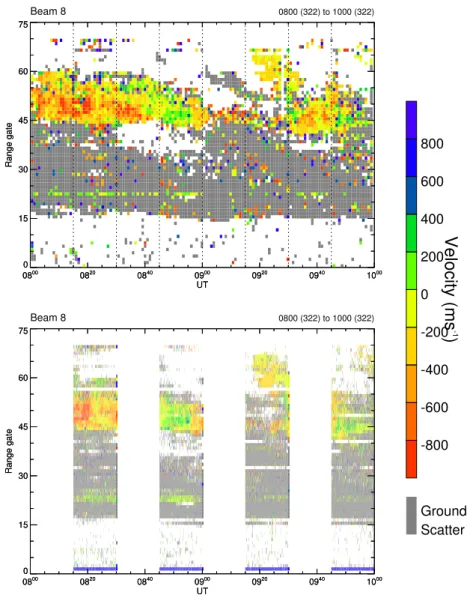
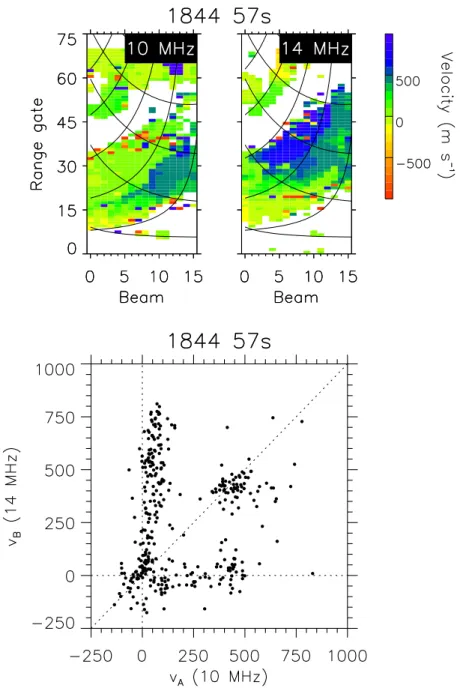
Figure

+4


Documents relatifs