A new module for the tracking of radar-derived precipitation with model-derived winds
8
0
0
Texte intégral
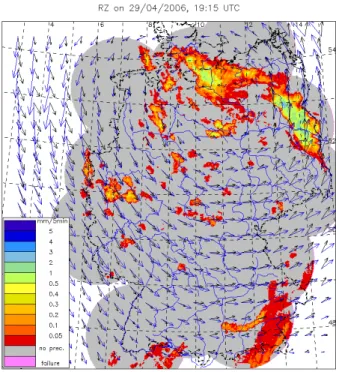
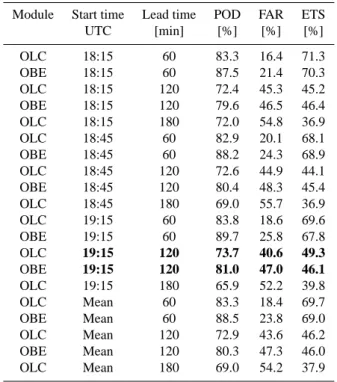
Figure
Documents relatifs