HAL Id: hal-00304619
https://hal.archives-ouvertes.fr/hal-00304619
Submitted on 1 Jan 2001HAL is a multi-disciplinary open access archive for the deposit and dissemination of sci-entific research documents, whether they are pub-lished or not. The documents may come from teaching and research institutions in France or abroad, or from public or private research centers.
L’archive ouverte pluridisciplinaire HAL, est destinée au dépôt et à la diffusion de documents scientifiques de niveau recherche, publiés ou non, émanant des établissements d’enseignement et de recherche français ou étrangers, des laboratoires publics ou privés.
surface waters in the Lake Maggiore catchment
M. Rogora, A. Marchetto, R. Mosello
To cite this version:
M. Rogora, A. Marchetto, R. Mosello. Trends in the chemistry of atmospheric deposition and surface waters in the Lake Maggiore catchment. Hydrology and Earth System Sciences Discussions, European Geosciences Union, 2001, 5 (3), pp.379-390. �hal-00304619�
Trends in the chemistry of atmospheric deposition and surface
waters in the Lake Maggiore catchment
M. Rogora, A. Marchetto and R. Mosello
C.N.R. Istituto Italiano di Idrobiologia, L.go Tonolli 50-52, I-28922 Verbania Pallanza, Italy
Email for corresponding author: a.marchetto@iii.to.cnr.it
Abstract
The Lake Maggiore catchment is the area of Italy most affected by acid deposition. Trend analysis was performed on long-term (15-30 years) series of chemical analyses of atmospheric deposition, four small rivers draining forested catchments and four high mountain lakes. An improvement in the quality of atmospheric deposition was detected, due to decreasing sulphate concentration and increasing pH. Similar trends were also found in high mountain lakes and in small rivers. Atmospheric deposition, however, is still providing a large and steady flux of nitrogen compounds (nitrate and ammonium) which is causing increasing nitrogen saturation in forest ecosystems and increasing nitrate levels in rivers. Besides atmospheric deposition, an important factor controlling water acidification and recovery is the weathering of rocks and soils which may be influenced by climate warming. A further factor is the episodic deposition of Saharan calcareous dust which contributes significantly to base cation deposition.
Keywords: trend, atmospheric deposition, nitrogen, stream water chemistry.
Introduction
For several decades, northern Italy has been affected by acid deposition which carries high amounts of sulphur (S) and nitrogen (N) compounds. Of these compounds, the major pollutants are sulphate (SO4) and nitrate (NO3), originating from an atmospheric reaction involving N and S oxides emitted during combustion and also ammonium ion (NH4), derived from the emission of ammonia (NH3) from livestock and cultivated land. In fact, most Italian industry, agriculture and traffic are located in the Po Plain.
The Lake Maggiore catchment (Fig. 1), in the Central Alps, borders on the most densely inhabited part of the Po Plain to the north and is the area which receives the highest S and N loads in Italy (Mosello and Marchetto, 1996). This is due both to the high amount of precipitation (up to 2 m y-1) and to the fact that most of the precipitation in this area comes when the wind blows from the south. Lake Maggiore and its catchment are shared between Italy and Switzerland and studies on the quality of freshwater and atmospheric deposition have been carried out jointly on both sides of the border since the 1970s.
This area was included in the RECOVER:2010 project (Ferrier et al., 2001) to assess the effect of the present trends
towards an improvement in atmospheric deposition chemistry, mainly as a result of the agreements which have caused emission reductions on freshwater in most European countries. The project focuses mainly on acid sensitive sites, however, because of the overwhelming importance of N deposition in this area, study sites in Italy were selected in areas of contrasting sensitivity to acid deposition, in order to identify analogies and differences in N dynamics.
This study concerns four rivers: the Pellino and the Pellesino, draining an area in which SO4 weathering can be excluded, and the Pescone and the Cannobino, which carry small amounts of SO4 originating from rock weathering. Four high mountain lakes were also included in the study, the two Paione lakes, which lie on crystalline rocks and are acid sensitive, and the two Boden lakes which are buffered by a small proportion of soluble rocks in their catchments. Trends in the chemical composition of these rivers and lakes are compared with those of atmospheric deposition, and input/output budgets are used to detect trends in N retention in each catchment. Finally, the characteristics of the atmospheric deposition and the catchments in this area are highlighted.
Study sites and methods
HIGH MOUNTAIN LAKES
Four of the study sites are small lakes (< 0.06 km2) located above the timberline (> 2000 m a.s.l.), in areas not affected by local disturbances or direct anthropogenic sources of pollutants (Table 1).
Land cover in these catchments is restricted to small areas of alpine meadow (Mosello et al., 1999). In most of the catchments, soils are absent or very thin: for example, soil cover is 39 and 33% in the catchments of Lakes Paione Inferiore and Superiore, respectively. Lying on acidic bedrocks, these soils are acidic, with low base saturation and an exchange complex dominated by hydrogen (H) and aluminium (Al) ions. The catchments of the Boden Lakes also contain small amounts of rocks with a high content of carbonate (CO3) and SO4 minerals. Sampling and soil analysis in these catchments are in progress and will provide information on the possible influence of soil composition on the observed water chemistry.
When possible, three water samples were collected at different depths at the centre of the lake. Elsewhere a single surface sample was collected close to the outlet. The four lakes have been sampled every year since 1984 but sampling frequency has ranged from yearly to monthly.
SMALL RIVERS
Four rivers were considered: Pellino, Pellesino and Pescone are tributaries of Lake d’Orta, while River Cannobino, further north than the others, is a tributary of Lake Maggiore (Fig. 1 and Table 1). The catchments are sparsely populated and do not include any intensive industrial, stock-rearing or agricultural activity. The morphological characteristics
of the area do not permit extensive agriculture, so that the use of N fertilisers is negligible (Boggero et al., 1996). Apart from Cannobino, the rivers are short (up to 20 km) and drain small forested catchments (3.4-17.5 km2). The catchments are almost exclusively formed of granitic and granodioritic rocks.
The River Cannobino catchment is larger (110 km2) and subjected to greater anthropogenic pressure near the villages along the shoreline of Lake Maggiore. Vegetation occupies more of the catchment as the altitude rises, with coniferous forest covering about 43% of the total surface. Gneisses, mica-schists and para-gneiss are very common, but in the upper part of the catchment basic rocks are also present (Boggero et al., 1996; Mosello et al., 1993). All the rivers have been sampled monthly since 1972 (Cannobino), 1984 (Pellino and Pescone) and 1986 (Pellesino).
Water discharge was measured daily on River Cannobino starting in 1978. In the case of the Lake d’Orta tributaries considered in this paper, the discharge was not directly measured but calculated as a fixed percentage of the daily value measured for the outlet of the lake, based on the catchment area of each river.
ATMOSPHERIC DEPOSITION
A total of 19 wet deposition sampling stations were operated for different periods in the Lake Maggiore catchment (Table 2), run by the C.N.R. Istituto Italiano di Idrobiologia (CNRIII), the Laboratory for Environmental Studies of the Canton Ticino (LSA), the Italian Power Agency (ENEL) and the Joint Research Centre of the European Union (JRC). Deposition samples were collected weekly in all the stations except Ispra, where they were collected daily, and Pallanza, where samples were taken after each event. Intercomparison
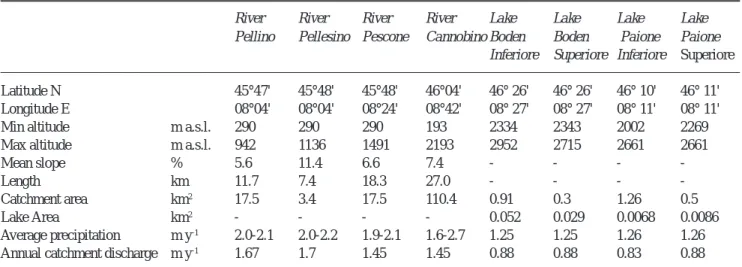
Table 1. Selected characteristics of the rivers and lakes considered and their catchments.
River River River River Lake Lake Lake Lake Pellino Pellesino Pescone Cannobino Boden Boden Paione Paione
Inferiore Superiore Inferiore Superiore Latitude N 45°47' 45°48' 45°48' 46°04' 46° 26' 46° 26' 46° 10' 46° 11' Longitude E 08°04' 08°04' 08°24' 08°42' 08° 27' 08° 27' 08° 11' 08° 11' Min altitude m a.s.l. 290 290 290 193 2334 2343 2002 2269 Max altitude m a.s.l. 942 1136 1491 2193 2952 2715 2661 2661
Mean slope % 5.6 11.4 6.6 7.4 - - -
-Length km 11.7 7.4 18.3 27.0 - - -
-Catchment area km2 17.5 3.4 17.5 110.4 0.91 0.3 1.26 0.5
Lake Area km2 - - - - 0.052 0.029 0.0068 0.0086
Average precipitation m y-1 2.0-2.1 2.0-2.2 1.9-2.1 1.6-2.7 1.25 1.25 1.26 1.26
Table 2. Selected characteristics of the atmospheric deposition sampling stations in the Lake Maggiore catchment
Station Laboratory latitude longitude altitude data used
north east m a.s.l.
Italy
Pallanza CNRIII 45° 55' 8° 34' 208 1984-2000
Domodossola CNRIII 46° 06' 8° 12' 270 1986-2000
Lake Toggia CNRIII 46° 26' 8° 27' 2160 1984-1995
Devero CNRIII 46° 19' 8° 15' 1634 1996-2000 Graniga CNRIII 46° 07' 8° 11' 1080 1994-2000 Bellinzago CNRIII 45° 35' 8° 40' 190 1989-2000 Orta CNRIII 45° 50' 8° 25' 380 1990-1999 Lunecco CNRIII 46° 04' 8° 36' 415 1989-2000 Ispra JRC 45° 49' 8° 38' 210 1986-1997 Mottarone ENEL 45° 53' 8° 30' 930 1988-1992 Switzerland Locarno LSA 46° 11' 8° 47' 380 1988-1999 Lugano LSA 46° 01' 8° 58' 350 1989-1999 Lugano Brè LSA 46° 00' 8° 59' 925 1997-1999 Magadino LSA 46° 10' 8° 53' 197 1989-1991 Piotta LSA 46° 31' 8° 41' 1007 1990-1999 Cimetta LSA 46° 12' 8° 48' 1671 1990-1991 Acquarossa LSA 46° 25' 8° 56' 575 1990-1999 Stabio LSA 45° 52' 8° 56' 351 1990-1999 Robiei LSA 46° 26' 8° 30' 1890 1997-1999
Fig. 1. Location of the study sites in the Lake Maggiore catchment and map of the emissions of S oxides in
Northern Italy
SO emissions in 1989 in Italy
2Lake Maggiore catchment
> 5 g m y-2 -1
2-5 g m y-2 -1
< 2 g m y-2 -1
Milan
Main point sources Sampling stations for
deposition chemistry Sampled lakes R. L. L. R. R. R. Pallanza Ispra Domodossola Bellinzago Orta
exercises are performed yearly to ensure that the results obtained in different laboratories are comparable (Mosello
et al., 1998). Two stations, Pallanza and Domodossola, have
been run continuously since 1981 and 1986, and these data were used for trend analysis.
CHEMICAL ANALYSIS
To perform trend analysis on data collected over decades, any new analytical methods must be tested for comparability with the previous ones. The methods used for the analysis of pH, electrical conductivity, NH4 (spectrophotometry, indophenol) and reactive silica (spectrophotometry, ammonium molibdate) were not changed. In contrast, ion chromatography replaced the methods used for the analysis of SO4 (turbidimetry until 1984), chloride (Cl) (ion selective electrode, until 1984), NO3 (spectrophotometry, salicylate until 1986) and base cations (atomic absorption spectrophotometry, until 1991) (Tartari and Mosello, 1997). After any change in the analytical method, paired analyses were performed to detect possible systematic differences in the results. It emerged that SO4 and Cl concentrations may have been overestimated with the older techniques, particularly at lower concentrations (Della Lucia et al., 1996), so that data collected before 1984 are not considered here.
EVALUATION OF INPUT FLUXES
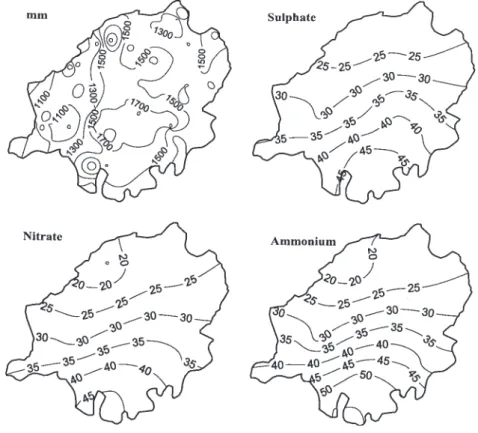
To calculate the total input of S and N to each catchment from the atmosphere, yearly volume weighted mean ionic concentrations of all the sampling stations operational in each year were used. Concentration data were interpolated over a 100-m grid by Kriging, in order to give an unbiased estimate of the mean concentration. In the study areas, ionic concentrations in atmospheric deposition follow a smooth spatial gradient. In contrast, the precipitation amount varies locally according to the terrain. For this reason, it was interpolated on the basis of 128 sampling stations located throughout the whole Lake Maggiore catchment (Fig. 2). Results obtained from the two interpolation processes were then multiplied cell by cell to obtain the deposition values. This calculation only accounts for wet deposition, while total input flux also includes the contribution of dry deposition. The estimation of dry deposition of aerosols and gases represents one of the greatest sources of uncertainty in the calculation of the S and N budget. Deposition processes, in fact, depend on the reactivity of the compound and the surface interacting with it, and differs for water, soil and vegetation (Garland et al., 1974; FOEFL, 1994, 1996).
No direct measurement data for dry deposition are available for the sampling stations considered in this work,
Fig. 2. Distribution map of the amount of precipitation and of the concentrations of SO4, NO3 and NH4 (meq l-1) in wet deposition in the Lake Maggiore catchment in 1997
apart from the EMEP station located in Ispra. This station, however, is located within a Research Centre and is not representative of forested catchments. The deposition values were obtained by multiplying the atmospheric concentration of the chemical compound by a specific deposition velocity, depending on compound and land use. Some of these values for S and N compounds can be found in literature and were used to estimate the ratio between dry and wet deposition depending on land cover in the Swiss part of the Lake Maggiore catchment (FOEFL, 1994, 1996).
In this paper, the percentage of the total area covered by forest, agricultural land and lakes, rocks and settlements, for each catchment, was used to calculate a fixed ratio between dry and wet deposition (Table 3). Values range from 0.36 and 0.16 (River Cannobino) to 0.46 and 0.22 (River Pellino) for N and S, respectively.
EVALUATION OF OUTPUT FLUXES FOR RIVER CATCHMENTS
Output fluxes were obtained following the method proposed by Sonzogni et al. (1978). This was chosen by Mosello and De Giuli (1982) after a careful comparison of different estimates of chemical load from the tributaries to Lake Maggiore. Output flux (L) is calculated from the concentration in each i-th sample (Ci), the discharge measured on the i-th sampling day (Qi, m3 s-1), the mean yearly discharge (Qy, m3 s-1) and the number of samplings (n): 2 1 2 2 i 1 2 1 i 1 Q Q n Q n 1 1 Q L Q L n C Q n 1 1 Q Q C Q L
∑
∑
∑
∑
= = = = − + − + = n i n i i i y n i n i i i where: n L 1 ∑ = = n i CiQi and n Q Q 1 ∑ = = n i i.After a detailed study on the optimal sampling frequency for the estimate of chemical budgets (Mosello and De Giuli, 1982), a monthly sampling frequency was chosen for Lake Maggiore and Lake d’Orta tributaries. To verify the accuracy of the estimate of the output budget, a detailed study was performed on River Cannobino between June 1990 and July 1991 (Brizzio, 1993). In this period, sampling was performed: (i) monthly, following the same procedure used in this paper, (ii) weekly, following the same procedure, (iii) every 7 hours by means of an automatic sampler (ISCO 2100) and the 24 samples were then pooled together to obtain a weekly sample. The annual SO4 fluxes obtained using the monthly samples (937 t y-1) were found to be within 5% of the estimate obtained using weekly discrete (990 t y-1) or pooled (985 t y-1) samples. The results in the case of NO
3 were 113, 122 and 111 t y-1, respectively.
TREND ANALYSIS
For the atmospheric deposition and river data, trend analysis was performed, applying the Seasonal Kendall Test (SKT) to monthly blocks of data (Hirsch et al., 1982). This test could not be applied to the lakes, which were not sampled regularly. The lake data were analysed using the Mann-Kendall test (Mann-Kendall, 1975). In both cases, trend slopes were calculated according to Sen (1968). A detailed discussion on the methods is reported by Evans et al. (2001).
Results and discussion
TRENDS IN ATMOSPHERIC DEPOSITION
The precipitation regime in the study area is characterised by spring and autumn maxima, wet summers and relatively dry winters. No trend in either the regime or the amount of precipitation was detected during the study period. In contrast, deposition chemistry shows distinct changes. At both sampling stations (Pallanza and Domodossola), SO4 concentration shows a marked decrease (p < 0.001, Table 4), from about 120-130 µeq l-1 in the early 1980s to 50-60 µeq l-1 in the last three years. As a consequence, pH has increased significantly from 4.3-4.4 to about 4.7. Both NH4 and NO3 show no significant trend in atmospheric deposition. A significant decreasing trend in the major base cations (BC), calcium (Ca) and magnesium (Mg), was also detected.
This decreasing trend in SO4 concentration is characteristic of other sampling stations in the Lake Maggiore catchment and is also confirmed by the data available for other sites in northern Italy (e.g. Tait and Thaler, 2000). It can be attributed to the changes in atmospheric emissions over the last 20 years from the main sources of pollution: fossil fuel
Table 3. Calculated dry/wet ratios of atmospheric deposition
of S and N compounds.
N S
Dry/Wet Dry/Wet
Forest 0.50 0.25
Agricultural 0.26 0.20
T
able 4.
Significant trends detected in wet deposition, rivers and lakes. MKT
: Mann-Kendall test, SKT
: Seasonal Kendall test, B: Sen’
s
slope estimate
Probability level: * < 0.01; ** < 0.001. B units: unit y
-1 (pH), µeq l -1 y -1 (SO 4 , NO 3 , Base cations), mg l -1 y -1 (Reactive silica, T otal N)
(*): sulphate data collected before 1984 were not used.
p H SO4* TIN Base cations pB p B pB p B Pallanza wet SKT ** 0.021 ** -2.233 0.358 * -0.664 1984-99 Domodossola wet SKT ** 0.032 ** -2.747 -1.261 ** -0.981 1986-99 p H SO4* NO3 Base cations Reactive silica T otal N p B pB p B pB pB p B River Cannobino SKT 0.004 ** -2.082 ** 0.456 2.088 ** 0.028 0.001 1978-99 River Pellino SKT * -0.007 ** -1.041 ** 2.160 ** 3.085 ** 0.077 ** 0.030 1984-99 River Pellesino SKT ** -0.010 ** -1.501 ** 1.927 0.525 ** 0.065 ** 0.030 1986-99 River Pescone SKT -0.007 -0.883 ** 1.81 1 4.166 ** 0.087 ** 0.027 1984-99 p H SO4* Alkalinity Base cations Si T otal inorganic N p B pB p B pB pB p B
Lake Boden Inferior
e MKT 0.01 1 * * 1.873 * * 6.306 * * 7.220 0.005 -0.028
1978-99 Lake Boden Superior
e MKT 0.01 1 0.993 * * 5.840 * * 6.253 * 0.007 -0.033
1978-99 Lake Paione Inferior
e MKT 0.005 * * -0.984 * 0.715 -0.690 0.007 -0.090
1984-99 Lake Paione Superior
e MKT * * 0.032 * * -0.855 * * 0.667 -0.535 * 0.008 * 0.428 1984-99
combustion, industry, motor vehicles and agriculture. Between 1980 and 1995, sulphur dioxide (SO2) emission in Italy decreased from 3.7 106 to 1.3 106 t y-1, owing to the reduction in S oxide emission from thermoelectric power plants (which represent 62% of the total anthropogenic emission in Italy) and industrial production (24%) (ANPA, 1999). On the other hand, the emission of N compounds remained fairly constant; NH3 emissions have remained steady at about 0.5 106 t y-1 for the last 15 years, while N oxides increased slightly from 1986 to 1992 and then decreased in 1993-95 (ANPA, 1999).
The regular gradient of pollutant deposition in the Lake Maggiore catchment is easily explained by the meteorology of the study area, which receives air masses mainly from the south-east, i.e. from the Po Plain. In effect, if the sampling stations located in the north-western (Italian) part of the Lake Maggiore catchment, which are relatively far (40-110 km) from the emission sources, SO4 and NO3 concentrations are negatively correlated with distance from the city of Milan, which may be taken as a reference point for industry in the Po Plain (Fig. 3). The gradient of SO4 deposition related to the distance from Milan was more pronounced in the 1980s but it is still evident in 2000. Nitrate concentration also decreases with the increasing distance from Milan. The pattern for NH4 deposition is more complex, because of the greater importance of local sources. A decreasing gradient from south to north is still present, and was quite evident in the 1980s (Fig. 3).
ROLE OF ALKALINE DEPOSITION
Studies performed over the past two decades have demonstrated that large amounts of soil dust are moved by winds, mostly in arid regions. North Africa is one of the largest sources of mineral dust in the world (Prospero, 1995). Dust sources are active all year, especially in summer, when they feed strong pulses across the Mediterranean to Europe. Previous papers have already shown how dust pulses affect the chemical composition of rain in areas which can be reached by these events (Avila and Rodà, 1991; Loÿe-Pilot
et al., 1986). In northern Italy rain events may visibly contain
Saharan dust, which can play an important role in neutralising the acidic input associated with atmospheric deposition.
Using the data collected at Pallanza by bulk collector in 1975-76 and then since 1980 for every rain event, the total number of Saharan events and their seasonal frequency (Fig. 4) were evaluated. Of the 32 episodes recorded in the study period, 25 occurred in late spring-summer (May-September), while no events were recorded in winter. The number of events per year is very irregular, and ranges from 0 to 4.
From the chemical point of view, these events are characterised by pH values between 5.9 and 8.0, and high alkalinity and Ca content (60 µeq l-1and 130 µeq l-1, respectively), which are markedly higher than the mean of the period 1980-99 (3 µeq l-1 and 30 µeq l-1, respectively). A further contribution of Ca and alkalinity derives from red dust (not considered in the analyses), which is carried out
Fig. 3. Trends in concentrations of SO4, NO3 and NH4 (meq l -1) in wet deposition in the Italian sampling stations in relation to their
on filtered samples.
The contribution of alkaline events to the total annual fluxes of ionic species is shown in Table 5. In spite of the low amount of precipitation (3-13% of the annual amount), these events carry from 20% to 70% of the Ca deposition and can buffer the mineral acidity of atmospheric deposition.
TRENDS IN HIGH MOUNTAIN LAKES
Owing to the characteristics of their catchments, alpine lakes are highly sensitive to atmospheric deposition of pollutants and may be conveniently used as environmental indicators, in particular to assess the long-term effect of changes in
atmospheric deposition. The four Italian high altitude lakes included in this project show increasing pH and alkalinity (Table 4), particularly evident in the case of Lake Paione Superiore (p < 0.001), where pH has increased from 5.3-5.8 before 1992 to the present values of around 6.0 (Mosello
et al., 1999).
In the case of the Paione lakes, the catchment of which lies exclusively on crystalline rocks, increasing pH is in agreement with decreasing SO4 concentrations and represents a clear sign of recovery from acidification. No significant trend was found, however, in the concentration of N compounds.
In the case of the Boden Lakes, the results of trend analysis were different and SO4 increased sharply in both of them (Table 4). At the same time, they also showed a significant increase in alkalinity. In these lakes a significant contribution to the ionic content comes from the weathering of more soluble rocks, in some cases containing SO4 minerals. Recovery from acidification is commonly related to decreasing weathering rates, but climate warming, which is particularly evident in high mountain areas, is regarded as an important factor driving rock weathering: the higher temperature shortens the period of snow cover and then increases the proportion of precipitation flowing over exposed rocks and into the soil, which can contribute to rock weathering.
In effect, the hypothesis of an increase in the weathering rate induced by climate warming has already been advanced
Fig. 4. Seasonal pattern of the episodic deposition of Saharan dust
in 1975-99.
Table 5. Yearly percent contribution of Saharan dust to the amount of precipitation and to ionic fluxes at the Pallanza
sampling station
Year n° of events % amount NH4+ Ca++ Mg++ Na+ K+ Alk Cl– SO
4 = NO 3 – 1984 3 9 9 55 51 18 22 100 17 12 10 1985 2 11 6 72 13 33 5 6 8 5 1986 0 1987 1 6 9 47 15 21 12 22 12 7 1988 4 8 10 34 22 15 12 100 15 9 7 1989 1 1990 1 3 3 24 13 7 4 82 5 4 3 1991 1 12 16 62 30 44 18 100 34 18 10 1992 3 1993 2 10 18 40 24 29 15 98 31 14 17 1994 3 13 21 48 27 19 19 91 17 19 18 1995 1 1996 3 8 16 34 19 29 17 48 25 14 12 1997 0 1998 1 1999 4 6 10 21 13 10 10 32 9 10 10 0 1 2 3 4 5 6 7 8 9
Jan Feb Mar Apr May Jun Jul Aug Sep Oct Nov Dec
for some mountain lakes in the Eastern Alps (Sommaruga-Wögrath et al., 1997) and might explain these results, although more data are needed to support such conclusions.
TRENDS IN SMALL RIVERS
The decreasing atmospheric deposition of SO4 to the study area is reflected in the water chemistry of the rivers; SO4 decreased steadily in rivers Pellino, Pellesino and Cannobino (p < 0.001) and less markedly in river Pescone (Table 4). Even though all the catchments are mainly formed of crystalline rocks (granites, granodiorites, gneisses, mica-schists and para-gneiss), those of the rivers Cannobino and Pescone also contain small amounts of soluble rocks and a contribution of SO4 from weathering cannot be excluded.
Although there is no trend in N compounds in rain water, there is evidence of a highly significant increasing trend in NO3 in the rivers (Table 4), probably related to the high level of N saturation in the studied catchments. As pointed
out before, all of this area is subject to high deposition of N compounds, both NO3 and NH4, the concentrations of which are among the highest in Europe. Rivers catchments have been exposed to high inputs of N for prolonged periods, in excess of the needs of vegetation uptake and microbial processes. This fact is reflected by the high NO3 levels in rivers, while NH4 is rapidly oxidised in soil and water, so that its concentration in these rivers is very low. Climate factors, particularly increasing temperature, could also play a role in N trends, leading to increased mineralisation of soil organic matter with release of N in excess of that taken up by plants or immobilised in the soil (Wright, 1998).
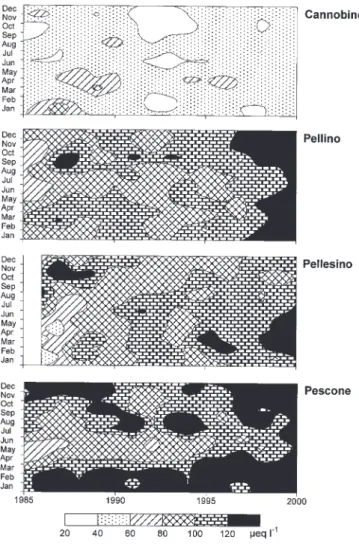
To understand the influence of biological uptake on NO3 concentrations better, seasonal and interannual variations of the content of this element in river waters have been assessed (Fig. 5). The four rivers are characterised by different levels of NO3 concentrations. In the River Cannobino NO3 concentration is generally lower than 60 µeq l-1, with a single peak of 100 µeq l-1 in January 1987. This river is located further north than the other rivers and is consequently exposed to a lower level of pollutant deposition (Boggero et al., 1996). The highest concentrations are found in River Pescone, where NO3 often reaches concentrations of 140-150 µeq l-1.
Besides the increasing trend in all the rivers, there are also changes in the seasonal pattern of NO3 concentrations (Fig. 5). In all the rivers studied, N uptake in the growing season leads to lower NO3 concentrations in spring and summer (from April to August), which are particularly evident on the River Pescone. The seasonal variations become less evident in recent years; the uptake processes do not seem to be able to cope with the increasing level of NO3 release by catchment soils. In both Rivers Pellino and Pescone nitrate concentration in 1999 remained above 120 µeq l-1 for all the year. These results agree with the evidence of N saturation (Mosello et al., 2001) in river catchments (Stoddard and Traaen, 1994).
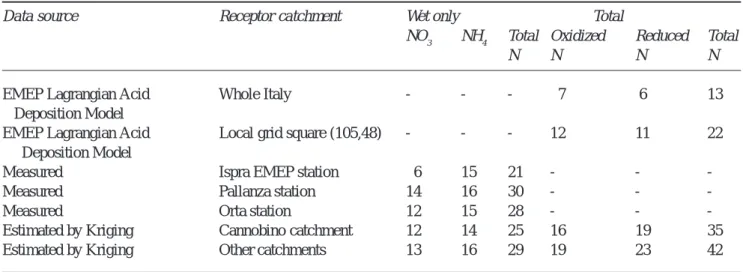
To evaluate N retention in forested catchments, yearly input/output N budgets were calculated for each river. Input fluxes were obtained on the basis of a number of atmospheric deposition sampling stations covering the Lake Maggiore catchment (Fig. 1 and Table 2). The values of annual N deposition for the year 1998 are compared with the results of the EMEP Lagrangian Acid Deposition Model (LADP) (Table 6). All the catchments lie in the EMEP grid square (105, 48). Total N deposition estimated for this area is 70% higher than the average for the whole of Italy and reduced N compounds account for almost half of the total N flux.
The complex relief of the area, and the marked heterogeneity in the distribution of precipitation, lead to considerable differences between the results of the model
Fig. 5. Seasonal and interannual variations of NO3 concentrations in rivers
and the values actually measured in the field. In fact, comparing the results of the LADP with measured wet deposition at the EMEP station of Ispra, which is located in the same grid square, it is evident that the model does not account for the high fluxes affecting the Alpine region. Measured wet NH4 deposition is by itself considerably higher than the value inferred by LAPD and the total (wet + dry) N deposition predicted by the model is very close to the total wet deposition measured at Ispra, not accounting for dry flux. Deposition values are even higher in the sampling stations located closer to the Alps than Ispra, which
is located at the very margin of the higher ground. Wet N flux measured at Pallanza (20 km south of River Cannobino) and at Orta (located between the catchments) is 33-43% higher than at Ispra.
In terms of input and output fluxes for each river (Fig. 6), during the whole study period, River Cannobino received a distinctly lower N flux (mean value 240 meq m-2 y-1) than the other catchments (270-290 meq m-2 y-1). This difference is reflected in the output fluxes, which average 70 and 170-190 meq m-2 y-1, respectively, indicating that the southernmost basins have reached a higher stage of N
Table 6. N deposition fluxes (kg ha-1 y-1) measured and estimated in the study area
Data source Receptor catchment Wet only Total
NO3 NH4 Total Oxidized Reduced Total
N N N N
EMEP Lagrangian Acid Whole Italy - - - 7 6 13
Deposition Model
EMEP Lagrangian Acid Local grid square (105,48) - - - 12 11 22
Deposition Model
Measured Ispra EMEP station 6 15 21 - -
-Measured Pallanza station 14 16 30 - -
-Measured Orta station 12 15 28 - -
-Estimated by Kriging Cannobino catchment 12 14 25 16 19 35
Estimated by Kriging Other catchments 13 16 29 19 23 42
saturation than the Cannobino catchment. Retention is clearly related to the input flux (Fig. 7) and in the study period the average retention in River Cannobino was 70%, while in the southernmost basins it ranged between 34 and 42%. Furthermore, during the study period, N retention in River Cannobino remained stable, while in the basins receiving higher N flux it clearly decreased, indicating conditions of increasing N saturation.
All the rivers studied show a significant increasing trend in silica (Si) concentration in the 80s, followed by a period of stability in the 90s (Table 4). Silica concentration in some rivers in the Lake Maggiore catchment were studied by Zobrist and Drever (1989) who found that in small rivers draining catchments composed of crystalline gneiss, the concentration of silicic acid, base cations and alkalinity decrease exponentially with increasing elevation. A similar pattern of decreasing Si concentration along an increasing altitude gradient was also found by Marchetto et al. (1995) in 107 lakes lying in crystalline catchments in this area.
These patterns can be ascribed to a positive relationship between weathering and temperature, which would also be in agreement with the increasing Si concentration in the rivers studied in the last decades, when the temperature in the Alps increased considerably.
Zobrist and Drever (1989) also found unexpectedly high chemical weathering in the Southern Central Alps, below the tree line. They conclude that this rapid weathering was due to a combination of the effects of warm temperature, relatively thick, but immature, soils and the presence of weatherable (mafic) minerals in the rocks. However, the weathering rates were high enough to ensure complete buffering of the acid input from the atmosphere.
Conclusions
Lake Maggiore catchment, the area most affected by acid deposition in Italy, in common with other European sites, has undergone a strong decrease in SO4 deposition, due to the effect of reduced emissions of S oxides (Mosello et al., 2000). However, peculiar to this area are:
z the huge load of N compounds, both NO3 and NH4,
z the steady level of N input flux, which is in agreement with the steady emission rates in Italy, and
z the episodic deposition of Saharan dust, which is able to buffer most of mineral acidity carried by wet deposition.
The chemical composition of rivers in forested catchments and of high mountain lakes is responding to changes in atmospheric deposition with a general decrease in SO4 concentration and an increase in pH and alkalinity. Because of the marked heterogeneity of Alpine geology, however, and the significant proportion of catchments formed of exposed rocks and thin soils, rock weathering plays an important role in controlling water chemical composition.
Finally, NO3 concentration in rivers is relatively high and increasing, in spite of the steady values found in atmospheric deposition. Furthermore, N release from forested catchments remains high during the growing season, in agreement with the conclusion that N flux has exceeded the carrying capacity of forest ecosystems.
Acknowledgments
This study was partially funded by the EU projects RECOVER:2010 (Project No. EVK1-CT-1999-00018) and by the Joint Commission for the Protection of Water on the border between Italy and Switzerland (Commissione
Internazionale per la Protezione delle Acque Italo-Svizzere).
Deposition data were kindly provided by Alberto Barbieri (Laboratorio di Studi Ambientali, Lugano) and by W. Leyendecker and E. Kotzias (Joint Research Centre, Ispra). Results of the LADP model were provided by EMEP through their reports and web pages.
References
ANPA, 1999. Emissioni in atmosfera e qualità dell’aria in Italia. Serie Stato dell’Ambiente, 6, 116 pp.
Avila, A. and Roda F., 1991. Red rain as major contributors of nutrients and alkalinity to terrestrial ecosystems at Montseny (NE Spain). Orsis, 6, 215–229.
Boggero, A., Belfanti, S., Brizzio, M.C., Calderoni, A. and Mosello, R., 1996. Trends in the chemistry of surface water in north-western Italy. IV. Nitrogen in subalpine rivers Pellino,
Fig. 7. Trends in the percentage of total N input retained in each
Pellesino, Pescone and Cannobino (Lago Maggiore watershed).
Mem. Ist. Ital. Idrobiol., 54, 143–159.
Brizzio, M.C., 1993. Evoluzione dell’idrochimica di due torrenti
subalpini (Cannobino e S. Bernardino) nel ventennio 1971-91,
Tesi di Laurea, Università degli studi di Milano, 145 pp. Della Lucia, M., Marchetto, A., Mosello, R. and Tartari, G.A.,
1996. Studies on a chemical gradient of atmospheric deposition from the Po valley to the Alps. Water Air Soil Pollut., 87, 171– 187.
Evans, C.D., Cullen, J.M., Alewell, C., Kopáèek, J., Marchetto, A., Moldan, F., Prechtel, A., Rogora, M., Veselý, J. and Wright, R.F., 2001. Recovery from acidification in European surface waters. Hydrol. Earth Syst. Sci., 5, 283–297.
Ferrier, R.C., Jenkins, A., Wright, R.F., Schöpp, W. and Barth, H., 2001. Assessment of recovery of surface waters from acidification, 1970-2000: Introduction to the Special Issue.
Hydrol. Earth Syst. Sci., 5, 274–282.
FOEFL, 1994. Critical Loads of Acidity for Forest Soils and Alpine
Lakes – Steady State Mass Balance Method. Federal Office of
Environment Forests and Landscape, 234, 68 pp.
FOEFL, 1996. Critical Loads of Nitrogen and their Exceedances
– Eutrophying Atmospheric Deposition. Federal Office of
Environment Forests and Landscape, 275, 74 pp.
Garland, J.A., Atkins, D.H.F., Readings, C.J. and Caughey, S.J., 1974. Technical Note; Deposition of Gaseous Sulphur Dioxide to the Ground. Atmos. Environ., 8, 75–79.
Hirsch, R.M., Slack, J.R. and Smith, R.A., 1982. Techniques of trend analysis for monthly water quality analysis. Water Resour.
Res., 18, 107–121.
Kendall, M.G., 1975. Rank correlation methods. Charles Griffin, London, 202 pp.
Loÿe-Pilot, M.D., Martin, J.M. and Morelli, J., 1986. Influence of Saharan dust on the rain acidity and atmospheric input to the Mediterranean. Nature, 321, 427–428.
Marchetto, A., Mosello, R., Psenner, R., Bendetta, G., Boggero, A., Trait, D. and Tartari, G.A., 1995. Factors affecting the water chemistry of alpine lakes. Aquat. Sci., 57, 81–89.
Mosello, R. and De Giuli, E., 1982. Methods of calculation of chemical loads as applied to Lake Maggiore. Mem. Ist. Ital .
Idrobiol., 40, 55–77.
Mosello, R. and Marchetto, A., 1996. Chemistry of atmospheric wet deposition in Italy. Results from a five year study. Ambio,
25, 21–25.
Mosello, R., Brizzio, M.C., Calderoni, A., Marchetto, A. and Tartari, G.A., 1993. Trends in the chemistry of surface water in north-western Italy. II. Watershed budget and trends in River Cannobino. Mem. Ist. ital. Idrobiol., 51, 167–184.
Mosello, R., Bianchi, M., Brizzio, M.C., Geiss, H., Leyendecker, W., Marchetto, A., Rembges, D., Tartari, G.A. and Muntau, H., 1998. AQUACON-MedBas Subproject No. 6. Acid rain analysis.
Intercomparison 1/98. Joint Res. Centre European Commission,
Rep. EUR 19015 EN, 81 pp.
Mosello, R., Marchetto, A., Boggero, A., Brizzio, M.C., Tartari, G.A. and Rogora, M., 1999. Pluriannual evolution of the hydrochemistry of two alpine lakes (Lake Paione Inferiore and Lake Paione Superiore, Ossola Valley) in relation to atmospheric loads. J. Limnol., 58, 43–49.
Mosello, R., Marchetto, A., Brizzio, M.C., Rogora, M. and Tartari, G.A., 2000. Results from the Italian participation in the International Co-operative Programme on Assessment and Monitoring of Acidification of Rivers and Lakes (ICP Waters).
J. Limnol., 59, 47–54.
Mosello, R., Calderoni, A., Marchetto, A., Brizzio, M.C., Rogora, M., Passera, S. and Tartari, G.A., 2001. Nitrogen budget of Lago Maggiore: the relative importance of atmospheric deposition and catchment sources. J. Limnol., 60, 27–40.
Prospero, J.M., 1995. Saharan dust transport to the North Atlantic Ocean and Mediterranean: an overview. In: The impact of desert
dust across the Mediterranean, S. Guerzoni and R. Chester
(Eds.), 133–151. Kluwer Academic Publishers, The Netherlands.
Sen, P.K., 1968. Estimates of the regression coefficient based on Kendall’s tau. J. Amer. Statist. Assn., 63, 1379–1389. Sommaruga-Wögrath, S., Koinig, K.A., Schmidt, R., Sommaruga,
R., Tessadri, R. and Psenner, R., 1997. Temperature effects on the acidity of remote alpine lakes. Nature, 387, 64–67. Sonzogni, W.C., Monteith, T.J., Bach, W.N. and Hughes, V.G.,
1978. United States Great Lakes Tributary Loadings.
International Reference Group on Great Lakes Pollution from Land Use Activities. International Joint Commission, 187 pp.
Stoddard, J. and Traaen, T., 1994. The stages of nitrogen saturation: classification of catchments included in “ICP on Waters”. In:
Mapping and modelling of critical loads for nitrogen: a workshop report, M. Hornung, M.A. Stutton and R.B. Wilson
(Eds.), 69–76. Proceedings of a Workshop held in Grange-over-Sands (UK), 24-26 October 1994.
Tait, D. and Thaler, B., 2000. Atmospheric deposition and lake chemistry trends at a high mountain site in the eastern Alps. J.
Limnol., 59, 61–71.
Tartari, G.A. and Mosello, R., 1997. Metodologie analitiche e controlli di qualità nel laboratorio chimico dell’Istituto Italiano di Idrobiologia del Consiglio Nazionale delle Ricerche.
Documenta Ist. Ital. Idrobiol., 60, 160 pp.
Wright R.F., 1998. Effect of Increased Carbon Dioxide and Temperature on Runoff Chemistry at a Forested Catchment in Southern Norway (CLIMEX Project). Ecosystems, 1, 216–225. Zobrist, J. and Drever, J.I., 1989. Weathering processes in alpine watersheds sensitive to acidification. Proc. EEC Workshop “Acidification processes in remote mountain lakes”, Pallanza, 20-22 June 1989. Air Pollution Research Report, 20, 179–161.