HAL Id: hal-00317250
https://hal.archives-ouvertes.fr/hal-00317250
Submitted on 1 Jan 2004
HAL is a multi-disciplinary open access
archive for the deposit and dissemination of
sci-entific research documents, whether they are
pub-lished or not. The documents may come from
teaching and research institutions in France or
abroad, or from public or private research centers.
L’archive ouverte pluridisciplinaire HAL, est
destinée au dépôt et à la diffusion de documents
scientifiques de niveau recherche, publiés ou non,
émanant des établissements d’enseignement et de
recherche français ou étrangers, des laboratoires
publics ou privés.
Compressive fluctuations in high-latitude solar wind
B. Bavassano, E. Pietropaolo, R. Bruno
To cite this version:
B. Bavassano, E. Pietropaolo, R. Bruno. Compressive fluctuations in high-latitude solar wind. Annales
Geophysicae, European Geosciences Union, 2004, 22 (2), pp.689-696. �hal-00317250�
Annales
Geophysicae
Compressive fluctuations in high-latitude solar wind
B. Bavassano1, E. Pietropaolo2, and R. Bruno1
1Istituto di Fisica dello Spazio Interplanetario (C.N.R.), Roma, Italy 2Dipartimento di Fisica, Universit`a di L’Aquila, L’Aquila, Italy
Received: 21 March 2003 – Revised: 3 June 2003 – Accepted: 18 June 2003 – Published: 1 January 2004
Abstract. Solar wind compressive fluctuations at MHD scales have been extensively studied in the past using data from spacecraft on the ecliptic plane. In the present study, based on plasma and magnetic field measurements by Ulysses, a statistical analysis of the compressive fluctuations observed in the high-latitude solar wind is performed. Data are from the first out-of-ecliptic orbit of Ulysses, when the Sun’s activity is low and the high-latitude heliosphere is char-acterized by the presence of a fast and relatively steady solar wind, the polar wind. Our analysis is based on the computa-tion of hourly-scale correlacomputa-tion coefficients for several pairs of solar wind parameters such as velocity, density, tempera-ture, magnetic field magnitude, and plasma pressures (ther-mal, magnetic, and total). The behaviour of the fluctuations in terms of their amplitude has been examined, too, and com-parisons with the predictions of existing models have been performed. The results support the view that the compressive fluctuations in the polar solar wind are mainly a superposi-tion of MHD compressive modes and of pressure-balanced structures. Nearly-incompressible effects do not seem to play a relevant role. In conclusion, our results about compressive fluctuations in the polar wind do not appear as a break with respect to previous low-latitude observations. However, our study clearly indicates that in a homogeneous environment, as the polar wind, the pressure-balanced fluctuations tend to play a major role.
Key words. Interplanetary physics (MHD waves and turbu-lence; solar wind plasma) – Space plasma physics (turbu-lence)
1 Introduction
Compressive fluctuations in the magnetohydrodynamic (MHD) range have been commonly observed in the eclip-tic solar wind (e.g. Tu and Marsch, 1995). It is not surprising that compressibility effects may be able to play a nonneg-ligible role in the interplanetary plasma, where Alfv´en and sound speeds generally have the same order of magnitude
Correspondence to: B. Bavassano
(for an incompressible plasma the sound speed should be infinitely large). As is well known, the ecliptic solar wind is characterized by quite a variable velocity. Apart from transient flows directly related to solar events, a pattern of fast and slow streams and the development of compression and rarefaction regions are typical features of the ecliptic wind. These large-scale structures appear to affect the be-haviour of the MHD compressive fluctuations (Marsch and Tu, 1993; Tu and Marsch, 1994). A completely different en-vironment in which to study compressive fluctuations is of-fered by the polar solar wind, a fast and steady flow observed at high heliographic latitudes. The velocity gradients in po-lar wind are much weaker than those typical of the ecliptic wind (Neugebauer et al., 1995). In other words, the polar wind is an almost structureless flow from the velocity pro-file point of view. As shown by the Ulysses spacecraft in its out-of-ecliptic exploration, the polar wind is not a perma-nent feature of the heliosphere. Rather, its presence in the high-latitude heliosphere is dramatically dependent upon the phase of the solar activity cycle (McComas et al., 2002), with a strong role at low activity and almost no role at high activ-ity. In the present analysis the nearly homogeneous environ-ment represented by the polar wind will be used to investi-gate how the compressive fluctuations behave under almost undisturbed conditions.
As is well known, the high-latitude solar wind is charac-terized by the presence of an intense flux of Alfv´enic fluc-tuations (e.g. Goldstein et al., 1995; Smith et al., 1995). In the ecliptic wind a similar situation is observed in the trailing edge of fast streams (Tu and Marsch, 1995). Fluctuations of a compressive type in these ecliptic streams have been studied by Marsch and Tu (1993) and Tu and Marsch (1994). In par-ticular, they have performed an exhaustive statistical analysis of the compressive fluctuations at scales around and below 1 hour, roughly corresponding to the core of the Alfv´enic regime. The main goal of our study is to extend their anal-ysis to the polar wind fluctuations and compare the results obtained for the two kinds (polar and ecliptic) of flow. It has to be mentioned that past studies of polar wind fluctuations (McComas et al., 1995, 1996; Reisenfeld et al., 1999) have indicated a relevant presence of pressure-balanced structures at scales from half a day down to a few hours (while at scales
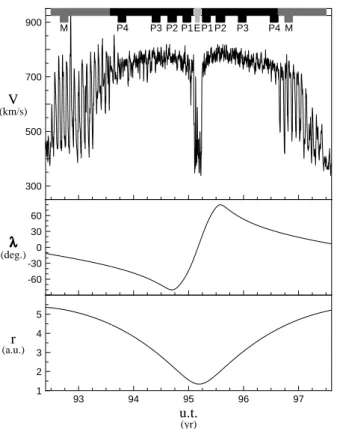
690 B. Bavassano et al.: Compressive fluctuations in high-latitude solar wind 300 500 700 900 (km/s)V M P4 P3 P2 P1EP1 P2 P3 P4 M -60 -30 0 30 60 (deg.) 93 94 95 96 97 1 2 3 4 5 (yr) (a.u.) u.t. r
Fig. 1. The solar wind velocity V (in km/s) and the Ulysses
heli-ographic latitude λ (in degrees) and heliocentric distance r (in as-tronomical units, a.u.) are plotted vs. universal time (u.t.) for the investigated interval.
above few days the thermal and magnetic pressures become positively correlated). In the present analysis we will inves-tigate fluctuations at smaller scales than those examined in the above studies and at the same time we will look for the presence of other correlations. This last one is not a minor point. An overall view of all kinds of correlations existing in the data is important to understand their very nature.
2 The data analysis
The analysed interval is displayed in Fig. 1. Here we plot (from top to bottom) the solar wind velocity V , the spacecraft heliographic latitude λ, and the spacecraft heliocentric dis-tance r for a five-year period (mid-1992 to mid-1997) of the first out-of-ecliptic orbit. At that time the solar activity was low and, as shown in the top panel, a polar wind was present everywhere in the high-latitude heliosphere. Black bars on top of the figure highlight the polar wind phases. The first polar passage occurs in the Southern Hemisphere, the sec-ond one in the Northern Hemisphere. These are the periods that we will use to study compressive fluctuations in the po-lar sopo-lar wind. As a term of comparison, also mid-latitude (gray bars) and low-latitude (light gray bar) intervals will be investigated. Mid-latitude intervals refer to the bound-ary region of the polar wind. They are from the Ulysses near-aphelion phase, when the spacecraft has a low angular
92.5 5.3 -13 93 5.1 -23 93.5 4.6 -34 94 3.8 -48 94.5 2.8 -71 95 1.6 -44 95.5 1.8 75 96 3.1 53 96.5 4.0 33 97 4.7 19 97.5 5.2 8 u.t. r -0.8 -0.4 0 0.4 0.8 (N-Pt) -0.8 -0.4 0 0.4 0.8 (Pm-Pk) P (%) 0 2 4 6 8 10 12 14 16 18 20 22 24
Fig. 2. Solar rotation histograms of ρ(N − Pt) and ρ(Pm-Pk) (left and right panel, respectively) are shown for the interval from mid-92 to 97. The vertical bar on the left indicates polar (black), mid-latitude (gray), and low-mid-latitude (light gray) phases (as in Fig. 1). Time, distance (in a.u.), and latitude (in degrees) are given on the left (u.t., r, and λ, respectively). The colour code for the occurrence frequency P (in per cent) is shown on the right.
velocity. Changes in the relative motion and/or wavy geom-etry lead to repeated crossings of the boundary region, cor-responding to the large velocity excursions seen in the top panel (in contrast, in the near-perihelion phase the spacecraft angular velocity is high and the transition is abrupt, see the sharp velocity variations at the beginning of 1995).
Our analysis is based on the evaluation of the degree of correlation between several pairs of solar wind parameters that characterize the compressive state of the plasma. The pa-rameters under study are the plasma velocity (V ), the proton number density (N ), the proton temperature (T ), the mag-netic field magnitude (B), the proton thermal pressure (Pk),
the magnetic pressure (Pm), and the total pressure (Pt, equal
to Pk + Pm). Correlation coefficients are computed for the
pairs N − Pt, Pm−Pk, B − N , B − T , N − T , and T − V .
Our study will focus on the fluctuations at hourly scale; in other words, the correlation coefficients will be computed on the basis of 1-h intervals. The time resolution of the Ulysses plasma measurements is 4 or 8 min, depending on the space-craft mode of operation (Bame et al., 1992). Regarding the magnetic field (Balogh et al., 1992), we had access to 1-min mean values. These magnetic values have been further aver-aged over the plasma sampling time. A comment about tem-perature and thermal pressure is in order, since in the present study the values from the proton population only have been used. Obviously, the electron contribution is not negligible and surely differs from that of protons. Unfortunately, in the available data set the electron data generally have a worse
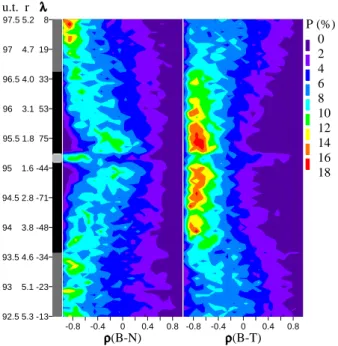
92.5 5.3 -13 93 5.1 -23 93.5 4.6 -34 94 3.8 -48 94.5 2.8 -71 95 1.6 -44 95.5 1.8 75 96 3.1 53 96.5 4.0 33 97 4.7 19 97.5 5.2 8 u.t. r -0.8 -0.4 0 0.4 0.8 (B-N) -0.8 -0.4 0 0.4 0.8 (B-T) P (%) 0 2 4 6 8 10 12 14 16 18
Fig. 3. Solar rotation histograms of ρ(B − N ) and ρ(B − T ) in the
same format of Fig. 2, apart from a change in the colour scale for the occurrence frequency P .
92.5 5.3 -13 93 5.1 -23 93.5 4.6 -34 94 3.8 -48 94.5 2.8 -71 95 1.6 -44 95.5 1.8 75 96 3.1 53 96.5 4.0 33 97 4.7 19 97.5 5.2 8 u.t. r -0.8 -0.4 0 0.4 0.8 (N-T) -0.8 -0.4 0 0.4 0.8 (T-V) P (%) 0 2 4 6 8 10 12 14
Fig. 4. Solar rotation histograms of ρ(N − T ) and ρ(T − V ) in the
same format of Fig. 2, apart from a change in the colour scale for the occurrence frequency P .
time resolution (with respect to protons), not adequate to an hourly-scale correlation analysis. On the other hand, Tu and Marsch (1994) have shown that the basic results of an analy-sis such as we have performed are not statistically affected by the simplification of representing the solar wind temperature by the proton temperature only.
3 The correlation coefficients
An overview of the correlation coefficients ρ(N −Pt), ρ(Pm -Pk), ρ(B − N ), ρ(B − T ), ρ(N − T ), and ρ(T − V ) for
the time interval from mid-1992 to mid-1997 is given in Figs. 2, 3, and 4, right and left panels, respectively. For each solar rotation (as seen by Ulysses) occurrence frequency histograms have been built for each correlation coefficient. These histograms are plotted as 2-D coloured surface graphs, with horizontal axis for the coefficient value, vertical axis for the time, and colour to indicate the occurrence frequency
P. In each figure a vertical bar on the left indicates the po-lar (black), mid-latitude (gray), and low-latitude (light gray) phases (as in Fig. 1). Time, distance, and latitude are also given along the vertical axis.
Figure 2 clearly indicates that a positive correlation for
ρ(N −Pt) (left panel) and a negative one for ρ(Pm-Pk) (right
panel) is a robust feature of the observed compressive fluc-tuations. Regarding ρ(N − Pt), the correlation is especially
strong in the polar regions (black left bar) at small heliocen-tric distance (see red spots). In mid-latitude regions (gray left bar) the correlation weakens, while it almost disappears at low latitudes (light gray left bar near the centre of the panel). A slightly different behaviour is observed for ρ(Pm-Pk). In
this case the anticorrelation also remains strong outside the polar regions. For polar wind the anticorrelation appears to be less strong at small distance, just where the ρ(N −Pt)
cor-relation is at its maximum values.
The role played by density and temperature in the anticor-relation between magnetic and thermal pressures is investi-gated in Fig. 3, where the magnetic field magnitude is di-rectly related to the proton density and the proton temper-ature. Regarding the polar regions, a strong B − T anti-correlation is clearly apparent at all distances (right panel). For B − N an anticorrelation tends to emerge when solar distance increases. This means that the magnetic-thermal pressure anticorrelation is mostly due to an anticorrelation of the magnetic field fluctuations with respect to temperature, rather than density, fluctuations (see Bavassano et al., 1996). Outside polar regions the situation appears in part reversed, with a stronger role for the B − N anticorrelation.
Finally, in Fig. 4 solar rotation histograms for ρ(N −
T ) (left) and ρ(T − V ) (right) are shown. For both cases no appreciable correlation is seen in the polar wind at small distance. When the distance increases, however, mild corre-lations (negative for N − T and positive for T − V ) appear. They are observed in the mid-latitude regions, too.
A complementary view of the compressive fluctuation be-haviours and of their changes along the Ulysses’ trajectory has been obtained through scatter plots of some pairs of the correlation coefficients. To this end we have selected eleven intervals, as indicated by short bars and labels on the top of Fig. 1. Each interval has a time length of two solar rotations. The labels P1 to P4 indicate polar wind intervals, while the labels M and E are for mid- and low-latitude intervals, re-spectively (note that the interval E is of one solar rotation only, since the time spent by Ulysses in the low-latitude wind
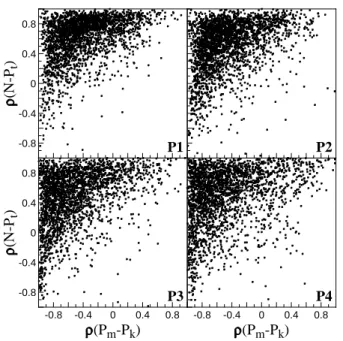
692 B. Bavassano et al.: Compressive fluctuations in high-latitude solar wind -0.8 -0.4 0 0.4 0.8 (N-P t ) P1 P2 -0.8 -0.4 0 0.4 0.8 -0.8 -0.4 0 0.4 0.8 (Pm-Pk) (N-P t ) P3 -0.8 -0.4 0 0.4 0.8 (Pm-Pk) P4
Fig. 5. The four panels show scatter plots of ρ(N − Pt) vs. ρ(Pm
-Pk) for the four polar wind samples (P1 to P4).
during the perihelion phase is not long enough to allow one to select a two-rotation interval). Table 1 gives a list of these intervals and of their ranges in distance r and latitude λ. The intervals have been selected from both Northern and South-ern Hemispheres (with the obvious exception of the equato-rial interval E). For instance, there are two intervals labelled P1, one in the polar wind at north (second row of Table 1) and the other in polar wind at south (first row of Table 1). The intervals P1 correspond to the minimum distance in the po-lar wind, P2 to the maximum latitude, P3 to an intermediate distance (about 3 AU), P4 to the maximum distance. The in-tervals M, in the mid-latitude solar wind, have been selected in such a way as to have a regular pattern of the velocity gra-dients.
Figure 5 shows scatter plots of ρ(N − Pt) versus ρ(Pm -Pk) for the four pairs of polar wind samples (P1 to P4). As
expected from the histograms of Fig. 2, the data points’ dis-tribution is strongly peaked in the upper left corner of each panel, where a positive N − Pt correlation is associated with
a negative correlation between magnetic and thermal pres-sures. This result is very similar to that obtained by Marsch and Tu (1993) for ecliptic fast wind. From Fig. 5 it is also clearly seen that the distribution tends to spread when mov-ing from P1 to P4 samples. This seems to be a quite regular trend, not appreciably affected by excursions in latitude (see sample P2, with data from the highest latitudes). Thus, such a trend probably is a radial distance effect (distance increases from P1 to P4).
In Fig. 6 scatter plots of ρ(B −N ) vs. ρ(B −T ) are shown for the same samples of Fig. 5. As already noted above, the magnetic field magnitude is negatively correlated with both density and temperature. The B − T anticorrelation appears
-0.8 -0.4 0 0.4 0.8 (B-N) P1 P2 -0.8 -0.4 0 0.4 0.8 -0.8 -0.4 0 0.4 0.8 (B-T) (B-N) P3 -0.8 -0.4 0 0.4 0.8 (B-T) P4
Fig. 6. Scatter plots of ρ(B − N ) vs. ρ(B − T ) for polar wind
samples P1 to P4.
Table 1. Times (year, day, hour), distances (r, a.u.), and latitudes
(λ, degrees) for the selected data intervals.
label time r λ P1 94 328 21 – 95 015 12 1.79 – 1.48 62.8S – 35.4S P1 95 094 00 – 95 145 14 1.36 – 1.58 23.6N – 58.0N P2 94 228 14 – 94 284 19 2.49 – 2.09 77.9S – 77.1S P2 95 183 16 – 95 241 00 1.82 – 2.22 75.0N – 76.6N P3 94 124 21 – 94 176 06 3.16 – 2.84 62.3S – 69.8S P3 95 331 23 – 96 018 00 2.84 – 3.16 58.7N – 50.8N P4 93 264 00 – 93 314 20 4.28 – 4.06 39.6S – 43.7S P4 96 179 04 – 96 230 00 4.00 – 4.22 33.1N – 28.8N M 92 245 00 – 92 295 19 5.27 – 5.20 16.3S – 18.9S M 96 275 22 – 96 326 18 4.40 – 4.58 25.3N – 21.8N E 95 046 09 – 95 072 00 1.37 – 1.34 13.7S – 06.4N
dominant at small distance (P1), while at large distance (P4) the B − N anticorrelation becomes equally important. Thus, while at small distance the magnetic-thermal pressure anti-correlation is mainly due to an antianti-correlation between mag-netic field and temperature fluctuations, at large distance den-sity fluctuations also become significant in that respect.
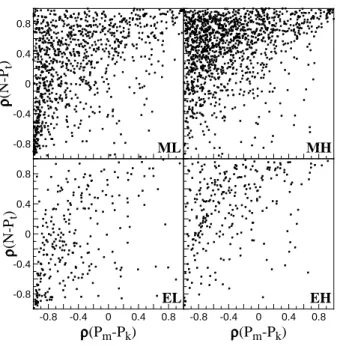
As a term of comparison for the results given in Figs. 5 and 6, Figs. 7 and 8 show the corresponding scatter plots for mid-latitude (M) and low-mid-latitude, or equatorial, (E) samples. The results are given separately for low (L) and high (H) wind speed, in the left and right panels, respectively. The choice of the speed limit between slow and fast wind has been done on the basis of the frequency distributions of speed for the in-vestigated samples. For the ρ(N − Pt) vs. ρ(Pm-Pk) scatter
-0.8 -0.4 0 0.4 0.8 (N-P t ) ML MH -0.8 -0.4 0 0.4 0.8 -0.8 -0.4 0 0.4 0.8 (Pm-Pk) (N-P t ) EL -0.8 -0.4 0 0.4 0.8 (Pm-Pk) EH
Fig. 7. Scatter plots of ρ(N − Pt) vs. ρ(Pm-Pk) for mid- and low-latitude samples M and E, separately for low (L) and high (H) speed wind.
plots (Fig. 7) a dependence on speed is clearly apparent. The results for fast wind (MH and EH panels) are similar to those for polar wind. Slow wind results are characterized by an increasing number of cases with a negative ρ(N − Pt)
coef-ficient. This difference between fast and slow wind results is similar to that found by Marsch and Tu (1993) in the ecliptic. Regarding the ρ(B − N ) vs. ρ(B − T ) plots for the mid-and low-latitude samples (Fig. 8), a dependence on latitude and wind speed is not easily seen in the data. Both correlation coefficients tend to be negative, but with distributions that are less peaked than those found for polar wind samples (Fig. 6).
4 The fluctuation amplitudes
In order to understand the nature of the observed fluctua-tions it is important to investigate, in addition to their corre-lation properties, their behaviours in terms of amplitude. Re-sults discussed in the present section refer to the polar wind phases.
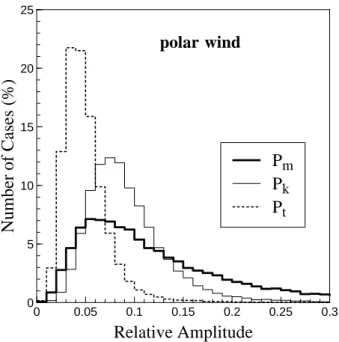
Figure 9 shows frequency distributions of the amplitudes of magnetic (Pm, thick line), thermal (Pk, thin line), and total
(Pt, dashed line) pressure fluctuations. The amplitudes are
given in relative value, namely normalized to the mean of the examined parameter on each hourly interval. The total pres-sure fluctuations appear to be considerably smaller than their thermal and magnetic terms, suggesting a polar wind com-pressive state dominated by pressure-balanced fluctuations. It is worth noting that the Pmhistogram has, as compared to
that of Pk, a smaller peak value but a more pronounced
high-value tail. This last feature is also present in distributions nor-malized for their standard deviations and peak values. Such
-0.8 -0.4 0 0.4 0.8 (B-N) ML MH -0.8 -0.4 0 0.4 0.8 -0.8 -0.4 0 0.4 0.8 (B-T) (B-N) EL -0.8 -0.4 0 0.4 0.8 (B-T) EH
Fig. 8. Scatter plots of ρ(B − N ) vs. ρ(B − T ) for mid- and
low-latitude samples M and E, separately for low (L) and high (H) speed wind.
behaviour could be reminiscent of differences between mag-netic field and plasma parameters in the intermittent charac-ter of the fluctuations. For instance, Bruno et al. (2003) have shown that the magnetic field fluctuations are more intermit-tent than those of the solar wind velocity.
The relationship between the amplitudes of thermal and magnetic pressure fluctuations is shown by Fig. 10, where scatter plots of their relative values are given for polar wind samples P1 to P4. A positive correlation between the ampli-tudes emerges in all samples. Figure 10 also indicates that the fluctuation amplitudes are at a sizeable level for all sam-ples (corresponding to different distances and latitudes in po-lar wind, see Table 1). It is worth noting that this also holds for the other parameters used in our analysis, as shown by the scatter plots of Figs. 11 (for B and T ) and 12 (for N and
Pt). All this allows one to conclude that the computed
cor-relation coefficients are robust quantities and the decline of a correlation cannot simply be ascribed to the decline of the fluctuation amplitudes. Only for velocity fluctuations (not shown) one should be cautious. They are often quite small, with relative amplitudes roughly around 1%, and instrumen-tal uncertainties surely have important effects. However, ve-locity fluctuations do not significantly contribute to our con-clusions.
In Fig. 12 scatter plots of total pressure vs. density fluc-tuations are used to test a model by Tu and Marsch (1994), based on the hypothesis that the compressive fluctuations ob-served in solar wind are mainly due to a mixture of pressure-balanced structures (PBS) and fast magnetosonic waves (W). Waves only can contribute to total pressure fluctuations, while both waves and pressure-balanced structures may con-tribute to density fluctuations. A tunable parameter in the
694 B. Bavassano et al.: Compressive fluctuations in high-latitude solar wind 0 0.05 0.1 0.15 0.2 0.25 0.3 0 5 10 15 20 25
Relative Amplitude
Number
of
Cases
(%)
P
mP
kP
tpolar wind
Fig. 9. Frequency distributions of the relative amplitudes for
mag-netic (Pm, thick line), thermal (Pk, thin line), and total (Pt, dashed
line) pressure fluctuations in polar wind.
model is the relative PBS/W contribution to density fluctua-tions (α). Straight lines in Fig. 12 indicate the model predic-tions for different values of α. It is easily seen that for all po-lar wind samples the great majority of experimental data fall in the α > 1 region. Thus, pressure-balanced structures ap-pear to play a major role with respect to magnetosonic waves. This is a feature already observed by Helios in the ecliptic wind (Tu and Marsch, 1994), although in a less pronounced way. A comparison between the different panels of Fig. 12 indicates that in moving from P1 to P4 the observed distribu-tion tends to shift towards higher values of α (i.e. pressure-balanced structures become increasingly important), proba-bly a radial distance effect.
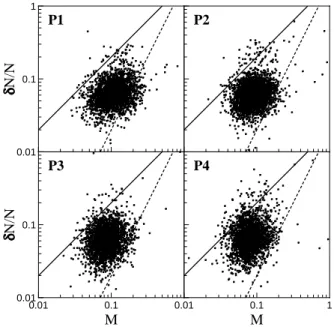
Finally, in Fig. 13 we examine how the relative den-sity fluctuations depends on the turbulent Mach number M (the ratio between velocity fluctuation amplitude and sound speed). This is done with the aim of looking for the pres-ence, in the observed fluctuations, of nearly incompressible (NI) MHD behaviours. In fact, in the framework of the NI theory (e.g. Zank and Matthaeus, 1991, 1993) two differ-ent scalings for the relative density fluctuations are possi-ble, as M or as M2, depending on the role that thermal con-duction effects may play in the plasma under study (namely a heat-fluctuation-dominated or a heat-fluctuation-modified behaviour, respectively). These scalings are shown in Fig. 13 as a solid (for M) and a dashed (for M2) line.
It is clearly seen that for all the polar wind samples no clear trend emerges in the data. Thus, NI-MHD effects do not seem to play a relevant role in driving the polar wind fluctuations. This confirms previous results on the ecliptic by Helios in the inner heliosphere (Bavassano and Bruno, 1995) and by Voyagers in the outer heliosphere (Matthaeus
et al., 1991). It is worth noting that, apart from the lack of NI trends, the experimental data from the Ulysses, Voyagers, and Helios missions in all cases exhibit quite similar distribu-tions. In other words, for different heliospheric regions, solar wind regimes, and solar activity conditions, the behaviour of the compressive fluctuations in terms of relative density fluc-tuations and turbulent Mach numbers seems almost to be an invariant feature.
5 Discussion and conclusion
Plasma and magnetic field data of the Ulysses mission have been used to investigate the nature of the hourly-scale com-pressive fluctuations in the high-latitude (or, polar) solar wind. The nearly homogeneous environment offered by such a kind of flow has allowed one to investigate how the com-pressive fluctuations behave under almost undisturbed condi-tions. We based our analysis mainly on the evaluation of the correlation existing between the fluctuations of solar wind parameters, such as velocity, density, temperature, magnetic field magnitude, and pressures (magnetic, thermal, and to-tal). However, the fluctuations’ behaviour in terms of am-plitude has also been examined, and comparisons with the predictions of existing models have been performed.
A clear outcome of the present study is that of a strong anticorrelation between thermal and magnetic pressure fluc-tuations. In other words, a state close to a pressure balance between the kinetic and magnetic terms appears to be a ma-jor feature of the polar wind plasma. This extends previ-ous findings at larger scales by McComas et al. (1995, 1996) and Reisenfeld et al. (1999). By a comparison between the
ρ(B − N )and ρ(B − T ) coefficients it turns out that this balanced state is predominantly maintained by temperature, rather than density, fluctuations (especially at small solar dis-tances). This role for the temperature was already observed by Marsch and Tu (1993) in the fast streams of the eclip-tic solar wind. They also noeclip-ticed that, in contrast, for the slow wind both temperature and density fluctuations were contributing to the pressure equilibrium (see also Vellante and Lazarus, 1987). A speculation could be that in the polar wind, where a large-scale velocity pattern is almost absent and the compression/rarefaction effects are quite weak, the pressure-balanced state is almost completely related to ther-mal and magnetic features of the source region of the wind (see also Bavassano et al., 1996). In this regard it should be mentioned that the solar wind extension of polar plumes has been suggested to lead to pressure-balanced structures (Reisenfeld et al., 1999). On the other hand, the significant presence of these structures at the scales typically dominated by Alfv´enic fluctuations (e.g. Bavassano et al., 2000a, b) ex-tends to the polar wind the indication given by observations on the ecliptic (Marsch and Tu, 1993) about a connection be-tween the degree of Alfv´enicity and of pressure balance.
An important clue to understand the nature of the observed fluctuations is given by the kind of correlation existing be-tween density and total pressure fluctuations. Positive values
0.01 0.1 1 Pk /Pk P1 P2 0.01 0.1 0.01 0.1 Pm/Pm Pk /P k P3 0.01 0.1 1 Pm/Pm P4
Fig. 10. Scatter plots of the relative amplitudes of thermal vs.
mag-netic pressure fluctuations for polar wind samples P1 to P4.
0.01 0.1 1 T/T P1 P2 0.01 0.1 0.01 0.1 B/B T/T P3 0.01 0.1 1 B/B P4
Fig. 11. Scatter plots of the relative amplitudes of temperature vs.
magnetic field magnitude fluctuations for polar wind samples P1 to P4.
may result from the presence of magnetosonic waves, fast or slow, depending on the sign (positive or negative, respec-tively) of the Pm−Pkcorrelation (see discussion by Marsch
and Tu, 1993). On the other hand, PBS-type fluctuations should not give any N − Pt correlation. Our results (see
the ρ(N − Pt) vs. ρ(Pm-Pk) scatter plots of Fig. 5) are very
similar to those of Marsch and Tu (1993) for fast ecliptic wind (see their Fig. 11), with the majority of points falling in the area of slow-mode and PBS-type correlations. To
al-0.01 0.1 1 Pt /Pt P1 P2 0.01 0.1 0.01 0.1 N/N Pt /Pt P3 0.01 0.1 1 N/N P4 0 1 2 4 8
Fig. 12. Scatter plots of the relative amplitudes of total pressure vs.
density fluctuations for polar wind samples P1 to P4. Straight lines indicate the Tu and Marsch (1994) model predictions for different values of α, the relative PBS/W contribution to density fluctuations.
0.01 0.1 1 N/N P1 P2 0.01 0.1 0.01 0.1 M N/N P3 0.01 0.1 1 M P4
Fig. 13. Relative amplitude of density fluctuations versus turbulent
Mach number for polar wind samples P1 to P4. Solid and dashed
lines indicate the M and M2scalings, respectively.
low for the existence of slow waves, that should be heavily Landau damped (e.g. Barnes, 1979), Marsch and Tu (1993) suggested that slow waves might have a chance to survive for propagation directions almost perpendicular to the magnetic field (since the wave speed becomes very low and the ion distributions are flat at small speeds). A second possibility is that the wave speed falls within a positive slope interval of ion velocity distributions with ion-beam components, a fre-quently observed feature in the solar wind.
696 B. Bavassano et al.: Compressive fluctuations in high-latitude solar wind A further point to be underlined is that the behaviour
(Fig. 12) of the total pressure versus density fluctuations, in terms of relative amplitudes, strongly indicates that polar ob-servations agree quite well with a model by Tu and Marsch (1994), based on a mixture of pressure-balanced structures and magnetosonic waves. The PBS contribution is strong and becomes more and more important as the solar distance increases.
A test to search for nearly-incompressible effects has been done (Fig. 13), with the conclusion that such phenomenology does not seem to have a relevant role in driving polar wind fluctuations.
Finally, Ulysses results in polar wind do not exhibit strong differences with those (always by Ulysses) in fast wind at mid and low latitudes. The same holds in comparison to the Helios observations within fast flows on the ecliptic inside 1 AU.
In summary, our conclusions about compressive fluctua-tions in the polar wind do not appear as a break with respect to previous observations in the ecliptic wind. However, our study clearly indicates that, in a homogeneous environment, as the polar wind, the pressure-balanced fluctuations tend to play a major role.
Acknowledgements. The use of data of the solar wind plasma ana-lyzer (principal investigator D. J. McComas, Southwest Research Institute, San Antonio, Texas, USA) and of the magnetometers (principal investigator A. Balogh, Imperial College, London, UK) aboard the Ulysses spacecraft is gratefully acknowledged. The data have been made available by the World Data Center A for Rock-ets and Satellites (NASA/GSFC, Greenbelt, Maryland, USA). The present work has been supported by the Italian Space Agency (ASI). Topical Editor R. Forsyth thanks two referees for their help in evaluating this paper.
References
Balogh, A., Beek, T. J., Forsyth, R. J., Hedgecock, P. C., Mar-quedant, R. J., Smith, E. J., Southwood, D. J., and Tsurutani, B. T.: The magnetic field investigation on the Ulysses mission: Instrumentation and preliminary scientific results, Astron. Astro-phys. Suppl., 92, 221–236, 1992.
Bame, S. J., McComas, D. J., Barraclough, B. L., Phillips, J. L., Sofaly, K. J., Chavez, J. C., Goldstein, B. E., and Sakurai, R. K.: The Ulysses solar wind plasma experiment, Astron. Astrophys. Suppl., 92, 237–265, 1992.
Barnes, A.: Hydromagnetic waves and turbulence in the solar wind, in: Solar System Plasma Physics, Vol. I, edited by Parker, E. N., Kennel, C. F., and Lanzerotti, L. J., North-Holland, Amsterdam, pp. 249–319, 1979.
Bavassano, B. and Bruno, R.: Density fluctuations and turbulent Mach numbers in the inner solar wind, J. Geophys. Res., 100, 9475–9480, 1995.
Bavassano, B., Bruno, R., and Rosenbauer, H.: Compressive fluc-tuations in the solar wind and their polytropic index, Ann. Geo-physicae, 14, 510–517, 1996.
Bavassano, B., Pietropaolo, E., and Bruno, R.: Alfv´enic turbulence in the polar wind: a statistical study on cross helicity and residual energy variations, J. Geophys. Res., 105, 12 697–12 704, 2000a. Bavassano, B., Pietropaolo, E., and Bruno, R.: On the evolution of outward and inward Alfv´enic fluctuations in the polar wind, J. Geophys. Res., 105, 15 959–15 964, 2000b.
Bruno, R., Carbone, V., Sorriso-Valvo, L., and Bavassano,
B.: Radial evolution of solar wind intermittency in the
inner heliosphere, J. Geophys. Res., 108 (A3), 1130,
doi:10.1029/2002JA009615, 2003.
Goldstein, B. E., Smith, E. J., Balogh, A., Horbury, T. S., Goldstein, M. L., and Roberts, D. A.: Properties of magnetohydrodynamic turbulence in the solar wind as observed by Ulysses at high heli-ographic latitudes, Geophys. Res. Lett., 22, 3393–3396, 1995. Marsch, E. and Tu, C.-Y.: Correlations between the fluctuations
of pressure, density, temperature and magnetic field in the solar wind, Ann. Geophysicae, 11, 659–677, 1993.
Matthaeus, W. H., Klein, L. W., Ghosh, S., and Brown, M. R.: Nearly incompressible magnetohydrodynamics, pseudosound, and solar wind fluctuations, J. Geophys. Res., 96, 5421–5435, 1991.
McComas, D. J., Barraclough, B. L., Gosling, J. T., Hammond, C. M., Phillips, J. L., Neugebauer, M., Balogh, A., and Forsyth, R. J.: Structures in the polar solar wind: plasma and field observa-tions from Ulysses, J. Geophys. Res., 100, 19 893–19 902, 1995. McComas, D. J., Hoogeveen, G. W., Gosling, J. T., Phillips, J. L., Neugebauer, M., Balogh, A., and Forsyth, R. J.: Ulysses ob-servations of pressure-balance structures in the polar solar wind, Astron. Astrophys., 316, 368–373, 1996.
McComas, D. J., Elliot, H. A., Gosling, J. T., Reisenfeld, D. B., Skoug, R. M., Goldstein, B. E., Neugebauer, M., and Balogh, A.: Ulysses’ second fast-latitude scan: Complexity near solar maximum and the reformation of polar coronal holes, Geophys. Res. Lett., 29 (9), 10.1029/2001GL014164, 2002.
Neugebauer, M., Goldstein, B. E., McComas, D. J., Suess, S. T., and Balogh, A.: Ulysses observations of microstreams in the solar wind from coronal holes, J. Geophys. Res., 100, 23 389–23 395, 1995.
Reisenfeld, D. B., McComas, D. J., and Steinberg, J. T.: Evidence of a solar origin for pressure balance structures in the high-latitude solar wind, Geophys. Res. Lett., 26, 1805–1808, 1999. Smith, E. J., Balogh, A., Neugebauer, M., and McComas, D. J.:
Ulysses observations of Alfv´en waves in the southern and north-ern solar hemispheres, Geophys. Res. Lett., 22, 3381–3384, 1995.
Tu, C.-Y. and Marsch, E.: On the nature of compressive fluctuations in the solar wind, J. Geophys. Res., 99, 21 481–2 509, 1994. Tu, C.-Y. and Marsch, E.: MHD structures, waves and turbulence in
the solar wind: Observations and theories, Space Sci. Rev., 73, 1–210, 1995.
Vellante, M. and Lazarus, A. J.: An analysis of solar wind fluctu-ations between 1 and 10 AU, J. Geophys. Res., 92, 9893–9900, 1987.
Zank, G. P. and Matthaeus, W. H.: The equations of nearly incom-pressible fluids. I: Hydrodynamics, turbulence, and waves, Phys. Fluids A, 3, 69–82, 1991.
Zank, G. P. and Matthaeus, W. H.: Nearly incompressible fluids. II: Magnetohydrodynamics, turbulence, and waves, Phys. Fluids A, 5, 257–273, 1993.