HAL Id: hal-00304642
https://hal.archives-ouvertes.fr/hal-00304642
Submitted on 1 Jan 2001
HAL is a multi-disciplinary open access archive for the deposit and dissemination of sci-entific research documents, whether they are pub-lished or not. The documents may come from teaching and research institutions in France or abroad, or from public or private research centers.
L’archive ouverte pluridisciplinaire HAL, est destinée au dépôt et à la diffusion de documents scientifiques de niveau recherche, publiés ou non, émanant des établissements d’enseignement et de recherche français ou étrangers, des laboratoires publics ou privés.
measurement of net seepage in a patterned mire in
north Scotland
H. A. P. Ingram, A. M. Coupar, O. M. Bragg
To cite this version:
H. A. P. Ingram, A. M. Coupar, O. M. Bragg. Theory and practice of hydrostatic lysimeters for direct measurement of net seepage in a patterned mire in north Scotland. Hydrology and Earth System Sciences Discussions, European Geosciences Union, 2001, 5 (4), pp.693-709. �hal-00304642�
Theory and practice of hydrostatic lysimeters for direct
measurement of net seepage in a patterned mire in north Scotland
H.A.P. Ingram
1, A.M. Coupar
2and O.M. Bragg
11Department of Geography, University of Dundee, Dundee DD1 4HN, U.K.
2Scottish Natural Heritage, Fraser Darling House, 9 Culduthel Road, Inverness IV2 4AG, U.K.
E-mail address for corresponding author: [email protected]
Abstract
A novel design of lysimeter for use in mires (peatlands) with shallow water tables is described. It employs an hydraulic mechanism for the automatic equilibration of soil moisture distribution between the outside and the inside of the lysimeter tank but uses no electronic components or electrical power; and it can be installed with minimal disturbance in surfaces with poor load-bearing capacity. The system was deployed on a mire in northern Scotland to investigate the distribution of shallow seepage associated with catenary arrays of different types of surface (microtopes). During the three-year period 15 November 1988 to 19 November 1991, the fraction of rainfall dispersed as seepage was 52% in a pool system; 62% in ridge-furrow microtopography; and 59-67% in unpatterned sloping mire. The data provide preliminary confirmation of the hypothesis of K. E. Ivanov that different microtopes within the same mire differ in their hydrological norms; and suggest that the range of ecohydrological differences at the study site may be similar to those obtained by Ivanov in western Siberia. Details of lysimeter design, construction, installation and operation are appended together with a discussion of the theory of the lysimeter.
Key-words: acrotelm, blanket mire, ecohydrology, evapotranspiration, pool system, valleyside flowe, water balance
Introduction
Mires are terrestrial ecosystems where moribund vegetation or peat derived from it forms a substrate for plants; and where this substrate is at least seasonally waterlogged because the water table lies at or near the surface. In a mire the shallow water table excludes air and is the prime cause of peat accumulation under the anoxic conditions that result. It is also the main ecological characteristic that determines the assemblage of organisms to be found there: the vegetation differs markedly from the communities of dry soils nearby especially in the importance of helophytes1. Moreover the development of a mire, the three-dimensional shape of its peat deposit, and the distribution of plants and other organisms within it, are all governed by the manner in which the system accumulates and disposes of water. An understanding of the ecology of mires therefore demands
flux measurements for all the relevant hydrological processes. The water balance, expressing as it does the partitioning of water at the mire surface, is especially significant.
The ecological effects of mire hydrology are not trivial. Ivanov (1953, 1957, 1981) has drawn attention to the arrays of distinctive surface features (microtopes) that form zones on the surfaces of large circumboreal mires, often visible from the air. In north-west Russia and western Siberia these zones are arranged in regular catenary sequences; and similar sequences have been observed elsewhere, for instance in Sweden (Sjörs, 1983). Ivanov (1981) suggests that successive members of a sequence are hydrologically linked; and that each successive microtope, on a flow line between the centre of a mire and its edge, receives and disposes of water in a characteristic fashion within a characteristic water balance.
The patterned blanket mires of northern Scotland show
similar catenary arrays of microtopes (Ingram, 1987). These mires (or “flowes”) are renowned for their size, the richness and diversity of their biota (Lindsay et al., 1988) and for the conflict they have generated between the interests of nature conservation and afforestation (Avery and Leslie, 1990).
Consideration is given here to whether one component of the water balance, namely the local net sub-surface discharge, or the “internal balance of the water supply”, varies across blanket mire as Ivanov (1981) suggests. For this purpose the design and use of a new type of field lysimeter are described, which adjusts automatically to the ambient soil moisture profile, enabling accurate and reliable measurement of discharge over extended periods at remote locations. The effectiveness of this device as a source of ecohydrological data at a Scottish site during 1988-91 is considered and comparisons are made with results from western Siberia.
Methods
PRINCIPLES OF LYSIMETER DESIGN AND OPERATION
A lysimeter is an instrument which measures D, the exchange of soil water or ground water between a sample monolith of soil enclosed in an open-topped container and the unenclosed soil which surrounds it. Provided that the exposed surface and vegetation of the sample are typical of the immediate surroundings, the lysimeter can be used to infer the water exchange of the whole surrounding area of vegetation and soil.
Usually, the water exchange which the instrument measures is a discharge because the input of precipitation to the soil surface exceeds the evapotranspiration from it; but this need not necessarily be so and the assumption of discharge is invalid in soils supplied with ground water by adjacent springs and the like. It is also often supposed that a lysimeter “measures” evapotranspiration (see the definition of a lysimeter employed by Slatyer and McIlroy, 1961). This is equally misleading. In practice evapotranspiration can only be estimated from lysimeter measurements which are used as items in water budgets such as
P – E – D – ∆W – η = 0 (1)
where P = precipitation, D = ground and soil water discharge, ∆W = change in storage (increase reckoned positive), η = error and E = evapotranspiration, which can accordingly only be inferred by difference provided η is known to be small; and where all terms are flux densities, i.e. volumes per unit area per unit time expressed as equivalent depths.
The operation of a lysimeter thus depends on the observer’s ability to measure the flow of water between the sample monolith and the surroundings, which must accordingly be separated by a watertight partition. But the very presence of this partition is liable to cause a mismatch between the soil moisture distributions in monolith and surroundings because it breaks the natural hydraulic continuity of the system. Technically this is the principal challenge to accurate lysimetry. As an instance of its importance it has been repeatedly shown that in mires (Ingram, 1983), as in other wet terrestrial ecological systems (Akopyan, 1966), the rate of evapotranspiration declines as the water table falls. This is one aspect of a more general relationship between evapotranspiration and the availability of moisture in soils of all kinds (Slatyer, 1967) which implies that lysimeters are unlikely to yield useful data unless the vertical distribution of moisture in the enclosed monolith sample matches exactly that in the surrounding soil.
The functioning of the automatic lysimeter is explained in Fig. 1a. The lysimeter is installed in a mire whose water table is close to the vegetated surface during most of the year. The impermeable lysimeter tank surrounds a minimally disturbed sample of the vegetation and upper soil layers called the lysimeter monolith, which drains with internal wells through an orifice in the tank. Without the tank the monolith would drain by seepage mainly through the upper layers of the surrounding soil which are the most permeable part of the profile (Ingram and Bragg, 1984); the internal wells with their perforated liners provide an alternative that by-passes the less permeable deeper layers of peat. The flux of water from the orifice is led through a discharge tube into a nearby satellite pit with permeable walls, but this water is separated from other water in the pit by a discharge bag with flexible, inelastic and impermeable walls. The satellite pit is sited so that both its vegetation and the altitudes of its surface and water table match those of the uninstalled sample.
As shown in Fig. 1a, the arrangement ensures uniformity of hydraulic potential allowing the satellite pit to control the water table in the monolith, which conforms with that of the surroundings if the pit’s position is correctly chosen. Water tables being shallow, inside and outside moisture profiles will be in equilibrium with them; and the installation’s hydrostatic properties ensure that this occurs automatically. The discharge over a time interval collects in the discharge bag and can be measured as the increase in the volume of water it contains. If the local water balance involves recharge of the monolith, the flux in the discharge tube will be reversed and the bag’s content will diminish. Thus recharge (negative discharge) can be measured using exactly the same procedure.
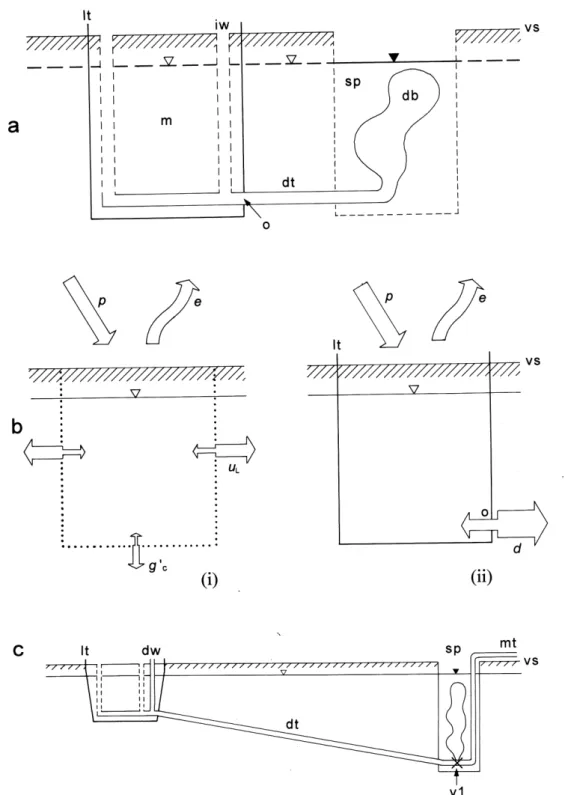
Fig. 1. (a) Principle of the mire lysimeter. The equipment is installed with minimal disturbance to the vegetated surface, vs. The monolith, m, is
contained in a impermeable tank, lt, connected via the orifice, o, and discharge tube, dt, to the flexible discharge bag, db. This occupies the satellite pit, sp, which has permeable walls, and water moves within the monolith through internal wells, iw, with perforated liners. Uniformity of hydraulic potential established through this system ensures that water levels ( , ) in the monolith match those outside the tank, while drainage water is collected in the bag.
(b) Seepage fluxes in the lysimeter monolith, (i) before and (ii) after enclosure in the tank. p : precipitation; e : evapotranspiration; uL : net horizontal discharge through the walls of the monolith before enclosure; g´c : net vertical discharge through the floor of the monolith before enclosure; d : net discharge from the monolith after enclosure. Other labels as for (a).
(c) Diagram of the lysimeter arrangement used in this study. dw: dipwell; v1: valve; mt: measuring tube. Other labels as for (a). The satellite pits were 0.7 × 0.45 m in area and 1.2 m deep: as small as possible to minimise hydraulic and surface discontinuity near the sample but large enough to allow installation of the discharge tube and accommodate the discharge bag. They were dug 3-5 m from the tank to achieve a good match between the vegetation in the tank and at the pit, and to protect the tank and its immediate surroundings from disturbance during data collection.
▼ ∇
The effect of the tank may be understood by comparing the fluxes of water before and after its installation. The initial situation is shown in Fig. 1b(i). Water exchange with the atmosphere occurs as precipitation, p and evapo-transpiration, e. Water may enter or leave the monolith by lateral seepage through its walls; and the resultant flux is represented by a net discharge, uL. Similarly, net vertical seepage is represented as a discharge, g´c. The increase in the amount of water stored in the sample, ∆w, over the period between readings, is then given by the equation:
∆w = p – e – uL – g´c (2) After installation the processes symbolised p, e and ∆w should occur as if the instrument were not present (see Appendix B); but lateral and vertical seepage, being prevented by the walls and floor of the tank, are substituted by exchanges with the discharge bag and measured as (net) lysimeter discharge, d (Fig. 1b(ii)). ∆w is now given by
∆w = p – e – d (3)
and comparing Eqns. 2 and 3 gives
d = uL + g´c (4)
Thus d, the net flux of water from sample to discharge bag, represents the total net discharge from all underground surfaces of the sample; and is equal to the total net discharge from the full depth of the vegetation and peat monolith beneath the sample’s surface in the absence of the instrument (Appendix B).
To allow comparison with other components of the surface water balance (Eqn. 1), lysimeter discharge is converted to the equivalent flux density D:
D = d/a (5)
where a is the surface area of the sample and D has units of equivalent depth, e.g. mm.
LYSIMETER DESIGN AND OPERATION IN PRACTICE
The arrangement that was used in this work is shown in Fig. 1c, and is similar to that described by Coupar (1983). To locate the water table in the tank an unperforated dip well was added to the system of internal drains. A three-way valve was fitted to interrupt the connection between tank and bag, connecting the bag instead to the measuring tube, when required.
During each site visit, the depth of the water table in the dip well (relative to the mire surface) was measured. The contents of the discharge bag were then pumped to the surface through the measuring tube and weighed, and approximately 10 kg of this water returned to the bag before re-connecting the bag to the tank. Net discharge for the period between site visits was calculated by subtracting the weight of water returned to the bag at the end of the previous visit from that pumped out of the bag at the start of the current visit. It was converted to a flux density given in mm day-1 (assuming 1 kg is equivalent to 1 dm3, or 1 litre) by dividing by the surface area of the sample and by the number of days since the last reading.
Details of design, construction, installation and operation of the mire lysimeters, which have now been in use at U.K. sites for more than a decade, are given in Appendix A.
LYSIMETER INSTALLATIONS AT STRATHY BOG
The site (National Grid Reference NC 795558) is located in Strathy Forest, Sutherland, in northern Scotland approximately 3 km north of the Strathy site described by Pearsall (1956). It is a small valleyside flowe (Lindsay et
al., 1988) at 130 m a.s.l. at the confluence of two streams,
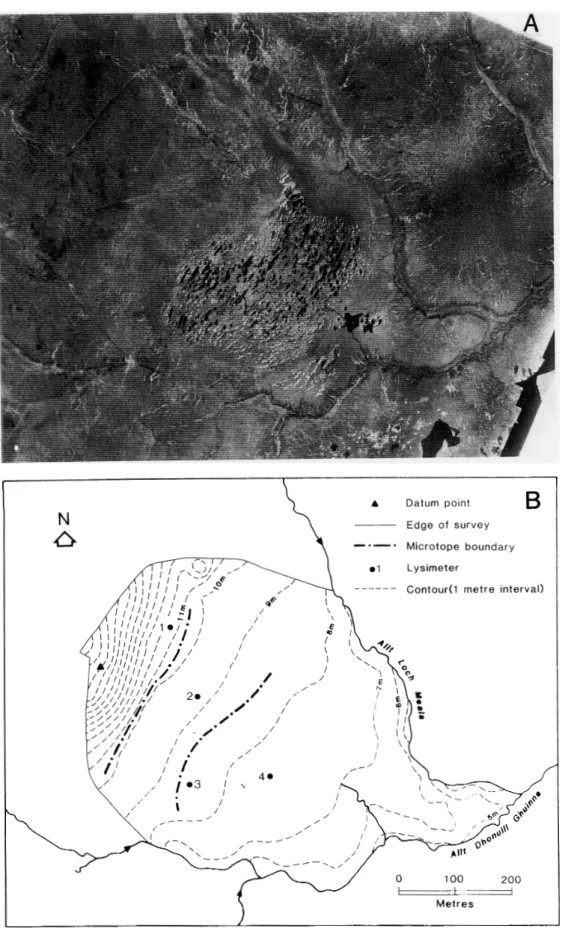
the Allt Dhonuill Ghuinne and the Allt Loch Meala. The peat, of thickness up to 4.8m, forms a flat-topped dome with well developed pool-and-hummock patterning, grading upslope into unpatterned blanket mire. Four principal surface types were distinguished on the basis of ground and air-photograph inspection, and one lysimeter site was selected to represent each of these microtopes (Fig. 2).
Lysimeter 1 was sited on gently sloping blanket mire with
Molinia caerulea, upslope from the patterned area;
Lysimeter 2 was installed in an unpatterned area dominated by Trichophorum cespitosum and Sphagnum tenellum; Lysimeter 3 was placed in a ridge-furrow microtope dominated by Eriophorum angustifolium with Sphagnum
cuspidatum hollows at the edge of the pool system; and
Lysimeter 4 was located near the centre of the pool system. The vegetation within each tank is described in Table 1.
The instruments were installed in August 1987, commissioned in May 1988 and operated until December 1991. Apart from routine changing of discharge bags (Appendix A), only one problem arose in operation of the lysimeters. During a site visit in wet weather in March 1989, the water table in Lysimeter 2 was approximately 10 mm higher than that in its surroundings and water was overflowing from the tank even though the bag was not fully distended. The problem was addressed by applying a collar to raise the rim of the tank (Appendix A).
Fig. 2. (A) air photograph of the Strathy site. (B) Contour map of the Strathy site. Contours derived from theodolite/EDM survey of points at
intersections of a 50 m square grid; contour heights related to an (arbitrary) datum 20 m below ground level at the datum point. Microtope boundaries are approximate.
RAINFALL RECORDS
For consistency with observations at other sites a standard U.K. Meteorological Office storage raingauge, aperture diameter 127 mm exposed 305 mm above ground level, was installed near Lysimeter 1 (Fig. 2b) and read on the same dates as the lysimeters.
Results
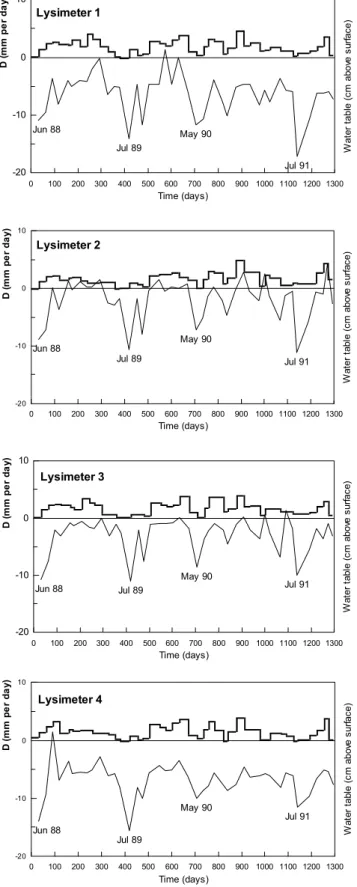
Totals of discharge from each of the four lysimeters were measured over periods ranging from 15 to 52 days between 26 May 1988 and 10 December 1991. Figure 3 shows discharge in mm day-1 for each measurement interval, together with the position of the water table at the time of each reading. Accumulated discharge data from the four lysimeters are compared in Fig. 4.
At the date of the site visit in November each year the
Table 1. Peat depth (measured with a screw auger) and
vegetation at the four Strathy Bog lysimeter sites. Vegetation cover/abundance was recorded on the Domin scale (Kent and Coker, 1992).
Lysimeter no. 1 2 3 4
Peat depth (m) 2.53 4.01 4.79 4.61
SPECIES DOMINSCORE
Calluna vulgaris 5 5 5 4 Erica tetralix 4 4 2 5 Carex panicea 1 Eriophorum angustifolium 4 4 8 3 Eriophorum vaginatum 2 Molinia caerulea 4 Narthecium ossifragum 2 3 3 Trichophorum cespitosum 4 6 3 7 Drosera rotundifolia 1 1 1 Potentilla erecta 2 Racomitrium lanuginosum 3 2 4 Sphagnum capillifolium 6 2 Sphagnum magellanicum 4 Sphagnum papillosum 4 1 3 3 Sphagnum subnitens 3 3 Sphagnum tenellum 8 8 5 Diplophyllum albicans 1 2 Mylia taylorii 2 Odontoschisma sphagni 2 Pleurozia purpurea 2 3 1 Cladonia portentosa 2 1 2 5 Cladonia uncialis 2 2 1 Bare peat 4
Fig. 3. Data collected from lysimeters 1-4 during the period 26 May
1988 to 10 December 1991. For each lysimeter the upper graph shows the mean daily discharge, D, in mm per day during each measurement interval. The lower graph shows the position of the water table in cm above (positive values) or below (negative values) the mire surface at the end of each measurement interval.
0 100 200 300 400 500 600 700 800 900 1000 1100 1200 1300 -20 -10 0 10 Jun 88 Jul 89 May 90 Jul 91 Time (days) D ( m m p e r d a y) W at er t abl e (c m ab ov e su rfac e) Lysimeter 1 0 100 200 300 400 500 600 700 800 900 1000 1100 1200 1300 -20 -10 0 10 Jun 88 Jul 89 May 90 Jul 91 Time (days) D ( m m p e r d a y) W at er t abl e ( cm ab ov e s urfac e) Lysimeter 2 0 100 200 300 400 500 600 700 800 900 1000 1100 1200 1300 -20 -10 0 10 Jun 88 Jul 89 May 90 Jul 91 Time (days) D ( m m p e r d a y) W at er t abl e (c m ab ov e s urf ac e) Lysimeter 3 0 100 200 300 400 500 600 700 800 900 1000 1100 1200 1300 -20 -10 0 10 Jun 88 Jul 89 May 90 Jul 91 Time (days) D ( m m p e r d a y) W at er ta bl e (c m ab ov e su rfa ce ) Lysimeter 4
water table was generally high, indicating that the storage capacity of the mire was full (Fig. 3). On this basis three water years were defined during which the net change in storage was approximately zero. Totals of precipitation and discharge at each of the four lysimeters for each of these
water years are shown in Table 2 together with average daily flux densities. Actual evapotranspiration is also shown for each lysimeter and water year, calculated as the residual term in the water balance derived by substituting ∆W = 0 and ignoring the error term in Eqn. 1.
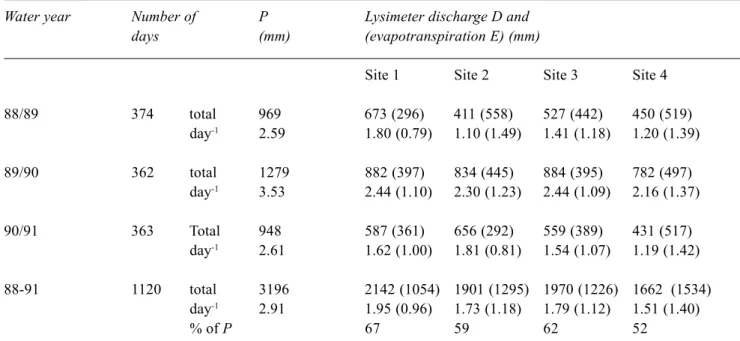
Annual discharges at Sites 1, 3 and 4 were consistently related to one another as follows:
D(1) ≥ D(3) > D(4).
Over the three water years, discharge accounted for 67% of the incident precipitation P at Site 1, 62% of P at Site 3 and 52% of P at Site 4. Annual discharge from Lysimeter 2 was not consistently related to that from the other instruments; its value was the lowest recorded for 1988/1989 and the highest for 1990/1991. Discharge here accounted for 59% of incident precipitation over the three years.
It is noteworthy that the annual evaporative flux was similar in all three years at Lysimeter 3 (1.1 mm day-1) and Lysimeter 4 (1.4 mm day-1), despite the 1989/1990 water year being significantly wetter than the other two years, with correspondingly higher discharge at both sites.
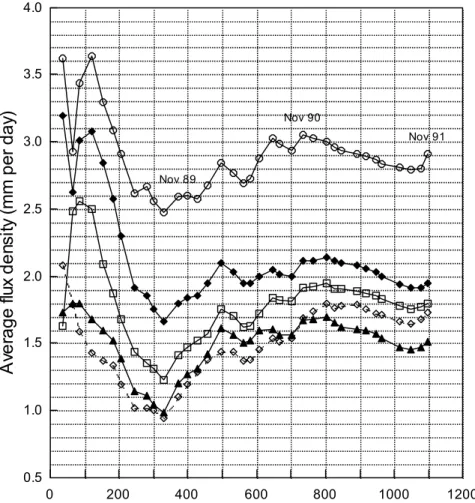
Average daily values of precipitation and seepage for the full three-year period are shown in the second row from the foot of Table 2. Figure 5 shows how this set of mean values developed. The mean of each variable was calculated iteratively from 15 November 1988 by dividing accumulated
Table 2. Strathy Bog: measured precipitation P and discharge D, and calculated evapotranspiration E (= P – D), at lysimeter
sites 1-4, for three individual water years: 15 November 1988 to 24 November 1989 (88/89), 24 November 1989 to 21 November 1990 (89/90) and 21 November 1990 to 19 November 1991 (90/91); and for the period 15 November 1998 to 19 November 1991 (88-91). Data are expressed as totals and as average daily fluxes for each period.
Water year Number of P Lysimeter discharge D and
days (mm) (evapotranspiration E) (mm)
Site 1 Site 2 Site 3 Site 4
88/89 374 total 969 673 (296) 411 (558) 527 (442) 450 (519) day-1 2.59 1.80 (0.79) 1.10 (1.49) 1.41 (1.18) 1.20 (1.39) 89/90 362 total 1279 882 (397) 834 (445) 884 (395) 782 (497) day-1 3.53 2.44 (1.10) 2.30 (1.23) 2.44 (1.09) 2.16 (1.37) 90/91 363 Total 948 587 (361) 656 (292) 559 (389) 431 (517) day-1 2.61 1.62 (1.00) 1.81 (0.81) 1.54 (1.07) 1.19 (1.42) 88-91 1120 total 3196 2142 (1054) 1901 (1295) 1970 (1226) 1662 (1534) day-1 2.91 1.95 (0.96) 1.73 (1.18) 1.79 (1.12) 1.51 (1.40) % of P 67 59 62 52
Fig. 4. Comparison of accumulated discharge from Lysimeters 2, 3
and 4 with that from Lysimeter 1, 26 May 1988 to 10 December 1991. Broken line indicates 1:1.
0 500 1000 1500 2000 2500 0 500 1000 1500 2000 2500
Accumulated discharge from Lysimeter 1 (mm)
A ccu m ul a te d di sc har ge ( m m ) Lysimeter 1 Lysimeter 2 Lysimeter 3 Lysimeter 4
precipitation and net discharge at each lysimeter by the number of days of operation to each reading date. The variation in mean daily values of P and D as the recording period was extended is thus indicated. The fluctuations in mean values of precipitation and discharge had decayed significantly by the third year of recording, but still showed some seasonal variation. Means calculated at the end of the 1988/1989 water year and at the end of the 1989/1990 water year differed by up to 0.6 mm day-1, whereas the changes from November 1990 to November 1991 were in the order of 0.2 mm day-1.
Discussion
LYSIMETER SYSTEM
Adaptating the principle of lysimetry from freely draining soils to mires where drainage is impeded brings new problems but also new opportunities. Since part of the container is always below the water table it must be sealed and cannot be allowed to drain by gravity. Moreover its water content cannot be determined by weighing in situ because the container is partly supported by buoyancy. But the permanent presence of the water table within the tank can be used to control the water level hydrostatically. Conveniently, the water table’s position also indicates storage status, although it cannot be used quantitatively in
Fig. 5. Extending mean daily values of precipitation P and lysimeter discharge D at lysimeters 1–4.
Each point represents the mean daily discharge over the period 15 November 1988 to the date of the current site visit.
0 200 400 600 800 1000 1200 0.5 1.0 1.5 2.0 2.5 3.0 3.5 4.0 Nov 89 Nov 90 Nov 91
Days from 15 November 1988
A
ve
rage
fl
ux
de
ns
ity
(
m
m
per
day
)
water balance calculations without knowing the aquifer yield (specific yield: Gilman, 1994).
Lysimetry has usually been applied in mires to estimate evapotranspiration. Reviews are given by Ingram (1983) and Gilman (1994). Field methods are favoured in order to achieve representative atmospheric conditions, but instruments range widely in size and design. In these applications the tank prevents seepage of water between the sample and its surroundings, allowing the effect of exchanges with the atmosphere to be observed. Disturbance to the soil profile, caused by removing peat and replacing it in a floored vessel, is minimised in designs without floors where the walls are inserted until they penetrate a sparingly permeable layer of well humified peat or clay that seals the base. As used by Heikurainen (1963) and Bay (1966), such devices are strictly evaporimeters or evatranspirometers since they eliminate seepage without measuring it.
Closer approaches to measuring seepage have been achieved through stabilising the water table by adding or draining off measured amounts of water (e.g. Virta, 1966; Bavina, 1967; Romanov, 1968; Boelter, 1972). Here storage changes are eliminated by introducing a surrogate for the quantity of seepage required to maintain the chosen storage status. In other designs, storage is adjusted to mimic its variation in the surrounding mire by adding or removing measured quantities of water to equalise water tables inside and outside the tank. Again a surrogate measure of seepage is obtained, this time showing the amount needed to move the water table through a given distance; thus Eggelsmann (1954) adjusted water levels manually at frequent intervals. All these designs cause water tables inside and outside the tank to differ, at least for some of the time. But Virta (1966) and Wastiaux (2000) have shown that evaporative opportunity (the ratio of actual to potential evapotranspiration) depends on water table depth, so that the water balance given by a sample with an unrepresentative water table will be distorted: the modification of storage regimen making it impossible to estimate either seepage or evapotranspiration accurately. Moreover such a difference in level creates a false hydraulic gradient causing unnatural seepage beneath the walls of a floor-less tank (Bay, 1966; Kelemen, 1996).
Inaccuracy in seepage estimation is least in instruments that mimic ambient water tables, declining as the tank water table is adjusted more frequently. Gilman (1994) described a sophisticated design using electronic monitoring of outside and inside water tables and an electric metering pump to adjust the latter. This system achieved close correspondence between the sample’s water balance and that of the surroundings, and could even be used to follow the time course of seepage through individual days.
The instrument described here also continuously adjusts the water level in the sample, whose water balance thus represents faithfully that of the surroundings. But the adjustment uses the same hydrostatic mechanism that operates in the absence of the instrument and does not rely on batteries or electronic components. Therefore the timing of site visits is not critical and the instrument can continue to integrate water balance fluxes accurately so long as the discharge bag remains functional. The frequency of visits determines the minimum period for which the water balance can be evaluated but, for this study, visits were strictly unnecessary during periods of neutral water balance and the only routine maintenance required was periodic replacement of the discharge bags (see Appendix A: Operation).
HYDROLOGY OF THE STUDY SITE
There were differences in the patterns of discharge measured by individual lysimeters but there was general overall similarity governed by seasonal effects. In particular, discharge was more intense in winter months and when the water table was high (Fig. 3). Comparison of accumulated discharge between instruments (Fig. 4) again indicates differences, but no systematic change, in their relative behaviour during the period of observations. At Lysimeters 3 and 4, the annual water balance was characterised by consistent evapotranspiration (Table 2), with variations in annual precipitation being dispersed by seepage. On the other hand, total evapotranspiration declined systematically from Year 1 to Year 3 at Lysimeter 2, whereas at Lysimeter 1 evapotranspiration was lower in Year 1 than in the subsequent two years. These may be real effects related to previous management of the site. However the flooding of the tank at Lysimeter 2 in wet weather suggests another possibility, namely that the tank was sited slightly down-slope from the satellite pit, raising the water table in the tank and thus accelerating evapotranspiration. Conversely, the lower evapotranspiration at Lysimeter 1 in the first year might have been caused by siting the tank slightly up-slope from the pit. Both instruments indeed sampled the more steeply sloping parts of the mire (Fig. 2b) and, in both, re-adjustment of the water balance appeared to occur during the three years of observations. A small change in behaviour of the water table may have invoked feedback by changing the rates of plant production and decay (the peat-forming process) which would tend to re-position the mire surface to “fit” the new water table regimen; but the period of data collection was too short to test this hypothesis.
It is shown in Appendix B (Eqn. B19) that lysimeter discharge D is directly equivalent to internal water supply
sensu Ivanov (1981), if vertical leakage of water through
the base of the mire is negligible and if D is calculated for periods over which there is no net change in storage. The long-term average value of this quantity is one of the terms required to solve hydromorphological equations, which relate the shape of the mire to its hydrology. Long-term averages of internal water supply did not stabilise during the period of data collection, which was too short to show whether temporal stability is achievable. However if, as Ivanov (1981) suggests, annual evapotranspiration is indeed virtually constant for each microtope, it is conceivable that such long-term averages could be estimated from short-term discharge data in combination with long-term data on precipitation.
The data permit a preliminary comparison between the hydrological attributes of the mire microtopes at Strathy Bog and those of western Siberia. Ivanov (1981) points out that, in domed mires with purely meteoric water supply, the average internal supply can vary between microtopes only due to differences in evapotranspiration. In zones of excess or adequate moisture in western Siberia, observation has shown that the average evapotranspiration varies by only 10-15% between microtopes. At Strathy Bog, mean discharge over three water years ranged from 52% of total precipitation (P) in the pool system on deep peat to 65% of
P on shallow sloping mire, suggesting a similar variation of
evapotranspiration in these Scottish mires.
Although a longer data series would be desirable, this work has already shown that mire lysimeters can provide reliable data on seepage that suggest hydrological similarities between Scottish blanket mires and the ombrogenous mire systems of western Siberia.
Acknowledgments
We thank Fountain Forestry Ltd. for access to the Strathy site; L. Goward and T. Loizou for installing the lysimeters; D. Duncan for collecting most of the data; I. Tennant for technical assistance; J. Ford for his work on the Figures; Ros Wakefield and R.S. Clymo for detailed comment on the manuscript; and R.A. Lindsay for the foresight and encouragement that enabled us to perfect the lysimeter technique. Much of the work was carried out at the Department of Biological Sciences, University of Dundee, and was funded by the Nature Conservancy Council, the Nature Conservancy Council for Scotland and the Commission of the European Communities. Early development work on the lysimeter system was supported by various grants from the UK Natural Environment Research Council from 1970 onwards and an award from the UK Peat Producers’ Association.
References
Akopyan, A.S., 1966. The problem of determining evaporation from the soil surface with the ground-water table at various depths. Soviet Hydrology: Selected Papers (1966, Part 4), 375-382.
Avery, M. and Leslie, R., 1990. Birds and Forestry. Poyser, London.
Bavina, L.G., 1967. Refinement of parameters for calculating evaporation from bogs on the basis of observations at bog stations. Soviet Hydrology: Selected Papers (1967 Part 4), 348-370.
Bay, R.R., 1966. Evaluation of an evapotranspirometer for peat bogs. Water Resour. Res., 2, 437-442.
Boelter, D.H., 1972. Preliminary results of water level control on
small plots in a peat bog. Proceedings of the 4th International
Peat Congress, Helsinki, 3, 347-354.
Coupar, A.M., 1983. Studies on vegetation and blanket mire
hydrology at Rannoch Moor. Ph.D. dissertation, University of
Dundee.
Eggelsmann, R., 1954. Über die Bestimmung der Verdunstung vom bewachsenen Moorboden. In: Festschrift der 100-Jahre
Bauschule in Suderburg, Uelzen, 67-74.
Gilman, K., 1994. Hydrology and Wetland Conservation. Wiley, Chichester, UK.
Heikurainen, L., 1963. On using ground water table fluctuations for measuring evapotranspiration. Acta Forestalia Fennica, 76, (5), 1-16.
Ingram, H.A.P., 1978. Soil layers in mires: function and terminology. J. Soil Sci., 29, 224-227.
Ingram, H.A.P., 1983. Hydrology. In: Mires: Swamps, Bog, Fen
and Moor, A.J.P. Gore, (Ed.) A, General Studies, 67-158.
Elsevier, Amsterdam.
Ingram, H.A.P., 1987. Ecohydrology of Scottish peatlands.
Trans.Roy. Soc. Edinb.- Earth Sci., 78, 287-296.
Ingram, H.A.P. and Bragg, O.M., 1984. The diplotelmic mire: some hydrological consequences reviewed. Proceedings of the
7th International Peat Congress. Irish National Peat Committee
/ International Peat Society, Dublin, 220-234.
Ivanov, K.E., 1953. Gidrologiya bolot [The Hydrology of Mires]. Gidrometeoizdat, Leningrad.
Ivanov, K.E., 1957. Osnovy gidrologii bolot lesnoy zony i raschety
vodnogo rezhima bolotnykh massivov [Elements of the Hydrology of Forest-zone Mires and Calculations Relating to the Water Regimen of Mire Massifs]. Gidrometeoizdat,
Leningrad.
Ivanov, K.E., 1981. Water Movement in Mirelands. Translated by Thomson, A. and Ingram, H.A.P. Academic Press, London. Kelemen, J.C., 1996. Effects of tree encroachment on the water
balance of a Scottish raised mire: a lysimeter study. Ph.D.
dissertation, University of Dundee.
Kelemen, J.C. and Ingram, H.A.P., 1999. The use of large bottomless lysimeters in the determination of water balances for a raised mire. Hydrol. Proc., 13, 101-111.
Kent, M. and Coker, P., 1992. Vegetation Description and Analysis. Belhaven Press, London.
Lindsay, R.A., Charman, D.J., Everingham, F., O’Reilly, R.M., Palmer, M.A., Rowell, T.A. and Stroud, D.A., 1988. The Flow
Country. The Peatlands of Caithness and Sutherland. Nature
Conservancy Council, Peterborough.
Pearsall, W.H., 1956. Two blanket-bogs in Sutherland. J.Ecol., 44, 493-516.
Romanov, V.V., 1968. Evaporation from Bogs in the European
Territory of the U.S.S.R. N. Kaner (translator), Heimann (Ed.).
Rycroft, D.W., Williams, D.J.A. and Ingram, H.A.P., 1975a. The transmission of water through peat. I. Review. J.Ecol., 63, 535-556.
Rycroft, D.W., Williams, D.J.A. and Ingram, H.A.P., 1975b. The transmission of water through peat. II. Field experiments.
J.Ecol., 63, 557-568.
Sjörs, H., 1983. Mires of Sweden. In: Mires: Swamps, Bog, Fen
and Moor, A.J.P. Gore, (Ed.) B, Regional Studies, 69-94.
Elsevier, Amsterdam.
Slatyer, R.O., 1967. Plant-Water Relationships. Academic Press, London.
Slatyer, R.O. and McIlroy, I.C., 1961. Practical Microclimatology. UNESCO, Paris.
Virta, J., 1966. Measurement of evapotranspiration and computation of water budget in treeless peatlands in the natural state. Commentationes Physico-Mathematicae Societas
Scientiarum Fennica, 32, 1-72.
Wastiaux, C., 2000. Facteurs hydrologiques de la dégradation
des tourbières hautes à sphaignes des Hautes-Fagnes
(Belgique). Dissertation, University of Liège.
Appendix A
Mire Lysimeters: Design,
Construction, Installation and
Operation
DESIGN
Successful lysimetry in ombrogenous mires must take account of the poor load-bearing capacity and sensitivity to disturbance of the surface. Equipment should be easily carried and installed, and operated so as to avoid damage to the sample and its surroundings. Moreover conditions at the air-water interface accelerate the disintegration of polymers and corrosion of metals, which releases ions toxic to such characteristic plants as Sphagna; thus the choice of components is limited.
The tank should be of sufficient area to contain a representative sample of the surface microtopography and deep enough to accommodate all living plant roots. Its orifice (o in Fig. 1) should be below the deepest position of the water table to prevent loss of hydraulic continuity in dry weather. Its rim should be high enough to prevent the exchange of water between the sample monolith and its surroundings but should not project so far that it affects the radiation balance or aerodynamics of the surface. Where vascular plants are of low stature, this means that the rim should scarcely project above the Sphagnum surface. A convenient rule-of-thumb suggested by J.L. Monteith (pers. comm. ca. 1970) is that the installation should be scarcely visible. Thus provision must be made to raise the rim as soon as it begins to be covered by new Sphagnum growth which provides a route for capillary water transfer.
The bag must never constrain the flow of water through the hydraulic system during operation of the lysimeter. This means that it must never be allowed either to collapse fully or to become tightly distended. It follows that the size of the bag should be chosen to suit the conditions of the installation and the frequency of observers’ visits.
CONSTRUCTION
1. Tank. The tank was a circular black polypropylene domestic cold-water cistern with an orifice 75 mm above its floor which was fitted with a tank connector. The wall of the tank was vertical for approximately 0.2 m below the rim, but its lower part tapered slightly towards the base (Fig. 1c). The rim could be raised by adding an outer collar made from black neoprene rubber sheeting whose ends were joined with an appropriate solvent-based adhesive. The collar was held in place by a stainless steel hose clip which had been extended by inserting a length of thin stainless steel wire rope, and sealed to the rim of the tank with a silicone-based sealant.
2. Hydraulic System and Satellite Pit. Details are given under Methods and in the legend to Fig. 1c.
3. Discharge Tube. Each discharge tube (dt in Fig. 1c; Fig. A1a, d) consisted of a 5 m length of flexible PVC hose of internal diameter 18 mm (26 mm OD) attached with a stainless steel hose clip to the outer spigot of the tank connector. It was installed so that it sloped uniformly downwards at 15-20% from the tank connector to a point near the base of the satellite pit. Gas entering this part of the system therefore travelled up the discharge tube, escaped through the dip well and could not interrupt the flow of water between tank and bag by forming an air-lock.
4. Discharge Bag. The bag had watertight walls of stout but flexible plastic film. It collapsed flat on being emptied. Gas and water were therefore easily removed and the point of emptiness was unambiguous, provided no folds or blockages formed near the exit. This was ensured by enclosing in the bag a perforated tube (pt in Fig. A1c), linked to the bag connecter, which enabled the bag to be completely drained through the perforations, while spreading the end near the exit and thus preventing it from collapsing unevenly. In use the bag rested in the satellite pit in the position shown in Fig. 1c, with its connector at the lower end. Any gas which collected in the bag migrated to the upper end where its presence was obvious, and helped to keep the
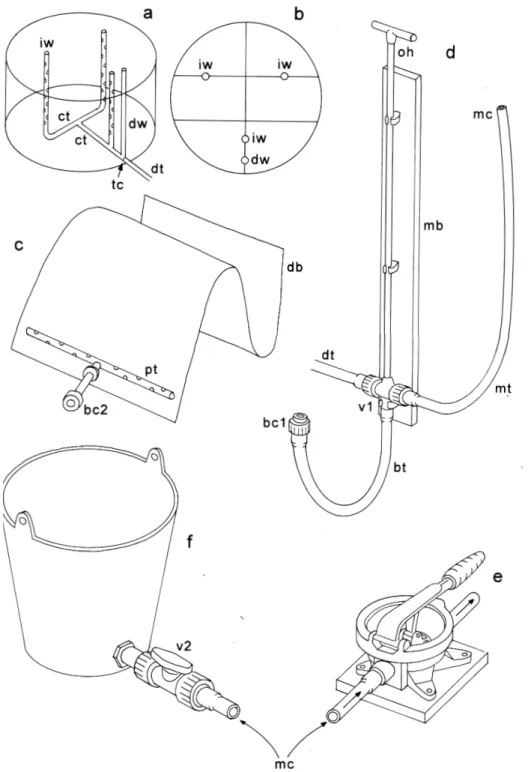
Fig. A1. Components of the lysimeter system in detail, drawn to various scales: (a) sample tank (nominal capacity 500 L / 50 gallons) in
perspective showing internal pipework, with three internal wells, iw, lined with perforated tubes to prevent collapse, and one dip well, dw, with an unperforated liner, all made from rigid uPVC pipe of internal diameter 22 mm and communicating with the orifice through horizontal connecting tubes, ct, of flexible PVC laid near the base of the tank, the tubes connected by push-fit plumber’s uPVC elbow and tee joints to a uPVC tank connector, tc (with a watertight connection at the orifice) to the discharge tube, dt; (b) sample tank in plan with lines indicating division of the soil monolith during installation and positions of vertical tubes, labelled as in (a); (c) disposable discharge bag, db (shown empty, 1.2 m long, ~100 L capacity), made from Grade A polyethylene tubing, with reusable internal perforated tube, pt connected (push fit) to inner end of proximal part of bag connector, bc2, the outer end of which is made by sealing the threaded part of uPVC union to outer end of tank connector forming watertight joint through hole punched in wall of bag, the ends of which are finally heat-sealed with an industrial bag sealer; (d) valve assembly and connections in satellite pit (not shown) with operating handle and shaft, oh, mounting board, mb, 1.2 m long, L-port valve, v1 (commercial product in uPVC mounted near one end of a varnished wooden board, its handle extended with uPVC tubing to permit operation from the mire surface), discharge tube, dt, measuring tube, mt, terminating in measuring connection, mc, bag tube, bt, and outer end of proximal part of bag connector bc1; (e) portable plastic hand-operated diaphragm pump (as used for baling small boats) connected via inflow spigot to measuring tube while discharging contents of bag; (f) recharge bucket (capacity 10 L) fitted with ball valve, v2, to control outflow when connected to measuring tube for recharging bag.
bag in the correct position.
5. Valve Assembly. The bag was connected to the discharge tube through a three-way L-port valve. The discharge tube, measuring tube and bag tube were attached to the three orifices of the valve (Fig. A1d) so that in the operating mode the measuring tube was shut off and the valve connected the discharge tube to the bag, whilst in the measuring mode the valve closed the discharge tube and the bag was connected to the measuring tube. The part of the discharge tube in the satellite pit was made long enough to permit the valve and associated connections to be removed from the pit for inspection and maintenance, after which the free part of the discharge tube was re-positioned carefully in the pit in such a way as to minimise the risk of air-locks. Normally this part of the discharge tube (not shown in Fig. 1c) remained submerged in the pit. The measuring tube terminated in the measuring connection. The outer end of the bag tube was fitted with part of a uPVC union which matched the bag connection, to which it was secured by tightening a threaded collar so that a watertight seal could be made between the two by turning the sleeve only. This arrangement allowed bags to be changed easily under field conditions without the use of tools.
INSTALLATION
1. Choice of Site. Each site comprised two areas with similar vegetation, surface altitude and water table depth, one large enough to accommodate the tank and the other large enough for the satellite pit, within 3 to 5 m of one another. Local surface altitudes were compared2 until two apparently suitable areas were identified. A small dip well was installed in each and checked the next day to ensure that water table depths were indeed similar.
Once the site had been chosen, great care was taken to minimise damage to the mire surface. Instruments were installed in dry summer weather when the water table was likely to be low and the surface relatively firm. Installers always worked from duckboarding, having first covered with stout plastic sheeting any part of the surface on which peat was likely to be dropped or stacked.
2. Excavation of Satellite Pit. The satellite pit was excavated with vertical walls and its contents discarded
off-site. Water and peat slurry were removed from the pit if it flooded during excavation.
3. Excavation of Tank Pit. The tank was placed upside-down on the mire surface in the required final position, and its outer rim used as a template to make a circular incision in the mire surface with a long sharp knife. The tank was then laid aside, and the surface within the circular incision was further cut into six sections to form sods which were as deep as possible, as indicated in Fig. A1b. A small additional turf was removed at the side of the circle closest to the satellite pit to aid extraction of the six large turves. Turves were then cut off at their bases, carefully lifted and placed in order on plastic sheeting. The process was repeated for the next and subsequent layers of peat. The fit of the tank was tested as excavation progressed until it filled the pit snugly with the desired depth of rim protruding. The position of the orifice was then marked on the wall of the excavation nearest the satellite pit.
4. Insertion of Discharge Tube and Tank. A tunnel for the discharge tube was bored without surface disturbance using a Hiller peat-borer inserted as indicated in Fig. A2. The borer was aligned to exit the tank pit at the marked position of the orifice and enter the base of the satellite pit. One end of the discharge tube was then tied to the end of the borer with thin rope, and the borer was gently withdrawn until the upper end of the discharge tube reached the tank pit. After removing the rope and borer a watertight connection was made between the discharge tube and the tank connector. The discharge tube was then pulled back into the satellite pit whilst the tank was lowered into position in the tank pit. The last peat to be removed from the tank pit was replaced in the base of the tank, filling it up to the level of the orifice.
5. Installation of Drainage System. The system of drainage tubes and dip well was then assembled inside the tank (Fig. A1a), and the turves replaced in order around this. For some installations it was necessary to trim the penultimate layer of turves in order to achieve equality of levels between the re-assembled surface inside the tank and the surrounding area.
6. Flushing and Equilibration. Clear water was poured gently over the surface of the sample to flush out the discharge tube. The free end of the discharge tube was then covered with gauze cloth and suspended in the centre of the satellite pit, and the pit was allowed to re-fill with water.
7. Valve Board and Bag. Once the satellite pit contained water (usually by the next day, but commissioning could be delayed by several months if required), a watertight
2 Levelling was accomplished with a hydrostatic level comprising a 5-m
length of flexible tubing communicating with a water-filled reservoir at one end; the reservoir and the free end of the tubing both being open to the atmosphere. Some of the water in the reservoir was used to flush air from the system, after which the water levels in the reservoir and the free end of the tubing provided an indication of the same altitude that could be carried round the site.
connection was made between the discharge tube and the appropriate port of the three-way valve, the bag was attached and the valve assembly and bag were placed in the satellite pit so that the valve handle and measuring tube protruded at the mire surface (Fig. A3). A known amount of water (10 L approx.) was added to the bag using the recharge bucket3 before turning the valve to the operating position. The bag was then lifted until the water level inside it could be seen to be falling, thus confirming that there was free communication between bag and tank.
8. Ancillary Equipment. Duckboarding of two kinds was used during operation. A fixed duckboard, large enough for an observer to make measurements in comfort from it, was placed beside the satellite pit on the side opposite the tank. Narrow portable duckboarding was stored on this between visits, as was a light wooden frame for weighing buckets of water (Fig. A3).
OPERATION
During site visits (at 7 to 14 day intervals), some equipment3 was carried by the operator, and used at each of the installations in turn. It was important to minimise disturbance4.
First the depth of the water table below the rim of the dip
well was measured and the L-port valve (v1) switched to the measuring position. The wooden frame was erected on the fixed duckboard and the balance was suspended from it, tared to the weight of the empty measuring bucket, then used to measure the contents of the discharge bag5. When this result had been recorded a known weight of water was returned to the bag6. The L-port valve (v1) was switched back to the operating position, then the discharge bag was gently lifted in the satellite pit and checked for leaks whilst carrying out the procedure for clearing the discharge tube described above7.
The bag was always vulnerable to accidental puncture, but experience showed that the seal and connection at its lower end also suffered wear and tear in use. It proved possible to avoid nearly all “emergency” bag replacements (with associated loss of accuracy) by replacing the bag as a matter of routine at intervals of 2-3 months8.
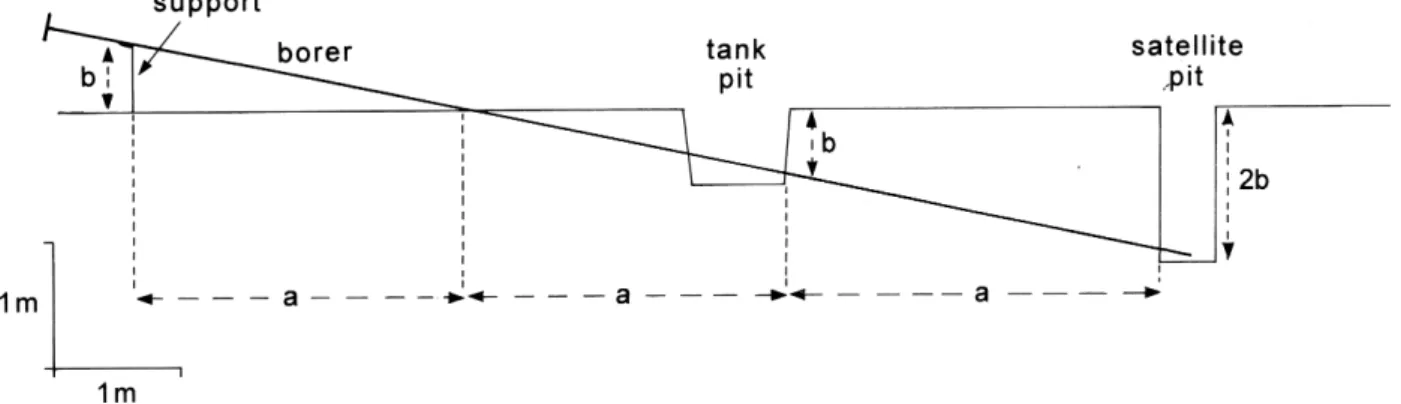
Fig. A2. Method for boring tunnel to accommodate the discharge tube. The distance, a, between tank pit and satellite pit, and the depth, b, of
the orifice below the ground surface with the tank at its final level were measured. A support was arranged at distance 2a from the orifice, on the straight line joining the centres of tank and satellite pits, at height b. A Hiller peat borer was supported at this point and its boring end inserted at an angle into the ground halfway between support and orifice. It was then pushed through the peat until it emerged first in the tank pit, where it could be guided to the exact position required for the orifice, then near the base of the satellite pit.
3 Including a flexible 2 m steel rule; two 10 L buckets, one with a valved
outlet (recharge bucket: Fig. A1f) and one unmodified; a pump (Fig. A1e); a spring balance with 10 kg capacity, readable to 50g so that weights could be estimated to the nearest 10g; and at least one spare discharge bag assembly.
4 The fixed duckboard was approached by a route chosen to avoid the
vicinity of the tank. Before any operations which might disturb local water levels, the portable duckboards were laid out to form a temporary path to the tank. After recording the water table they were stacked beside the fixed duckboard until the remainder of the reading procedure was completed.
5 The water in the bag was pumped to the surface, one bucketful at a time,
and weighed. A known weight was transferred to the recharge bucket and retained, and the remainder was returned to the pit (outside the bag).
6 The pump was disconnected from the measuring tube, the recharge bucket
was connected in its place and the ball valve (v2) was opened so that the bucket’s contents ran back into the bag. Any water remaining in the bucket was weighed.
7 If a leak was discovered at this stage, the bag was returned to the pit,
disconnected from the tank by operating the L-port valve, and its contents pumped out again. The valve assembly and empty bag were then lifted out of the satellite pit, the bag was disconnected by unscrewing the union collar (Fig. A1d: bc1) and a new bag substituted. Bag and valve assembly were then returned to the pit and a further known quantity of water added to the bag from the recharge bucket. The bag was then re-connected to the tank and the procedure for clearing the discharge tube repeated.
8 When necessary, a routine bag change was carried out as part of the
reading procedure, after disconnecting the measuring tube from the pump and before connecting it to the recharge bucket.
Appendix B
Theory of Mire Lysimeters
An intact mire comprises two structural layers with contrasting biological, physical and hydrological attributes: the acrotelm which contains the water table under all normal conditions, and the catotelm which is perennially waterlogged (Ingram 1978). We now consider how the discharge measured by the lysimeters may be interpreted in terms of this special soil structure.
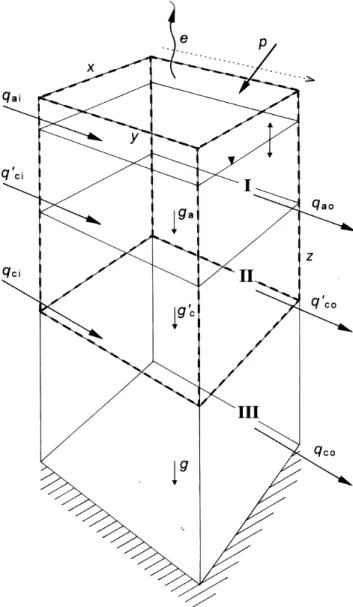
Figure B1 represents the whole monolith of peat directly beneath the sample surface before insertion of a lysimeter tank which, for clarity, is taken to be rectangular in plan. The proposed position of the tank, with sides x, y and depth
z, is indicated by superposed broken lines. Since the tank
must be deep enough to accommodate the full expected range of water table fluctuations (Appendix A), the sample includes the full depth of the acrotelm plus the uppermost part of the catotelm. Thus, the monolith can be divided into three compartments, namely (I) the acrotelm, (II) the part of the catotelm within the tank, and (III) the part of the catotelm beneath the tank.
The following assumptions are made: 1. Angle of slope is sensibly zero.
2. Flow-lines are parallel, so that no flow takes place across the y-face of the monolith.
3. Flux densities across the x-face are uniform over the section to which they apply9.
4. All storage, w, of a temporary kind likely to affect water balance computations occurs in Compartment I. In terms of the fluxes defined in Fig. B1, the principle of continuity enables a water balance to be written for each compartment. Thus, for compartment I :
Fig. A3. Photograph of a newly established lysimeter installation showing uniformity of vegetation inside and outside the
tank (right foreground), position of satellite pit marked by almost-vertical valve board and handle (right centre) with permanent duckboard at its farther side. The items lying on the permanent duckboard were one section of portable duckboard, used by observers approaching the tank; and a wooden frame which could be secured in an upright position by pushing its feet between the slats of the permanent duckboard, from which the spring balance used to weigh buckets of water was suspended. A bamboo cane with a brightly-coloured “flag” (left centre) assisted location from a distance.
9 This is essentially a simplifying assumption. In the catotelm, its
application can be taken to imply that the hydraulic conductivity is sensibly uniform throughout the sample monolith. However, its application to the acrotelm where hydraulic conductivity varies dramatically and
systematically with depth implies merely that the values of Qi and Qo are
to be considered as averages which express this layer’s contribution to the long-term water balance. For relevant considerations, see Ivanov (1981).
p + qai – qao – e – ga – ∆w = 0 (B1) for compartment II :
ga + q´ci – q´co – g´c = 0 (B2) for compartment III :
g´c + qci – qco – g = 0 (B3)
When the tank is in place, all fluxes which formerly passed through the vertical faces and base of the sample are diverted to the orifice and contribute to lysimeter discharge, d.
For efficient operation, three conditions must be fulfilled by the sample, namely
(i) its vegetated surface must intercept precipitation as if the tank were not present;
(ii) its vegetated surface must evaporate and transpire as if the tank were not present;
(iii) the water stored in its acrotelm must vary as if the tank were not present.
Conditions (i) and (ii) are met by installing the lysimeter so that the rim of the vessel does not affect the aerodynamics or heat balance of the surface and the vegetation inside and outside the sample area remains undisturbed, and condition (ii) is further met by choosing the vessel so that root activity is not constrained by it (see Appendix A). Condition (iii) is met by installing the tank so as not to disturb acrotelm stratigraphy (see Appendix A) and by the system of flexible discharge bag and satellite pit inherent in the design (see Methods).
If the lysimeter is operating efficiently in the manner prescribed above its water balance can be written
p – e – d – ∆w = 0 (B4)
and can be equated to the water balances of compartments I and II, obtained by adding Eqns. B1 and B2:
p + qai – qao – e + q´ci – q´co – g´c – ∆w = 0 (B5) Subtracting Eqn. B4 from Eqn. B5 we obtain
qai – qao + q´ci – q´co – g´c + d = 0 (B6) From Eqn. B3
g´c = qco – qci + g (B7)
Substituting in Eqn. B6 and re-arranging:
d = (qao – qai) + (q´co – q´ci) + (qco – qci) + g (B8) from which it becomes clear that lysimeter discharge, d, is the algebraic sum of all the below-ground fluxes in compartments I, II and III of the monolith.
Fig. B1. Definition diagram for analysis of lysimeter theory. It
represents a rectangular soil monolith extending from the surface to the substrate (hatching). The broken arrow above the monolith and parallel to the y-face represents a flow line. The water table (of variable altitude) is denoted ▼. The lysimeter tank is marked by a
thick broken line. It spans the acrotelm I and the upper part II of the catotelm, the lower part of which is labelled III. Single-pointed solid arrows labelled with lower case italic symbols denote fluxes of water.
Substituting
ua = qao – qai (B9)
uc = (qco + q´co) – (qci + q´ci) (B10) where ua , uc represent net discharge from the acrotelm and the catotelm respectively, Eqn. B8 becomes:
d = ua + uc + g (B11)
Reference to Fig. B1 and Eqns. B1–B3 shows that Eqn. B11 may also be written:
d = ua + ga (B12)
Converting fluxes to flux densities10, we divide throughout by xy, the area of the sample’s surface, when Eqn. B11 and Eqn. B12 become:
D = Ua + Ga = Ua + Uc + G (B13) Thus, net discharge from the acrotelm alone is given by:
Ua = D – Ga (B14)
whilst that for the catotelm is:
Uc = Ga – G (B15)
and U, the lateral discharge from the entire peat profile, is:
U = Ua + Uc = D – G (B16)
Ga and G can be determined from Darcy’s law11. Implications include the following:
i. It follows from Eqn. B13 that lysimeter discharge, D, is directly related to the quantity referred to by Ivanov (1981) as the internal balance of the water supply of a
mire massif at a given point, I 12. In the notation adopted here,
I = P – E – G (B17)
Dividing Eqn. B4 by xy yields
D = P – E – ∆W (B18)
Subtracting Eqn. B17 from Eqn. B18,
D = I + G – ∆W (B19)
From Eqn. B16
D = U + G (B20)
Then, comparing Eqn. B20 with Eqn. B19,
U = I – ∆W (B21)
Thus, the term U is directly equivalent to I for the entire peat profile (acrotelm plus catotelm) if measured over an interval during which there is no net change in storage (∆W = 0).
ii. Lysimeter discharge should indicate directly the lateral net discharge U which is the mire’s local contribution to streamflow at the system margins, provided the floor of the deposit is impermeable (G = 0 : Eqn. B16). iii. Eqn. B14 shows that it may be possible to derive
discharge from the acrotelm, Ua, using data from a lysimeter of this design in conjunction with shallow (and therefore technically straightforward) measurements of hydraulic conductivity and hydraulic potential. Alternatively, this quantity could be measured directly using a lysimeter with a bottomless tank (e.g. Kelemen 1996; Kelemen and Ingram 1999) of depth equal to that of the acrotelm, since the vertical flux ga would not be directed to the orifice of such an instrument. The difficulty with either of these approaches is uncertainty in the exact position of the acrotelm/catotelm boundary. iv. Subject to the same uncertainty as iii., catotelm discharge, Uc, may be estimated from hydraulic conductivity and hydraulic gradient data alone (Eqn. B15).
10 All flux densities are computed as fluxes per unit area of mire surface
and are denoted by upper case italic symbols, e.g. P, where P = p/xy, all fluxes and other quantities being represented by lower case italic symbols.
11 For the (vertical) hydraulic conductivity k one would require a seepage
tube (Rycroft et al. 1975a, b) with cavity of zero length situated at the
acrotelm/catotelm boundary (for Ga) or just above the base of the catotelm
(for G); and, for the (vertical component) of hydraulic gradient ∆h, pairs
of piezometers would be required, with their orifices separated by a known
depth ∆z and close to the levels in question. Ga and G are then obtained
using Ga, G = - k ∆h/∆z.
If ∆h = 0 at the lower level, an impermeable base would be indicated
beneath the peat deposit.
12 For uniformity of notation I is substituted here for the quantity denoted
ps by Ivanov (1981 pp. 106 sqq.). The sign convention used here for the
term G differs from that of Ivanov in that, in considering ombrogenous systems, the term G is regarded as leakage and this is indicated as a negative term in the water balance; whereas in his more general treatment of mires
with and without groundwater influence, Ivanov regards pgr as a source