HAL Id: hal-00664835
https://hal-brgm.archives-ouvertes.fr/hal-00664835
Submitted on 31 Jan 2012
HAL is a multi-disciplinary open access archive for the deposit and dissemination of sci-entific research documents, whether they are pub-lished or not. The documents may come from teaching and research institutions in France or abroad, or from public or private research centers.
L’archive ouverte pluridisciplinaire HAL, est destinée au dépôt et à la diffusion de documents scientifiques de niveau recherche, publiés ou non, émanant des établissements d’enseignement et de recherche français ou étrangers, des laboratoires publics ou privés.
Modeling diffusion of an alkaline plume in a clay barrier
Eric C. Gaucher, Philippe Blanc, Jean-Michel Matray, Nicolas Michau
To cite this version:
Eric C. Gaucher, Philippe Blanc, Jean-Michel Matray, Nicolas Michau. Modeling diffusion of an alkaline plume in a clay barrier. Applied Geochemistry, Elsevier, 2004, 19 (10), pp.1505-1515. �10.1016/j.apgeochem.2004.03.007�. �hal-00664835�
E.C. Gaucher et al. (2004) personal edition
MODELING DIFFUSION OF AN ALKALINE PLUME IN A CLAY
BARRIER
Eric C. Gaucher
1,*, Philippe Blanc
2, Jean-Michel Matray
3,4, Nicolas Michau
51
BRGM - F45060 Orléans Cedex 2 – e-mail: e.gaucher@brgm.fr.
2
BRGM - F45060 Orléans Cedex 2 – e-mail: p.blanc@brgm.fr.
3
ANTEA - F45061 Orléans Cedex 2. 4 present address: IRSN - F92262 Fontenay-aux-roses Cedex – e-mail: jean-michel.matray@irsn.fr
5
ANDRA – 92298 Châtenay-Malabry Cedex – e-mail: Nicolas.Michau@andra.fr * - author to whom correspondence should be addressed.
Abstract-The design of clay plugs used for sealing access galleries to a radioactive waste repository built
with concrete structures in a deep clayey formation must take into consideration their chemical evolution over time. Diffusion of an alkaline plume from concrete into bentonite was therefore modeled over a 100,000-year period with the PHREEQC geochemical code in order to determine, as a function of time, modifications to mineral surfaces, dissolution of existing minerals and precipitation of new mineral phases. The modeled system consisted of an OPC (Ordinary Portland Cement) barrier, a MX80 bentonite clay barrier and the corresponding equilibrated pore waters. A specific database including aqueous complexes, mineral-phase solubilities and ion-exchange parameters for Na+, K+, Ca2+, Mg2+ and H+ for an MX80 bentonite was created. Only the mineral phases capable of precipitating in this system were considered in the model. The width of the clay barrier was taken as 8 m. Simulations were carried out at 25 °C and 1 bar. Transport modeling was based on a one-dimensional diffusion model, assuming thermodynamic equilibrium. Constant dissolved concentrations were assumed for the concrete pore fluid. The clay barrier was modeled as a semi-infinite medium with a single diffusion coefficient of 10-11 m2/s. The simulation revealed a sequence of mineralogical transformations after 100,000 years. From the host clayey rock to the concrete, the transformations begin with ion exchange reactions changing Na-montmorillonite into a more potassic and calcic phase. Then illitization of the Na-montmorillonite occurs. Between the illitized zone and the concrete interface, zeolite phases are precipitated. Finally, cement phases replace zeolites at the concrete interface. The cementation of the concrete interface leads to a large increase in the total clay volume whereas illitization of montmorillonite produces a decrease in this volume. The sensitivity of the calculations to exchange reactions and the diffusion coefficient was tested. Calculations were done linking and not linking the cation exchange capacity to the amount of montmorillonite in order to evaluate the influence of the exchange reactions. This produced only very minor differences, indicating a limited influence of exchange reactions in the mineralogical evolution. Simulations for sensitivity to the value of the diffusion coefficient enabled us to develop a phenomenological law indicating that the extent of the mineral transformations is proportional to the square root of the diffusion time and the diffusion coefficient. The simulations also demonstrate the efficiency of pH buffering by a mineralogical assemblage that controls the CO2 partial pressure.
Keywords- Clay barrier, alkaline plume, concrete, diffusion, modeling
INTRODUCTION
The French agency for radioactive waste management (ANDRA) is constructing an underground research laboratory at a depth of about 500 m in the Callovian-Oxfordian Formation of the eastern Paris Basin in the
Meuse and Haute-Marne Departments (ANDRA, 1999; Gaucher et al, 2004). The purpose of this laboratory is to study the feasibility of deep storage of radioactive waste using the current concept of multiple barriers: the waste itself, the waste container surrounded by backfill, and the geosphere.
E.C. Gaucher et al. (2004) personal edition Concrete will be used extensively in this
design both to build the repository chambers and as waste containment material. The large excavated concrete chambers that will hold the containers of radioactive waste will be separated from the repository access galleries by bentonite plugs several meters thick. The volume of concrete is likely to be much greater than that of the bentonite plugs. After being sealed, the repository will become saturated with interstitial waters from the Callovian-Oxfordian Formation, which will produce high-pH solutions through interaction with the concrete. The aggressiveness of these alkaline solutions, when in contact with the bentonite, could possibly weaken the bentonite’s confinement properties with respect to long-lived radionuclides. The dominant transport mechanism in these relatively impermeable formations is assumed to be diffusion (Lehikoinen et al., 1996). The aim of this study was to determine the critical processes affecting the pore water, the minerals and the clay-mineral surfaces of a bentonite plug during the diffusion of an alkaline plume. The calculations were carried out in two steps: re-equilibration of the system after saturation of the dry bentonite barrier with the interstitial pore water from the Callovian-Oxfordian Formation, and diffusion of the alkaline plume from the concrete through the bentonite plug. Calculations were done for a simulated period of 100,000 years, at 25 °C and 1bar, using PHREEQC (version 2), a code well-suited to coupled chemistry-diffusion modeling (Parkhurst and Appelo, 1999). The reader should keep in mind that this type of calculation is more a tool to understand and assess the impact of the perturbation than an entirely realistic model. The limitations comes from (i) uncertainties on thermodynamic data for clays, zeolites and cement phases, (ii) the fact that it is difficult to take into account the chemical evolution of concrete over long periods and (iii) impossible to take into account the heterogeneous transport behavior in the clay barrier, and (iv) the absence of kinetic data for all of the phases considered (dissolution and precipitation). Concerning this last point, we chose to consider only the thermodynamic equilibrium. The low diffusion coefficients in the clayey media are conducive to a favorable context in which equilibrium should be reached if sufficient time is considered. This work contributes to current international
efforts on this subject (for example, Savage
and Rochelle (1993), Braney et al. (1993), Steefel and Lichtner (1994), Adler et al.
(1999), Bateman et al. (1999), Savage et al. (2002), and Soler (2003)).
1. THERMODYNAMIC DATABASE A thermodynamic database for aqueous species and mineral solubility products adapted to this problem was prepared in PHREEQC format using the llnl.dat database (Wolery, 1992). To maintain internal consistency in the database, and because of the scarcity of other such constants in the literature, we used the hydrolysis constant given for a pure montmorillonite (Na0.33
Mg0.33 Al1.67 Si4 O10 (OH)2). Except for Fe,
this formula is similar to that of Lehikoinen et
al. (1997). Some phases were added to the
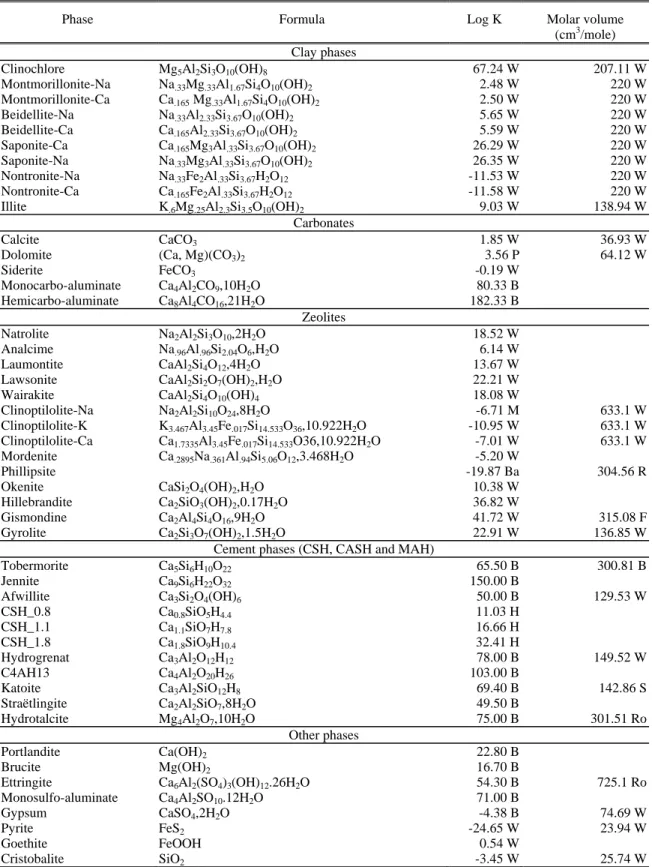
database to account for the possible precipitation of cement phases close to the interface. Most of the composition and solubility products were taken from Bourbon (2003), who has done a critical review of all of the thermodynamic data available for these minerals. The thermodynamic data for cement phases, clays and zeolites are, however, scarce and uncertain. Our results give only general trends. They do not take into account the precipitation of gels and ill-defined phases that may persist over long periods.
The database was completed when the volume of a given phase was not in the Wolery (1992) database (Table 1). The ion-exchange constants for Na+/Ca2+, Na+/Mg2+, Na+/K+ and Na+/H+ (Table 2) were recalculated to conform to the formalism of Gaines and
Thomas (1953) using the values provided by Fletcher and Sposito (1989). Due to a total
absence of data for CaOH+ and MgOH+, these species were not considered in the exchange reactions, even though their role is probably significant in the waters modeled.
E.C. Gaucher et al. (2004) personal edition
Table 1 Thermodynamic constants of the mineral phases
Phase Formula Log K Molar volume
(cm3/mole) Clay phases Clinochlore Mg5Al2Si3O10(OH)8 67.24 W 207.11 W Montmorillonite-Na Na.33Mg.33Al1.67Si4O10(OH)2 2.48 W 220 W Montmorillonite-Ca Ca.165 Mg.33Al1.67Si4O10(OH)2 2.50 W 220 W Beidellite-Na Na.33Al2.33Si3.67O10(OH)2 5.65 W 220 W Beidellite-Ca Ca.165Al2.33Si3.67O10(OH)2 5.59 W 220 W Saponite-Ca Ca.165Mg3Al.33Si3.67O10(OH)2 26.29 W 220 W Saponite-Na Na.33Mg3Al.33Si3.67O10(OH)2 26.35 W 220 W Nontronite-Na Na.33Fe2Al.33Si3.67H2O12 -11.53 W 220 W Nontronite-Ca Ca.165Fe2Al.33Si3.67H2O12 -11.58 W 220 W Illite K.6Mg.25Al2.3Si3.5O10(OH)2 9.03 W 138.94 W Carbonates Calcite CaCO3 1.85 W 36.93 W
Dolomite (Ca, Mg)(CO3)2 3.56 P 64.12 W
Siderite FeCO3 -0.19 W Monocarbo-aluminate Ca4Al2CO9,10H2O 80.33 B Hemicarbo-aluminate Ca8Al4CO16,21H2O 182.33 B Zeolites Natrolite Na2Al2Si3O10,2H2O 18.52 W Analcime Na.96Al.96Si2.04O6,H2O 6.14 W Laumontite CaAl2Si4O12,4H2O 13.67 W
Lawsonite CaAl2Si2O7(OH)2,H2O 22.21 W
Wairakite CaAl2Si4O10(OH)4 18.08 W
Clinoptilolite-Na Na2Al2Si10O24,8H2O -6.71 M 633.1 W
Clinoptilolite-K K3.467Al3.45Fe.017Si14.533O36,10.922H2O -10.95 W 633.1 W
Clinoptilolite-Ca Ca1.7335Al3.45Fe.017Si14.533O36,10.922H2O -7.01 W 633.1 W
Mordenite Ca.2895Na.361Al.94Si5.06O12,3.468H2O -5.20 W
Phillipsite -19.87 Ba 304.56 R
Okenite CaSi2O4(OH)2,H2O 10.38 W
Hillebrandite Ca2SiO3(OH)2,0.17H2O 36.82 W
Gismondine Ca2Al4Si4O16,9H2O 41.72 W 315.08 F
Gyrolite Ca2Si3O7(OH)2,1.5H2O 22.91 W 136.85 W
Cement phases (CSH, CASH and MAH)
Tobermorite Ca5Si6H10O22 65.50 B 300.81 B Jennite Ca9Si6H22O32 150.00 B Afwillite Ca3Si2O4(OH)6 50.00 B 129.53 W CSH_0.8 Ca0.8SiO5H4.4 11.03 H CSH_1.1 Ca1.1SiO7H7.8 16.66 H CSH_1.8 Ca1.8SiO9H10.4 32.41 H Hydrogrenat Ca3Al2O12H12 78.00 B 149.52 W C4AH13 Ca4Al2O20H26 103.00 B Katoite Ca3Al2SiO12H8 69.40 B 142.86 S Straëtlingite Ca2Al2SiO7,8H2O 49.50 B Hydrotalcite Mg4Al2O7,10H2O 75.00 B 301.51 Ro Other phases Portlandite Ca(OH)2 22.80 B Brucite Mg(OH)2 16.70 B
Ettringite Ca6Al2(SO4)3(OH)12.26H2O 54.30 B 725.1 Ro
Monosulfo-aluminate Ca4Al2SO10.12H2O 71.00 B
Gypsum CaSO4,2H2O -4.38 B 74.69 W
Pyrite FeS2 -24.65 W 23.94 W
Goethite FeOOH 0.54 W
Cristobalite SiO2 -3.45 W 25.74 W
B, Bourbon [2003]; Ba, Ball and Nordstrom [1991]; F, Fischer [1963]; H, Hatches [2000]; M Murphy and Pabalan [1994]; R, Rinaldi et al. [1974]; Ro, Roberts et al. [1990]; S, Sacerdoti and Passaglia [1985]; W, Wolery [1995]
E.C. Gaucher et al. (2004) personal edition
Table 2 Exchange constants (log K 25°C) for Wyoming montmorillonite
Na/K 0.255 Na/H 0.1003 Na/Ca 0.687 Na/Mg 0.687
2. DESCRIPTION OF THE INITIAL SYSTEM
The first system simulated was a dry MX80-type compacted clay, equilibrated with interstitial water from the Callovian-Oxfordian Formation, in contact with an Ordinary Portland Cement (OPC) barrier. Input data taken from the literature were converted, where appropriate, to a molal scale using a dry density of 1.8 g/cm3. The bentonite used in the model was a Wyoming montmorillonite commercially designated MX80. The properties of this clay were taken from Lehikoinen et al. (1997) (Table 3). These authors give a cation exchange capacity (CEC) value of 81 meq per 100 g of dry clay for MX80, with the proportions of exchangeable cations being: Na: 80.6%, K: 1.4%, Ca: 12.9%, Mg: 5%.
The Cl concentrations in the Callovian-Oxfordian interstitial water were obtained by squeezing a core sample (ANDRA, 1999). Other elements were calculated assuming equilibrium with the bentonite minerals (Table 3) and with the surface of the montmorillonite. Adler et al. (1999) demonstrated the importance of the partial pressure of CO2 for another clay pore water
system. This parameter is set free in all calculations, implying that the mineral buffering will be strong enough to avoid fixing it a priori. The buffering capacity of mineral assemblages with calcite, dolomite and a Mg-aluminosilicate was demonstrated in
Coudrain-Ribstein et al. (1998).
The chemical composition of the concrete water (Table 4), taken from Bourbon (2003), corresponds to the pore water of moderately evolved concrete. It has a pH of 12.5 and the calcium concentration indicates a control by portlandite Ca(OH)2. Sulfate and dissolved
silica concentrations are given by the equilibrium with ettringite and CSH phases, respectively.
Table 3 Mineralogical composition of the MX80 clay.
Mineral Structural formula weight %
montmorillonite (Si4.00)(Al1.67
Mg0.33)O10(OH)2N a0.33 75.0 cristobalite SiO2 10.0 calcite CaCO3 1.4 gypsum CaSO4:2H2O 0.6 pyrite FeS2 1.6 10 -4 Other minerals: feldspars, micas, ... 13.0
The mineralogical and chemical evolution of the concrete was not taken into consideration in this study because 1) it is not well documented over long periods of time, and 2) the huge volume of concrete compared to that of bentonite in the planned repository allowed us to consider the concrete medium to be infinite. We know, however, that the chemistry of the concrete will evolve with time (see, for example, Berner, 1992). Using a solution with a pH 12.5, which represents a “moderately evolved” concrete pore water, was consistent with the approximation of an infinite concrete medium, 12.5 being a mean value between that of young evolved water (pH > 13) characterizing the first stages of concrete evolution, and pore water from aged concrete (pH < 11) characterizing long-term reaction (Bateman et al., 1999).
Table 4 Chemical composition (mol/kgw) adopted for the concrete pore water
pH 12.50 pE -8.6 Na (mol/kgw) 8.02 10 -3 K (mol/kgw) 2.21 10 -2 Ca (mol/kgw) 2.19 10 -2 Si (mol/kgw) 3.01 10-5 S (mol/kgw) 1.20 10 -4
E.C. Gaucher et al. (2004) personal edition
3. SIMULATION OF THE RE-SATURATION PHASE
The time required for the barrier to become re-saturated with groundwater was not taken into consideration because water/rock equilibrium calculations using PHREEQC can only start when the barrier is water saturated. We simulated equilibration of the pore water of the host formation with the minerals of the MX80 bentonite and the exchange sites of the montmorillonite. The composition of the pore water in the host formation was taken from
Gaucher et al. (2002). Some of the bentonite
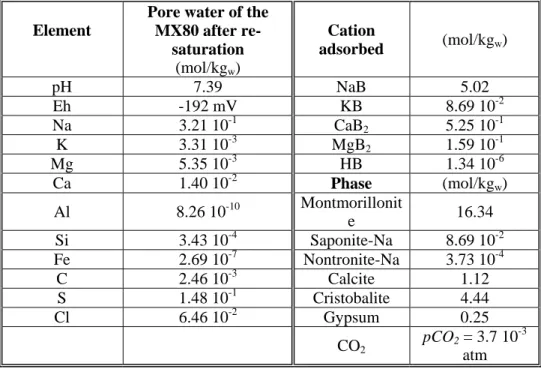
minerals (feldspars, micas) were considered to be non-reactive. The results of the simulation are given in Table 5.
The major changes in the MX80 bentonite system are related to partial dissolution of gypsum and equilibration of the carbonate system. Equilibration of the exchanger causes changes in the concentrations of the alkali and alkaline-earth cations, both in the solution and at the surface of the exchanger. Only a very small amount of pyrite is assumed to be initially present since quantification of this phase remains uncertain even though it has been observed in MX80. An interesting feature was the precipitation of a small amount of smectite that was different from the original Montmorillonite, i.e., Na-Nontronite (ferric smectite) and Na-Saponite (magnesian smectite). These new phases are necessary to perform a complete assemblage in equilibrium with the solution.
Table 5 Results of the re-saturation phase simulation
Element
Pore water of the MX80 after re-saturation (mol/kgw) Cation adsorbed (mol/kgw) pH 7.39 NaB 5.02 Eh -192 mV KB 8.69 10-2 Na 3.21 10-1 CaB2 5.25 10 -1 K 3.31 10-3 MgB2 1.59 10 -1 Mg 5.35 10-3 HB 1.34 10-6 Ca 1.40 10-2 Phase (mol/kgw) Al 8.26 10-10 Montmorillonit e 16.34 Si 3.43 10-4 Saponite-Na 8.69 10-2 Fe 2.69 10-7 Nontronite-Na 3.73 10-4 C 2.46 10-3 Calcite 1.12 S 1.48 10-1 Cristobalite 4.44 Cl 6.46 10-2 Gypsum 0.25 CO2 pCO2 = 3.7 10 -3 atm
4. SIMULATION OF THE ALKALINE PLUME
When simulating the alkaline plume, the transport of solutes into the clay barrier was considered to be a pure diffusion process in a saturated medium with interconnected porosity. The PHREEQC code, however, models one-dimensional transport and allows us to use only one effective diffusion coefficient. Despite the fact that it has been experimentally demonstrated that each aqueous species has its own diffusion
coefficient, writing the conservation equations in terms of total concentration is possible only when the diffusion coefficients for all species are the same (Steefel and Lichtner, 1994). Therefore, a single diffusion coefficient with a value of 10-11 m2/s was selected based on published data for compacted MX80 (Lehikoinen et al. 1996). Diffusion was assumed to be homogeneous throughout the barrier, although researchers have recently observed in the Mol underground rock laboratory that some intact islets of rock were preserved near the clay/concrete interface. The
E.C. Gaucher et al. (2004) personal edition mineralogical impact of diffusion is, in fact,
heterogeneous (de Cannière, 2003).
The boundary conditions were those of a semi-infinite medium for the clay barrier, and constant fixed fluid concentrations in the concrete. The barrier was first modeled with a grid of eighty 0.1-m cells for the clay and one 0.1-m cell for the concrete. Because mineralogical transformations occur close to the concrete/clay interface, this grid was then modified in the following way: one 0.1-m cell for the concrete, then ten 0.025-m cells, ten 0.05-m cells and finally seventy-five 0.1-m cells. This enabled a more precise description of mineralogical evolution near the interface. The simulation covered a period of 100,000 years in 10,000-year steps.
The simulation allows not only the original minerals in the barrier to precipitate or dissolve, but also the 47 mineral species in table 1, once their saturation indexes have been reached.
We chose not to take kinetic dissolution or precipitation of the mineral phases into account. Because our calculations concerned a very long period of diffusion (10,000 to 100,000 years), we assumed that the impact of kinetic phenomena was minimized. Moreover, a lot of kinetic data are missing for the minerals considered in this study.
5. RESULTS OF THE SIMULATION
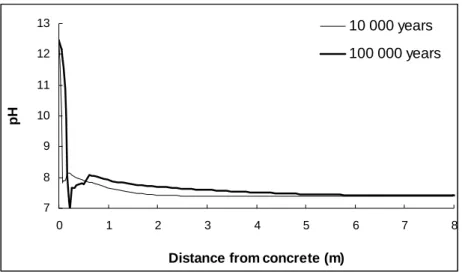
One of the most expected chemical changes in the barrier is the increase in the pH of the pore water. However, after 100,000 years, a very strong buffering of the pH was observed and the pH front evolved little between 10,000 and 100,000 years (Fig. 1). As stated earlier, the
pCO2 was not fixed in our calculations. Carbon dioxide was produced by the system itself and the partial pressure of CO2 varied
little from its value in the host rock, except very close to the interface (Fig. 2). This indicates that the mineralogical assemblage was rich enough to fix the pCO2 internally, which in turn exerted a strong control on pH.
Coudrain-Ribstein et al. (1998) demonstrated
the efficiency of a mineralogical buffer, depending on the nature of the phases at equilibrium with the solution. There was a noticeable decrease in pH at 7.5 and 22.5 cm after 10,000 and 100,000 years, respectively. In this zone, calcite was entirely dissolved, decreasing the pH buffering capacity. Dissolution/precipitation reactions also acted as mineral buffers and limited the increase in pH. Tobermorite precipitation, for example, affected pH via the following reaction (for pH < 12.9, where CaOH+ was not the dominant species of Ca(aq)): 5 . 27 21 6 5 2 3 2 5 . 5 4 6 5Ca ++ HSiO−+ OH−+ H O⇔CaSi H O
Tobermorite precipitation caused the pH to decrease from 11 to 9.
E.C. Gaucher et al. (2004) personal edition
Fig. 1 Change in the pH of the barrier (MX80) pore water
7 8 9 10 11 12 13 0 1 2 3 4 5 6 7 8
Distance from concrete (m)
pH
10 000 years 100 000 years
Fig. 2..Calculated CO2 partial pressure in equilibrium with the barrier pore water
-16 -14 -12 -10 -8 -6 -4 -2 0 0 1 2 3 4 5 6 7 8
Distance from concrete (m)
Log(PCO
2
)
10 000 years 100 000 years
Another important change involved the dissolution/precipitation of mineral phases (Fig. 3) after a diffusion period of 100,000 years.
♦ Between 0.7 and 8 m from the interface, the only modification caused by the alkaline plume in the bentonite was the total or partial dissolution of gypsum. This mineral was totally dissolved in the first 5.0 m of the barrier because of the low sulfate content in the concrete water. The diffusion front slightly modified the composition of the species at the exchanger surface.
♦ Between 0.40 and 0.70 m from the interface, the dissolved potassium concentration increased because the concrete pore water was more potassic than the host water. This favored the precipitation of a potassic zeolite, clinoptilolite. K-clinoptilolite precipitated at the expense of Na-montmorillonite, which produced aluminum. However, the Si/Al ratio is 2.4 in montmorillonite compared to 4.2 in K-clinoptilolite. The additional amount of silica needed for clinoptilolite precipitation was provided by cristobalite, which dissolved entirely at 0.44 m from the interface. Partial dissolution of montmorillonite provided
E.C. Gaucher et al. (2004) personal edition magnesium that was incorporated in
Na-saponite. Within this zone, Ca-montmorillonite progressively replaced Na-montmorillonite since concrete pore water is slightly richer in calcium than the host rock pore water. Exchange reactions do not seem to be efficient enough to attenuate the calcium gradient. Precipitation of Ca-montmorillonite depleted the dissolved calcium, which was compensated for by the partial dissolution of calcite. Calcite disappeared completely at a distance of 0.54 m from the concrete barrier. ♦ Between 0.10 and 0.40 m from the interface, both Ca and Na-montmorillonite disappeared in favor of illite. Illitization of montmorillonite under alkaline conditions is well-documented. Howard and Roy (1985) and Eberl et al. (1993) observed partial illitization of a smectite phase, obtaining interstratified illite/smectite (IS) minerals as final products. IS minerals are known to represent an intermediate stage between smectite and illite during the diagenetic evolution of shale (Inoue et al., 1987). At the Khushaym Matruk natural analogue, illitization is associated with the precipitation of zeolites (Rassineux et al. 2001). Zeolites became the predominant phases, with the precipitation of gyrolite and gismondine and the continuing presence of clinoptilolite. Zeolites replaced illite, which dissolved entirely at a distance of 0.10 m from the concrete. Adler et al. (1999) reported the presence of Ca-zeolite as a product of the alteration of a smectite-containing clay rock by a K-Na-Ca hydroxide solution. Calculations performed by Savage et al. (2002) produced similar results. Magnesium, released by illite dissolution, is included in Na and Ca-saponite. Experimental precipitation of saponite from muscovite altered by an alkaline solution (pH 9.2) has been observed by Nagy et al. (2000). In their study, SIMS analyses indicated that Al was leached from the muscovite surface and replaced by Mg, suggesting that the phyllosilicate changed from a dioctahedral into trioctahedral structure.
In this zone, where the amount of illite is at a maximum, the total volume of minerals decreases from 3770 to 2940 cm3. Therefore, we would expect the porosity to be greater because illite replaces montmorillonite.
♦ Between 0.00 and 0.10 m from the interface, cement phases (Afwillite, Tobermorite, Katoite, Hydrotalcite, Ettringite) precipitated instead of zeolite phases. Claret
et al. (2002) and Adler et al. (1998) reported
the formation of CASH phases when a smectite-containing rock was weathered by an alkaline solution. Tobermorite and ettringite formation has been observed in a marl naturally weathered by flowing hyperalkaline water at Maqarin, Jordan (Milodowski et al. 2001; Cassagnabère et al., 2001). The Maqarin and Khushaym Matruk natural analogues are roughly 100,000 years old and the perturbation does not extend beyond a few centimeters. The calculations of Savage et al. (2002) also indicate precipitation of tobermorite near the concrete interface. The CASH gels observed by Adler et al. (1998) and Claret et al. (2002) may be considered to be metastable phases with respect to the katoite observed at the concrete interface. Because our calculations were done for a 100,000-year period, we chose not to take into account these metastable phases because thermodynamic data are lacking and also because metastable phases tend to evolve into stable phases with time. Our results are, however, similar to experimental observations. The conversion of zeolites into cement phases is related to an increase in the Ca/Si ratio in the solid phases as we get near the concrete interface. Savage et al. (1992) mentioned that CSH phases with relatively high Ca/Si ratios (tobermorite, Ca/Si = 0.83) may re-dissolve to form minerals with lower Ca/Si ratios in response to a decreasing fluid Ca/Si ratio (gismondine, Ca/Si = 0.5). The increase in pH favored the precipitation of calcite. Adler et al (1998) observed a similar phenomenon during experiments on Swiss Opalinus Clay. Concerning the Mg-rich phases, clinochlore followed Ca-saponite because clinochlore formation consumes protons and clinochlore is stabilized at a higher pH than saponite, according to the reaction: O 7.34H 1.67Al 2Mg (OH) O Si Al Mg Ca 8.68H 0.67SiO 0.165Ca (OH) O Si Al Mg 2 3 2 2 10 3.67 .33 3 0.165 2 2 8 10 3 2 5 + + + = + + + + + + +
Clinochlore is a Mg-chlorite that contains brucite [Mg(OH)2] in the interlayer hydroxide
E.C. Gaucher et al. (2004) personal edition
The comparison of figures 3 and 4 shows that, as expected, a shorter diffusion time caused a decrease in the extent of the mineralogical transformations whereas mineralogical processes remained essentially the same. Finally, the total volume increased due to the precipitation of cement phases near the interface. Savage et al. (2002) reported a similar increase near the concrete interface. The change in porosity would modify
transport conditions. A porosity collapse and an increase of the mechanical stress can be expected in this zone due to this important increase of mineralogical volume. The diffusion coefficient will probably decrease near the interface. Because it is not possible to consider this effect with PHREEQC, our simulations over-estimated the extent of the perturbation.
Fig. 3 Mineralogical composition of the barrier after 100,000 years, diffusion
coefficient = 10
-11m²/s
0 1000 2000 3000 4000 5000 6000 7000 8000 9000 10000 0.70 0.60 0.50 0.40 0.30 0.20 0.10 0.00Distance from concrete (m )
V olu m e ( c m 3 )
Montm or-Na Montm or-Ca Saponite-Na Saponite-Ca Nontronite-Na Nontronite-Ca Illite Clinochlore Calcite Cristobalite Gypsum Pyrite Ettringite Clinoptilolite-K Gism ondine Gyrolite Katoite Hydrotalcite Afwillite Toberm orite
M X80
after 100 000 years
1 2
Reaction path :
1- Montm orillonite -> Clinoptilolite-K Calcite dissolution
Cristobalite dissolution 2- Montm orillonite -> Illite 3- Illite -> Zeolites
4- Zeolites -> Cem ent phases Calcite precipitation
4'- Illite -> Saponite -> Clinochlore
3 4' 4
Fig. 4 Mineralogical composition of the barrier after 10,000 years, diffusion coefficient = 10-11 m²/s 0 50 0 1 00 0 1 50 0 2 00 0 2 50 0 3 00 0 3 50 0 4 00 0 4 50 0 5 00 0 0 .70 0 .6 5 0 .6 0 0 .55 0 .5 0 0 .45 0.4 0 0 .3 5 0 .30 0.2 5 0 .2 0 0.1 5 0 .1 0 0 .0 5 0.0 0
D istan ce fro m co n crete (m )
Volume (
c
m
3 )
M ontm or-N a M ontm or-C a S aponite-N a S aponite-C a N ontronite -N a N ontronite-C a Illite C linochlore C linoptilolite -K G ism ondine G yrolite C alcite C ris tobalite G yp sum P yrite E ttringite K atoite H ydrotalcite A fw illite T oberm orite
M X 80 after 10 000 years
1 2
R e actio n path :
1- M onm orillonite -> C linoptilotite-K C alcite diss olutio n
C ristobalite diss olution 2- M ontm orillonite -> Illite 3- Illite -> Z eo lites
4- Z eolites -> C em ent p hases C alcite pre cipitation
4'- M on tm orillon ite -> S apon ite -> C linoc hlore
4'
3 4
E.C. Gaucher et al. (2004) personal edition
7 STATUS OF THE EXCHANGED SPECIES BEARING PHASE
In the previous simulation, the cationic exchange capacity (CEC) was not related to any specific mineral phase. CEC remained constant throughout the simulation, even if the montmorillonite, the mineral responsible for the exchange capacity of the barrier, was entirely dissolved. In an effort to simulate plume diffusion more realistically, we did additional simulations taking into account the relationship between CEC and the amount of montmorillonite (new option of PHREEQC). This phase was assumed to be the only mineral with a significant CEC.
Due to difficulties in numerical convergence when using this option, the system was simplified by removing all of the Fe-bearing phases. The grid was also simplified, becoming a regular mesh of 80 0.1-m cells. A second simulation was then done with exactly the same characteristics, except for the relationship between montmorillonite and CEC.
Figure 5 shows the evolution in the amount of 3 main phases of the clay barrier, calculated with both approaches, for a diffusion time of 100,000 years. There are only very minor differences in the two simulations, which means that surface reactions are not critical for the mineralogical transformation.
8 INFLUENCE OF THE DIFFUSION COEFFICIENT
Influence of the diffusion coefficient has been tested with different values. New simulations were done with D=10-10 m²/s and D=10-9 m²/s.
The grid was divided into 80 0.1-m cells for D=10-10 m²/s and 52 0.25-m cells for D=10-9 m²/s. Results obtained for a diffusion time of 100,000 years are shown in figure 6 for D=10
-9
m²/s. Note: the horizontal scale of this figure is different from that of figure 3. There are no significant differences in the mineralogical transformation. However, the extent of the mineralogical transformation is multiplied by approximately one order of magnitude.
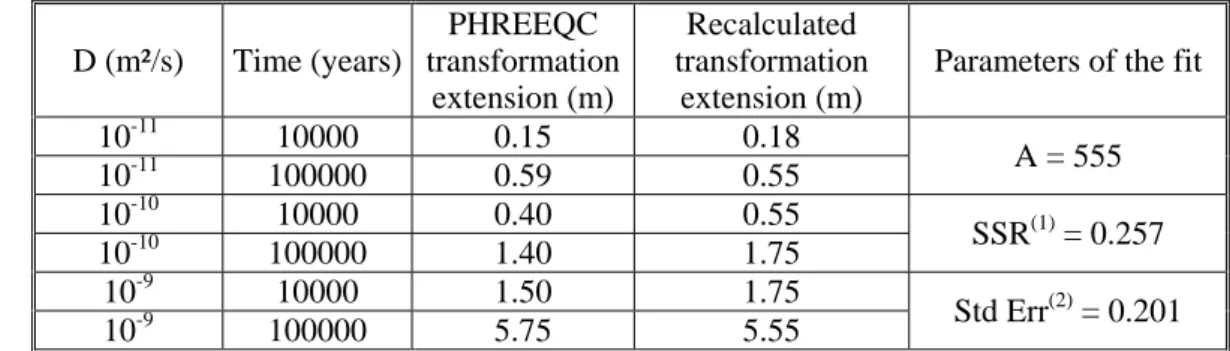
There is, therefore, a phenomenological relationship between the extent of mineralogical transformation of the host rock, the diffusion coefficient and the diffusion time. We chose the montmorillonite dissolution (>5 %) as an index of the mineralogical transformation. The law is “phenomenological” because it is based solely on a comparison of the results obtained for the three diffusion coefficients. After fitting various numerical expressions, the results of the simulations gave the following equation:
D t A ations transform cal mineralogi the of Extent ⋅ ⋅ =
where the “extension of the mineralogical transformations” is in m, “A” a numerical coefficient, “t” is the diffusion time (years) and “D” is the diffusion coefficient (m²/s). ; Fitting was done with the Solver add-in of EXCELTM. Results are given in table 6.
Table 6 Phenomenological law derived from PHREEQC simulations with 3 different diffusion coefficients D (m²/s) Time (years) PHREEQC transformation extension (m) Recalculated transformation extension (m)
Parameters of the fit
10-11 10000 0.15 0.18 A = 555 10-11 100000 0.59 0.55 10-10 10000 0.40 0.55 SSR(1) = 0.257 10-10 100000 1.40 1.75 10-9 10000 1.50 1.75 Std Err(2) = 0.201 10-9 100000 5.75 5.55 (1)
Sum of the squared differences. (2) Standard error between the recalculated and the PHREEQC transformation extension.
E.C. Gaucher et al. (2004) personal edition
In spite of the fact that for short diffusion times strict thermodynamic conditions cannot be assumed and advection may be taken into account when considering the Engineered Damage Zone (EDZ) near the waste
repository, the identified relationship could nevertheless be used to assess the impact of the alkaline perturbation on the clay barrier as a function of time.
Fig. 5 Comparison of two different ways to take the CEC into account
0 5 10 15 20 0 0.1 0.2 0.3 0.4 0.5 0.6 0.7 0.8 0.9 1
Distance from concrete (m)
Amount of phases (moles)
Calcite, CEC linked Calcite, no link Montmorillonite, CEC linked Montmorillonite, no link Cristobalite, CEC linked Cristobalite, no link
MX80
100 000 years
Fig 6. Mineralogical composition of the barrier after 100,000 years, diffusion coefficient = 10-9 m²/s 0 1000 2000 3000 4000 5000 6000 7000 8000 9000 10000 7.00 6.50 6.00 5.50 5.00 4.50 4.00 3.50 3.00 2.50 2.00 1.50 1.00 0.50 0.00
Distance from concrete (m)
Volume (cm 3 ) Montmor-Na Montmor-Ca Saponite-Na Saponite-Ca Nontronite-Na Nontronite-Ca Illite Clinochlore Calcite Cristobalite Gypsum Pyrite Ettringite Clinoptilolite-K Gismondine Gyrolite Katoite Hydrogrenat Hydrotalcite Afwillite Tobermorite MX80 after 100 000 years 1 2 Transformations : 1- Montmorillonite -> Clinoptilolite-K Calcite dissolution Cristobalite dissolution 2- Montmorillonite -> Illite 3- Illite -> Zeolites
4- Zeolites -> Cement phases Calcite precipitation
4'- Illite -> Saponite -> Clinochlore
3 4'
4
E.C. Gaucher et al. (2004) personal edition
The simulation of the diffusion of an alkaline plume from concrete into an MX80 clay barrier using PHREEQC revealed the changes in the mineralogical and chemical parameters of the system as diffusion from the cement occurred. The results show that the mineralogical composition of the barrier is profoundly altered near the interface with the concrete. The extent of mineral transformations is proportional to the square root of the diffusion time and the diffusion coefficient. From the clayey host rock to the concrete, the transformations begin with an illitization of the montmorillonite. The illite then dissolves as zeolite phases are precipitated. These are finally dissolved to produce cement phases near the concrete interface as a result of an increase in the Ca/Si ratio in the solid phases. This transformation sequence causes a decrease in the total volume of the rock as illitization of the montmorillonite progresses and a strong increasein the total volume as cement phases precipitate, which would lead to a decrease in porosity near the concrete interface. Exchange reactions between montmorillonite and the solution are of minor importance. It is clear that some of these results are related to the high number of solid phases retained in the database, which leads to a control of the
alkaline and alkaline-earth elements by solid phases rather than by exchange reactions. Using a smaller database would produce different results. The simulations presented here also demonstrate the efficiency of the mineralogical buffering of the pH. The extent of the perturbation for the reference diffusion coefficient (10-11m2/s) is similar to the order of magnitude of the Jordan analogues (a few centimeters). Finally, calculating the extent of the perturbation as a function of the diffusion coefficient showed that this perturbation will remain in the vicinity of the nuclear waste repository and will not significantly concern the clayey Callovian-Oxfordian Formation host rock.
Acknowledgments
The authors would like to thank Dr F.J. Pearson (GWG) for his review. Financial support was provided by ANDRA, the Commission of the European Communities (Contract ECOCLAY II: FIS5-1999-00145), and BRGM. N. Michau (Project leader of the EcoclayII project) is specially thanked for his strong support. Pr. Mäder and Dr. Savage are thanked for their constructive review of this work.
REFERENCES
Adler, M., Mäder, U., Waber, N., 1998. Experiment vs modelling: Diffusive and advective interaction of high-pH solution in argillaceous rock at 358C. Goldschmidt Conf., Toulouse, Mineral. Mag. 62A, 15-16.
Adler, M., Mäder, U.K., Waber, H.N., 1999. High-pH alteration of argillaceous rocks: an experimental study. Schweiz. Mineral. Petrogr. Mitt. 79, 445-454.
ANDRA, 1999. Référentiel Géologique, Site de Meuse/Haute Marne. Report A.RP.ADS.99-005/B. Ball, J.W., Nordstrom, D.K., 1991. User's manual for
WATEQ4F, with revised thermodynamic data base and test cases for calculating speciation of major, trace, and redox elements in natural waters: U.S. Geological Survey Open-File Report 91-183, 189 p. Bateman, K., Coombs, P., Noy, D.J., Pearce, J.M.,
Wetton, P., Haworth, A., Linklater, C., 1999. Experimental simulation of the alkaline disturbed zone around a cementitious radioactive waste repository: numerical modelling and column experiments. In: Metcalfe R. and Rochelle, C.A. (eds.), Chemical Containment of Waste in the Geosphere. Geol. Soc. London Spec. Publ. 157, 183-194.
Berner, U.R., 1992. Evolution of pore water chemistry during degradation of cement in a radioactive waste repository environment. Waste Mgmt. 12, 201-219. Bourbon, X., 2003. Chemical conceptual model for
cement based materials, mineral phases and thermodynamic data. ANDRA Report C.NT.ASCM.03.026.A, 14 p.
Braney, M.C., Haworth, A., Jefferies, N.L., Smith, A.C., 1993. A study of the effects of an alkaline plume from a cementitious repository on geological materials. J. of Cont. Hydr. 13, 37-402.
Cannière, P. de, 2003. Communication Ecoclay II final meeting. Paris September 2003.
Cassagnabère, A., Parneix, J.C., Sammartino, S., Griffault, L., Maeder, U., Milodowski, A.E., 2001. Mineralogical evolution of bituminous marl adjacent to an alkaline water conducting feature at the Maqarin analogue site. In Rosa Cidu (Ed), Water-Rock Interaction 10, Vol 1, Balkema, pp. 367-370, Claret, F., Bauer, A., Schäfer, T., Griffault, L., Lanson,
B., 2002. Experimental investigation of the interaction of clays with high-pH solutions. A case study from the Callovo-Oxfordian formation, Meuse-Haute Marne underground laboratory (France). Clays Clay Miner., 50, 633–646.
Courdrain-Ribstein, A., Gouze, P., de Marsily, G., 1998. Temperature-carbon dioxide partial pressure trends in confined aquifers. Chem. Geol., 145, 73-89. Eberl, D.D., Velde, B., McCormick, T., 1993. Synthesis
E.C. Gaucher et al. (2004) personal edition temperatures and high pH. Clay Minerals, 28,
49-60.
Fischer, F.K., 1963. The crystal structure determination of the zeolite, gismondite, CaAl2Si2O8·4H2O. Amer.
Mineral., 48, 664-672.
Fletcher, P., Sposito, G., 1989. The chemical modelling of clay/electrolyte interactions for montmorillonite. Clay Minerals, 24, 375-391.
Gaines, G.L., Thomas, H.C., 1953. Absorption studies on clay minerals. II. A formation of the thermodynamics of exchange absorption. J. Chem. Phys., 21, 714-718.
Gaucher, E., Robelin, C., Matray, JM, Negrel, G., Gros, Y., Heitz, J.F., Vinsot, A., Rebours, H., Cassagnabere, A., Bouchet, A., 2004. ANDRA underground research laboratory: Interpretation of the mineralogical and geochemical data acquired in the Callovian-oxfordian Formation by investigative drilling. Physics and Chemistry of the Earth, in press.
Gaucher E., Blanc P., Bardot F., Lassin A., Crouzet C., Moussay A., Braibant G., Breeze D. 2002. Simulation de la chimie des eaux du Callovo-Oxfordien. BRGM public report RP-52039-FR. 55 p., 10 fig., 24 tabl.
Hatches, 2000. The Harwell/Nirex Thermodynamic Database for Chemical Equilibrium Studies, version NEA13.
Howard, J.J., Roy, D.M., 1985. Development of layer charge and kinetics of experimental smectite alteration. Clays Clay Miner., 33, 81-88.
Inoue, A., Norihiko, K., Kitagawa, R., Watanabe, T., 1987. Chemical and morphological evidence for the conversion of smectite to illite. Clays Clay Miner., 35, 111-120.
Lehikoinen, J., Carlsson, T., Muurinen, A., Olin, M., Salonen, P., 1996. Evaluation of factors affecting diffusion in compacted bentonite. Mat. Res. Soc. Sym. Proc. 412, 675-682.
Lehikoinen, J., Muurinen, A., Melamed, A., Pitkänen, P., 1997. Determination of porewater chemistry in compacted bentonite. Mat. Res. Soc. Sym. Proc. 465, 1011-1018.
Milodowski, A.E., Hyslop, E.K., Khoury, H.N., Hughes, C.R., Maeder, U., Griffault, L., Trotignon, L., 2001. Mineralogical alteration by hyperalkaline groundwater in northern Jordan. In Rosa Cidu (Ed), Water-Rock Interaction 10, Vol 1, Balkema, pp.1347-1350.
Murphy, W.M., Pabalan, R.T., 1994. Geochemical Investigations Related to the Yucca Mountain Environment and Potential Nuclear Waste Repository. NUREG/CR-6288. San Antonio, Texas: Southwest Research Institute. TIC: 227032.
Nagy, K., Schlegel, M., Cheng, L., Fenter, P., Sturchio N., 2000. Alteration of Muscovite to a Mg-Clay, Goldschmidt Conf. 2000, Journal of Conf. Abstracts, 5(2), 737
Parkhurst, D.L., Appelo, C.A.J., 1999. User's guide to PHREEQC (version 2) – A computer program for speciation, batch-reaction, one-dimensional transport, and inverse geochemical calculations. : U.S. Geological Survey Water-Resources Investigations Report 99-4259.
Rassineux, F., Griffault, L., Smellie, J.A.T., Trotignon, L., Raynal, J., Khoury, H., Mercier, F., 2001. Mineralogical evolution of clay-bearing rock during alkaline alteration. In Rosa Cidu (Ed), Water-Rock Interaction 10, Vol 1, Balkema, pp. 1363-1366. Rinaldi, R., Pluth, J.J., Smith, J.V., 1974. Zeolites of the
phillipsite family. Refinement of the crystal structures of phillipsite and harmotome. Acta Cryst., B 30, 2426-2433.
Roberts, W.L., Campbell, T.J., Rapp, G.R., Wilson, W.E., 1990. Encyclopaedia of Minerals, 2nd ed., Van Nostrand Reinhold.
Sacerdoti, M., Passaglia, E., 1985. The crystal structure of katoite and implications within the hydrogrossular group of minerals. Bulletin de Minéralogie, 108, 1– 8.
Savage, D., Rochelle, C.A., 1993. Modelling reactions between cement pore fluids and rock: implications for porosity change. J. of Cont. Hydr., 13, 365-378.
Savage, D., Bateman, K., Hill, P., Hughes, C., Milodowski, A., Pearce, J., Rae, E. Rochelle, C., 1992. Rate and mechanism of the reaction of silicates with cement pore fluids. Appl. Clay Sc., 7, 33-45.
Savage, D., Noy, D., Mihara, M., 2002. Modelling the interaction of bentonite with hyperalkaline fluids. Appl. Geochem., 17, 207-223.
Steefel, C.I., Lichtner, P.C., 1994. Diffusion and reaction in rock matrix bordering a hyperalkaline fluid-filled fracture. Geochim. Cosmochim. Acta, 58 (17), 3595-3612.
Soler, J., 2003. Reactive transport modelling of the interaction between a high-pH plume and a fractured marl: the case of Wellenberg. Appl. Geochem., 18, 1555-1571.
Wolery, T.J., 1992. EQ3/6, a software package for geochemical modelling of aqueous systems: Package overview and installation guide. Lawrence Livermore National Laboratory, Livermore, California.