Creating a Corporate Strategy for Utilizing Supply
Chain Simulation, Optimization and Visualization
By David Chou
BS Mechanical Engineering United States Military Academy, 2007
SUBMITTED TO THE MIT SLOAN SCHOOL OF MANAGEMENT AND THE MIT MECHANICAL ENGINEERING DEPARTMENT IN
PARTIAL FULFILLMENT OF THE REQUIREMENTS FOR THE DEGREES OF
MASTER OF BUSINESS ADMINISTRATION AND
MASTER OF SCIENCE IN MECHANICAL ENGINEERING IN CONJUNCTION WITH THE LEADERS FOR GLOBAL
OPERATIONS PROGRAM AT THE
MASSACHUSETTS INSTITUTE OF TECHNOLOGY JUNE 2014
C 2014 David Chou. All Rights Reserved.
MASSACHUSETrS
E
OF TECHNOLOGY
JUN
18
201
LIBRARIES
The author hereby grants to MIT permission to reproduce and to distribute publicly paper and electronic copies of this thesi document in
whole or in part in any medium now known or herea r created. Signature of Author:
Signature red acted
Mt Sloan School of Management and the e ent of Mechanical Engineering
Ce d B:
Sr
rMay
9, 2014Certified By:
Sin t r red cte
Certified By:
Accepted By:
Accepted By:
Edgar Blanco Research D Cen for Transportation and Logistics
_Signature
redacted
Thesis SupervisorC/ Roy Welsch
Professor of Statistics and May ment Science and ngineering Systems
Signaturee
Supervisor
Signature redacted
- ~
David E. Hardt Professor of Mechanical Engineering Chairman, Committee on Graduate Students Maura Herson Director of MBA Program MIT Sloan School of Management
Creating a Corporate Strategy for Utilizing Supply Chain Simulation, Optimization, and
Visualization
By David Chou
Submitted to the MIT Sloan School of Management and the MIT Department of Mechanical Engineering on May 9, 2014 in partial
fulfillment of the requirements for the degrees of Master of Business Administration
and
Master of Science in Mechanical Engineering
ABSTRACT
Computer based supply chain simulation, optimization, and visualization capability have changed
significantly in the past 45 years, expanding capability in lockstep with increases in computational power. The increase in accessibility of relatively cheap and powerful hardware has led to the development of a multitude of supply chain simulation, optimization, and visualization programs catered towards reducing corporate supply chain costs. Some of these programs are commercial business to business offerings, while a significant set are developed internally within the corporation. Expertise in this field is
increasingly seen as an area of competitive advantage for modern goods based corporations. However, the danger lies in executing decisions based upon inaccurate simulation results, often meaning millions of dollars lost in waste rather than the desired savings.
This thesis aims to identify the needs of a corporation regarding supply chain simulation, optimization, and visualization - particularly how a company may categorize offerings within this field - how these programs may fit within the organizational context of a company, and how to ensure correct utilization of a set of supply chain programs. Supply chain is very well understood, but little focus has been placed on correctly utilizing these programs to support success for a company's goal of becoming operationally efficient.
A current state analysis of a major U.S. manufacturing company, Caterpillar, Inc., was conducted and a new framework was applied to understand Caterpillar's usage of supply chain programs. This thesis utilizes findings from Caterpillar as a sample case to reinforce research. An overall strategy is developed based on research at Caterpillar, and supports the creation of a group of internal experts disassociated from specific supply chain specialties, such as procurement or logistics, in order to ensure global efficiency. A generic strategy is presented for any corporation utilizing computer based supply chain
simulation, optimization, and visualization. Thesis Supervisor: Edgar Blanco
Title: Research Director, Center for Transportation and Logistics Thesis Supervisor: Roy Welsch
Acknowledgements
I would like to first thank the LGO program for the opportunity to participate in what has been a fantastic
journey of learning and personal growth. The instructors, staff, and thesis advisors associated with LGO have been critical in my personal success and deserve much praise for their hard work and dedication. Along with those who made the program possible, I would also like to acknowledge all of my fellow
LGOs who have contributed to making the experience as rich as it was.
Second, I would like to thank everyone that I was able to work with over the six month internship term at Caterpillar. Specifically, I would like to thank my supervisor, Jenny Wilcoski, for her support and mentorship. Additionally, there were many at Caterpillar who were major contributors to my work (in no particular order), including Tony Grichnik, Jeff Miller, Andy Van Vorhis, Bob Davy, Greg Matson, and Tom Hamm.
Finally, I am especially thankful for the support of my wife, Sarah. She has accompanied me along this journey, going through its highs and its lows with me, always encouraging and supportive. Sarah deserves
Table of Contents
Abstract ... 3 Acknowledgem ents ... 5 Table of Contents ... 6 List of Figures ... 10 I Introduction ... 121.1 Caterpillar, Inc. Background ... 12
1.2 Problem Statem ent ... 14
1.3 Project Goals ... 15
1.4 M ethodology ... 15
1.5 Sum m ary ... 16
2 Literature Review ... 17
2.1 History of Com putational Supply Chain Software ... 17
2.2 Centralization vs Decentralization of Organizations ... 18
3 Supply Chain Program s Fram ework - Redefined for Business Usage ... 19
3.1 Functionality vs Purpose ... 21 3.2 Type I Functionality ... 21 3.2.1 M odeling ... 21 3.2.2 Sim ulation ... 22 3.2.3 Optim ization ... 22 3.2.4 V isualization ... 23 3.3 Type 2 Functionality ... 23 3.3.1 Dashboards ... 24 3.3.2 Decision Support ... 24
3.3.3 Real Tim e Updating ... 26
3.4 Purpose ... 26
3.4.1 Facility Planning ... 26
3.4.2 Inventory M anagem ent ... 27
3.4.3 Sourcing ... 27
3.4.4 Transportation ... 28
3.4.5 N etwork Design ... 28
3.4.6 Long Term Strategic Planning ... 28
4.1 Business U nits Involved...29
4.2 Fram ew ork Applied to Caterpillar ... 31
4.3 Operational Decision Level Program s ... 31
4.4 Tactical D ecision Level Program s ... 32
4.5 Strategic D ecision Level Program s... 34
4.6 Conclusions from this Application... 36
5 General M ultigenerational Project Plan... 36
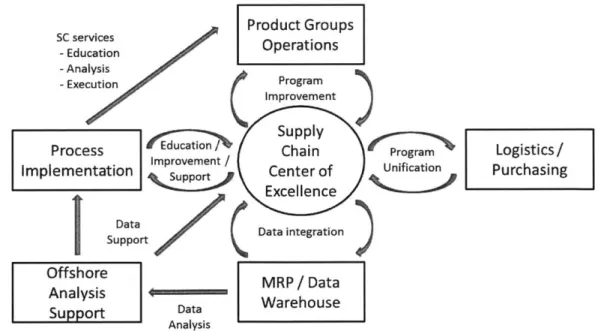
5.1 Supply Chain Center of Excellence ... 37
5.1.1 Center of Excellence Design and Structure ... 38
5.1.2 Im plem entation Concerns ... 40
5.1.3 Political Considerations ... 41
5.2 Industry Utilization and Adoption ... 42
6 Conclusions... 44
6.1 Recom m endations for Other Areas of Research... 44
List of Figures
Figure 1: Caterpillar Footprint M ap... 13
Figure 2: Enterprise Improvement Cycle ... 14
Figure 3: Interview List ... 16
Figure 4: Supply Chain Program List ... 20
Figure 5: Supply Chain Program Categorization Framework ... 20
Figure 6: Supply Chain Visualization ... 23
Figure 7: Plan for Every Part ... 24
Figure 8: iLog Product and Inventory Flow Analyst ... 25
Figure 9: Llamasoft Supply Chain Guru ... 25
Figure 10: Operational Level Tools (Facility Level) ... 31
Figure 11: Tactical Level Tools (Product Groups and Sub Groups above Facility Level) ... 32
Figure 12: Strategic Level Tools (Product Group Interactions, Enterprise) ... 34
Figure 13: M ulti-Generational Project Plan ... 37
Figure 14: Center of Excellence Organizational Position ... 38
1. Introduction
The purpose of this thesis is to recommend a framework to understand the usage of supply chain simulation, optimization, and visualization programs (hereon collectively termed "supply chain modeling") in a corporate context and to provide a general strategy for proper utilization of these
programs within the corporate environment. The research was conducted through an internship completed with Caterpillar as part of the Leaders for Global Operations program at the Massachusetts Institute of Technology. Caterpillar served as the factual basis for ideas presented. The following sections provide context regarding Caterpillar to facilitate understanding of the situation.
1.1 Caterpillar, Inc.
Headquartered in Peoria, IL, Caterpillar is one of the world's largest companies, both in terms of workforce and revenue stream. In 2013 alone, Caterpillar saw revenues of over $55.65 billion, placing it in the upper strata of the Fortune 500 list.' Caterpillar currently employs over 121,000 globally.23 Its signature Caterpillar yellow is immediately recognizable and the Caterpillar brand is ranked 58th on the
best global brands list by Interbrand, ahead of Porsche and just six steps behind Facebook.4
Caterpillar officially traces its roots to a merger between the Holt Manufacturing Company and the C.L. Best Tractor Company in 1925. Early Caterpillar production was limited as they focused specifically on track-type tractors, motor graders, generator sets and diesel engines.5 Now, the company has expanded significantly, maintaining some presence on every populated continent and continuing to expand to respond to global machinery needs as countries continue to invest in construction and mining. Caterpillar is now the world's leading manufacturer of machinery and power systems for the construction industry, resource industries, and general power systems as well as a provider of significant financial products. The following map shows the current footprint of the company, helping to illustrate both the sheer size of Caterpillar and alluding to the complexities that Caterpillar faces in coordinating all of their business operations.
Caterpillar Corporation, "Form 10-K Annual Report 2013," 1.
2 "Caterpillar Number of Employees CAT NYSE."
3 "Travel and History US Cities by Population. Cities with over 100,000 People."
4 Interbrand, "Best Global Brands 2013."
Woddwide Locations
Komatsu, Hitachi Construction Machinery, Volvo Construction Equipment, and Deere & Co.6 Although Caterpillar has been able to maintain healthy margins on each product due to its quality, technical innovation, and customer loyalty, the degree of competition that they are facing demands that Caterpillar continues to strive for improvement. Caterpillar works for product superiority, ensuring customer preference and operational efficiency, facilitating product price competitiveness.
In the past few years, Caterpillar has made efforts to improve and evolve their operational efficiency, specifically in the area of supply chain. This has taken the form of the development of the Caterpillar Production System organization (CPS), the very recent formation of a Caterpillar Enterprise System
Group (CESG), and countless Lean and 6 Sigma improvement projects. These organizational changes are part of the equation that eventually led Caterpillar's 2013 ranking of 18th on the Supply Chain Top 25 list
generated by Gartner, a leading independent research firm.'
The focus on improvement also led to the development of an Integrated Supply Chain Strategy (ISCS) that was expected to improve Caterpillar's supply chain design and simulation capabilities. ISCS focused on three aspects of supply chain improvement - 1) processes 2) tools and 3) data. The following figure shows how these three aspects of improvement fit within a general improvement cycle:
6 Caterpillar Corporation, "Form
10-K
Annual Report 2013," 2.4. Ensure quality & 5. Ensure quality 6. Drive results through
consistency of the consistencyof the effective
inputs s and implementation
3. Select the right data 2. Select or develop tools 1. Define enterprise-level
and organize it into hat can -address the projects & success
needed information challenges criteria
Figure 2: Enterprise Improvement Cycle
One area of specific interest is how individual supply chain simulation, optimization, and visualization tools fit within this process cycle and how Caterpillar can ensure effective utilization of all of these tools. This is an area that proves to be of significant interest as globalization demands continuously increasing supply chain efficiency to remain competitive.
1.2 Problem Statement
In support of the ISCS, independent teams within Caterpillar led initiatives to investigate supply chain design and simulation. This ranged from the examination of full network optimization and design programs such as Supply Chain Guru or Cast to more limited process design programs such as Plant Sim and Flex Sim. The purpose of these investigations was for the improvement of Caterpillar's simulation and visualization capabilities through the usage of advanced software. However, the sheer number of examined programs combined with an independent and decentralized team structure means that there is
significant risk of work and expense redundancies as well as missed opportunities.
It is now apparent as different groups continue down their separate paths that a coordinated approach is required. A strategy regarding how Caterpillar can best take advantage of internally developed programs and externally available commercial software will reduce the risk of unnecessarily spending money on duplicated projects, overlooking key opportunities, and improve overall supply chain simulation and visualization tool effectiveness.
Though the project focuses on Caterpillar in particular as an in depth example, additional studies of six other companies in the Fortune 500 shows that this is a recurring problem when attempting to effectively utilize complex supply chain software.
1.3 Project Goals
The goal of the project is to understand the supply chain software tool use environment at Caterpillar and understand, in lower resolution, the approaches at six other major corporations. This then leads to the development of a framework for corporations to determine their current and desired supply chain program toolkit. Finally the project creates a strategy for corporations to ensure effective utilization of these
programs.
1.4 Methodology
The approach to this problem was to conduct a number of internal and external interviews to understand the simulation and visualization capability within Caterpillar and the approaches that other industry leaders were undertaking in the same vein. Coming from an outside source, MIT, helped in the facilitation of the data gathering as it provided a degree of subjectivity. One point of clarity though, is that this project was chartered by Caterpillar Production System (CPS), Caterpillar's internal process improvement organization and also one of the stakeholder groups. There is the possibility of partiality, but the final recommendation regarding tying supply chain tool experts and process implementers primarily focused on ensuring effectiveness. This would best occur through a close relationship between a simulation program cultivation group and the corporate process owners who would be the primary implementers and instructors of the supply chain programs.
The internal interviews consisted of scheduled two hour blocks of time with targeted team members and potential customers of the simulation and visualization tools. The focus regarded what programs those persons specifically utilized, what their actual needs were, and how well those programs met those needs.
Significant time was also spent in understanding the overall functionality of the programs, its cost
structure, and its learning curve. All of those aspects of the programs played into their overall usability for Caterpillar and fit within the supply chain tool ecosystem.
An external industry study followed to validate internal findings. This included interviews with a number of simulation groups in different industries with significant manufacturing or supply chain footprints as
well as interviews with supply chain software vendors. Caterpillar competitors were not interviewed. A number of interviews resulted from connections with Llamasoft, which skewed response rates favor utilization of Llamasoft's Supply Chain Guru as a specific inventory optimization and network design tool. However, this did not affect the analysis concerning how these types of programs fit within the
spectrum of programs nor how they should be utilized.
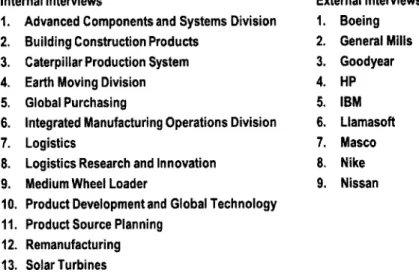
Below is a list of the various internal and external groups interviewed during the course of this study:
Internal Interviews
1. Advanced Components and Systems Division
2. Building Construction Products 3. Caterpillar Production System 4. Earth Moving Division
5. Global Purchasing
6. Integrated Manufacturing Operations Division 7. Logistics
8. Logistics Research and Innovation 9. Medium Wheel Loader
10. Product Development and Global Technology 11. Product Source Planning
12. Remanufacturing 13. Solar Turbines External Interviews 1. Boeing 2. General Mills 3. Goodyear 4. HP 5. IBM 6. Llamasoft 7. Masco 8. Nike 9. Nissan
Figure 3: Interview List
The interview list spans a significant portion of Caterpillar, though it does not include every single department. Also, the external interviews quality was more general than Caterpillar interactions. None of the interviewees will be specifically quoted in this thesis, though their information will be distilled as it pertains to the categorization of a corporate tool set and the development of a supply chain tool strategy.
1.5 Summary
Caterpillar continues to lead not only in their core product categories, but also in the global supply chain operations that support these products. However, the advancements in the field of computer based supply chain software have raised the importance of more effective usage of the corporation's supply chain toolset. Therefore, this thesis aims to develop a framework to allow a corporation to understand their current tool kit and provide a strategy to ensure efficient usage of those tools.
2 Literature Review
Significant literature exists regarding specific supply chain tools and their usage. This literature review seeks to establish a baseline for understanding these tools and their purpose based on current study. The literature review also expands to tie in corporate considerations regarding centralization of effort. This
serves as a platform from which the thesis framework and strategy are developed.
2.1 History of Computational Supply Chain Software
Supply chain computational programs have likely existed in some form as soon as companies realized the power of the computer and the possibility of applying that mathematical capability to supply chain
problems. A survey of supply chain design software by Fukani at the Georgia Institute of Technology shows that the first commercial offerings arose in 1968 with the introduction for "Network." This was followed in the 1980's by a boom of supply chain software programs, to include Cast, Prodisi SCO, and
8
SAILS. Of these early programs, Cast was encountered in the investigation of this thesis as a continuing
commercial product. As computational power rose, more entrants entered the supply chain software field in the late 1990's, including current industry leaders - LogicNet Plus, Supply Chain Strategist, and
Supply Chain Guru.9
Fukani's survey of supply chain software uncovered a number of behaviors, which were observed through the course of the investigation related to this thesis. First, network and inventory optimization models all utilized a node and arc method. The nodes in this case modeled facilities and the arcs were the movement of goods between the facilities. Many of the tools also overlapped in presented results, all supported cost minimization and most supported some form of profit maximization analysis. Second, the tools most often utilized mixed integer programming as the basis of their computational engine. Finally, all modern programs offer some geographical overlays to integrate with supply chain visualizations.10
Current Internet web search brings up six major vendors on the first page, a small sample of a growing field. IBM, JDA, and Llamasoft remain in the arena with LogicNet, CAST, and Supply Chain Guru programs respectively. We now also see Quintiq Supply Chain Optimization, Logility Supply Chain Management Software, and SAP SmartOps. This shows that supply chain simulation is not only
8
Funaki, "State of the Art Survey of Commercial Software for Supply Chain Design," 5.
9
Ibid.
important to major corporations with significant supply chain footprints, but it is important enough that myriad of program vendors now exist to service those needs.
2.3 Centralization vs Decentralization of Organizations
The utilization of supply chain simulation, optimization and visualization programs inherently requires some level of data and execution centralization in order to be useful. A singular task or function is generally simple to calculate and does not necessitate significant computational power, which is something that is typically contained within smaller independent control structures in a corporation. Looking to improve efficiency by tying thousands of these tasks and functions will often span multiple groups within an organization. In this case, some form of cohesive effort is required to ensure accuracy and precision of results, necessitating some degree of centralization regarding supply chain software functions.
Centralization and decentralization offer differing merits to their application in a corporate context. Andrew Christie, et al, in his work "Decentralization of the firm: theory and evidence" states that "value maximization requires either that knowledge is transferred to those with the right to make decisions, or that decision rights are transferred to those who have the knowledge. A tradeoff of knowledge transfer costs and control costs is required."" The fundamental issue at work here is the tradeoff costs between transferring knowledge and control. Now that computing power and data networks have made supply
chain data transfer relatively easy, this new cost of transfer must then be weighed against the control costs that arise from multiple lower level decisions that may interact sub-optimally.
Christie presents centralization decisions for a company as a function of two main variables: knowledge transfer costs (KTC) and control costs (CC). KTC arise from actual costs of transmitting knowledge, time
delays in this transferring and ensuring understanding of this knowledge, and ability to ensure understanding in a timely manner. This increases as knowledge is more specialized, by definition knowledge that is not easily transferrable or observable by higher management. In response to this, decision rights are often delegated to lower level managers and employees because it is more efficient.12 An examination of Caterpillar in a historical context shows that a significant decentralization event occurred in the 1980's. Caterpillar found centralized decision-making reduced their ability to respond
"1 Christie, Joye, and Watts, "Decentralization of the Firm," 3. 12 Ibid., 4-9.
quickly to rapid global changes, indicative of high KTC at the time, thus driving their subsequent shift towards a decentralized structure.
Control costs are the other aspect of the decision pertaining to centralization. The costs of creating and managing systems to ensure that lower level decisions are in line with the higher authority, as well as the cost of misalignment between these lower levels constitute control costs. Decentralization will often
increase CC as more effort and time is spent on ensuring the more independent lower level decision makers execute in line with higher management's vision. CC will also typically increase with the
specialization of knowledge, meaning CC will vary in a positive way with KTC. Corporations must understand the balance between their CC due to ensuring alignment of effort, CC that arises from higher KTC, and the KTC inherent to their business.13
Understanding of KTC and CC are particularly relevant to the application of supply chain modeling. As enterprise system solutions from SAP or Oracle better connect data within the company, we see a trend towards the reduction of KTC. Ensuring that supply chain decisions are globally optimal - that they optimize for the entire supply chain rather than a specific aspects such as warehousing or logistics
-incurs some level of CC. As KTC naturally diminishes for supply chain decisions, we can see a tendency towards centralization to reduce some of the CC related issues.
3 Supply Chain Programs Framework
-
Redefined for Business Usage
This project began as an examination of supply chain simulation and visualization initiatives within Caterpillar, which initially seemed as a set of reasonable and basic qualifiers for the supply chain
software. Discussions within industry focused upon looking at program offerings in these two categories, and much of the available literature found in the literature review focused specifically on simulation or visualization. Upon commencing the work, it was determined that the plethora of offerings in the realm of supply chain software is not properly categorized with just the groupings of simulation and visualization.
PFEP (webtool) GMM I TLM
TCO Load Optimizers
Kanban Calc JDA CAST
PFEP (calculator) Transportation scheduler
OIL GPNP
ReMIXX SC Guru
lgrafx iLog
Barcode Scanner LOG R&I
Machi Servigistics
AoS Plant Sim
Supplier Analytics Flex Sim
SCS Planner GLCD
Figure 4: Supply Chain Program List
Figure 4 illustrates the number of major programs that are utilized within Caterpillar for supply chain analysis purposes. The difficulty of extracting meaningful information from this list relates to the fact that most of the programs provide some form of simulation as well as visualization. Such a survey does not provide context that allows managers to see shortfalls in capability or understand areas of strength.
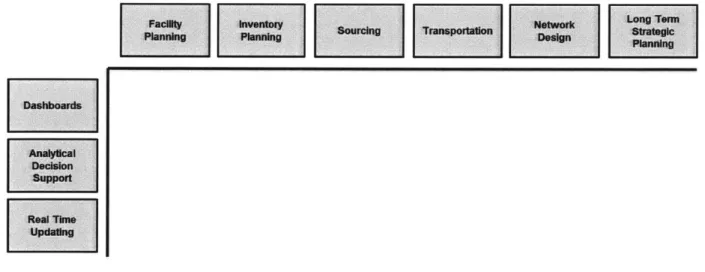
A new framework was then developed to contextualize Caterpillar's current program offerings and the
related strengths or weaknesses and is shown in Figure 5: Supply Chain Programs Framework. This framework was developed with insight from Dr. Edgar Blanco at the MIT Center for Transportation and Logistics as well as several supply chain professionals within Caterpillar. Once programs are properly categorized, it allows a better understanding of the supply chain program footprint.
sF
ply C ourcing Transportation ramework
Analytical Decision
ftsai Tne Updating
Figure 5: Supply Chain Program Categorization Framework
The supply chain programs framework essentially categorizes various programs into their functionality and their purpose. The overall program ecosystem must be understood to see if all actual business requirements are satisfied by the various supply chain programs at hand. Having this internal
understanding is currently of interest within Caterpillar and likely a crucial exercise for any corporation involved with heavy supply chain computational analysis.
3.1 Functionality vs Purpose
We must examine the programs in regards to two different categorizations, the functionality of the programs, the actions of a program, and its purpose, the object or intent of a program in relation to supply
chain. Functionality is further broken down into two levels for this thesis to better align the framework with business application. One type of functionality is termed Type 1 Functionality and another termed
Type 2 Functionality. In this case, Type 1 is a basic building block and Type 2 pertains to a synthesis of Type 1 functionality into groupings that are directly applicable for business units. Purposes for specific programs are closely related to typical supply chain functions; Program A presents a solution for logistics while Program B may give an answer for inventory problems.
3.2 Type 1 Functionality
In conversations and interviews, it was found that supply chain experts would often focus on the functionality of a program as it pertained to their specific area of the supply chain. This includes categories such as modeling, simulation, optimization, and visualization. These functions are quite different and are not interchangeable, providing different types of solutions within a specific supply chain topic. However, most programs offer a blend of these functions and there is some overlap (such as Supply Chain Guru, iLog, or Plant Sim), so it is difficult to demarcate usage based on Type 1 functionality. These functions are defined below to provide a common frame of reference:
3.2.1 Modeling
Modeling is defined as the representation of the characteristics or behaviors of a selected system or process. In relation to supply chain, the model would be the analog for the desired supply chain function under examination. For example, an inventory model is any type of analog that shows the inventory
system under examination and may or may not allow some form of interaction. Models may be discrete or continuous, with discrete models sometimes containing the category of optimization since it pertains to a singular solution while continuous models are often related to simulation due to the processing of data over time. When we examine other works focused on supply chain modeling, we see that it is sometimes used interchangeably with simulation and optimization. To create a foundation upon which to evaluate
supply chain efforts, it is necessary to clarify the difference between modeling and the subsets of simulation and optimization.1 4
3.2.2 Simulation
Simulation is the imitation of the operation of a real world process or system over time. A key principal in the difference between general modeling and simulation is that the simulation is dynamic; it is an
evolution of modeling that calculates cause and effect as parameters change." Again, the industry is conflicted in the usage of this terminology.
Ozgtn
and Barlas, in their paper "Discrete vs Continuous Simulation: When does it matter?" utilize the definition of simulation to pertain to both discrete and continuous operations, though the discrete definition contains an iterative step clause.16 A winter conference of simulation experts highlights a difference between static-deterministic and dynamic-stochastic simulation, though this definition becomes more convoluted through the work." This paper will define modeling as static-deterministic and simulation as the dynamic-stochastic approach.3.2.3 Optimization
Optimization is the process or method of generating a solution as fully perfect, functional, or effective as possible given a set of constraint. Optimization may occur both in discrete or continuous scenarios. An
example of a discrete application of supply chain optimization is the determination of optimal inventory levels given set service level goals and supply chain response rates. Continuous optimization may occur in a simulation that spans a given period of time, providing optimized solutions over a specific time span given a sample rate.
A danger that arises from the pursuit of optimization is the belief that there is a singular optimal that can
be achieved for a given supply chain. In actuality, given the complexity of a modern network with tariff concerns, supplier constraints, logistic issues, promised service levels, external risk factor analysis, and more, a given set of parameters may actually yield a number of local optimal levels. The determination of which local optimal is the solution depends on the organization's business goals.
14 d' Apice et al., Modeling, Simulation, and Optimization of Supply Chains, 1-4.
15 Kleijnen, "Supply Chain Simulation Tools and Techinques: A Survey," 5. 16
Ozgun
and Barlas, "Discrete vs. Continuous Simulation," 1.3.2.3 Visualization
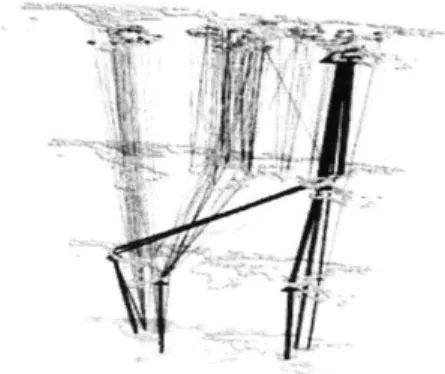
Visualization is the visual representation of abstract data to reinforce human cognition. Data, raw numbers, are conceptually difficult for the human mind to intuitively understand. Visualization is the transformation of these data into interpretable graphs, charts, maps, and other formats, allowing for rapid comprehension of trends and takeaways. Visualization is often utilized in conjunction with modeling, simulation, and optimization to facilitate understanding of the results. Unique methods of data
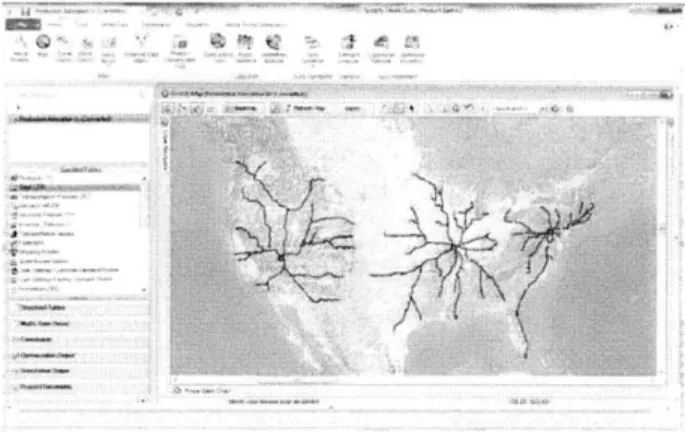
visualization can show different relationships that otherwise were not well understood. Figure 6 shows a sample visual representation of the connections between distributors with prime product facilities as well as secondary and tertiary suppliers.
Figure 6: Supply Chain Visualization
During the investigation of the programs that Caterpillar utilized, it was noted that every program had some form of visualization aspect where the collected data is presented in representative images. Another observation of interest was that corporate managers often placed significant emphasis on effective visualization, however the definition of what constituted effective visualization differed from person to person.
3.3 Type 2 Functionality
The previous definitions underscore the core functionality of the various programs that were examined through the project. But, those functions are not core to the needs of a corporate entity attempting to examine the usefulness of a variety of supply chain programs. Work at Caterpillar showed that all programs that were utilized in the corporate environment helped visualize information to some degree, most programs modeled and simulated, and some optimized. This rendered the Type 1 functionality categories as poor choices to use for ascertaining the usefulness of particular programs.
A different method of classification is necessary, one which pertains directly to a business application of a
program for its given supply chain purpose. This method, referred to here as Type 2 Functionality, separates supply chain software into three groups: dashboards, decision support, and real time updating. Utilizing these three categories aligns the programs with the results that are sought.
3.3.1 Dashboards
Dashboards are programs that present data in ways such that users can quickly understand and analyze the information presented. This functionality is comprised of modeling and visualization aspects. The
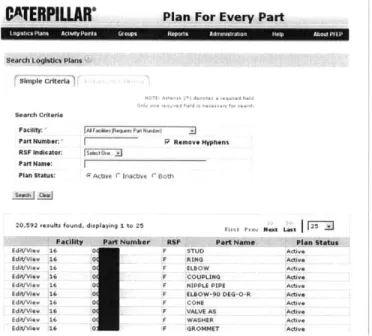
dashboard does not necessarily drive any decisions, but it allows managers and other employees to gain understanding of the situation that is examined. Within Caterpillar, an example of this is the Global Purchasing's Supplier Selection Analytics program, which does not model or analyze the data, but does reconfigure it into an accessible and workable format as well as the Plan for Every Part dashboard. Figure 7 below presents a screenshot of this type of dashboard as a reference point.
CATERPILLAR'
Plan For Every PartI oom- Pi-, Ar~ly vPoiis (,roup, Repwn e HOPmtu Ab-p ab InI
Search, qgs Plans Qi
Search Criteria
Facility: JAIFbcMi-(Rqu. PawtN-umb. e
Pan Number: F7 Remove Hyphens
RSF Indicator: c .d
Pan Name:
Plan Status: r Active C Inactive i Both
20,592 results found, displaying I to 25 F . .- N t Last F25
Pacilty Part Nuibl r EM' Part Nqe - Plan Statuq
Edit/Vie. 16 0 F STUD Active
Edit/Vie. 16 E F RING Actv.
Edit/Vis, 16 0 F ELBOW Ad.
Edit/View 16 E F COUPLING Activ.
Edit/Via, 06 0 F NIPPLE PIPE Acti.
Edit/Vi, 16 0 F ELBOW-90 DEG-O-R Active
Edit/Vie. 16 0 F CO E Active
Edit/View 16 0 F VALVE AS Active
Edit/Vie. 16 0 F WASHER Active
Edit/VIsw 16 0 F GROMMET ACtve
Figure 7: Plan for Every Part
3.3.2 Decision Support
Decision support tools encompass the functionality of programs that provide scenarios or estimates of situations to support complex supply chain decisions. Often, large scale projects or changes in the supply
chain concern multitudes of variables, complicating a supply chain manager's capability to ascertain viable solutions. Programs that provide decision support may utilize modeling or simulation to help frame the situation and may provide multiple possible scenarios for sensitivity/what if analysis. Decision support programs also include optimization programs that ideally give the single best answer based off of given constraints. Decision support often also includes significant visualization so that the presented solutions can be easily understood in ways other than raw numbers and data.
Work at Caterpillar and interviews with outside industry showed that these types of programs were in key focus for most supply chain groups. Interviews with three separate groups, two within Caterpillar and one external, revealed that earlier efforts (circa 2001-2005) in utilizing decision support programs had
provided solutions that were less than reliable, leading to undesirable executed outcomes. Now that computational power has advanced, these groups are returning to test the usefulness of this new
generation of supply chain software tools. Two multi-function decision support tools that were popularly tested were the Llamasoft Supply Chain Guru and the IBM iLog software suite.
..
-....
Figure 8: iLog Product and Inventory Flow Analyst
3.3.3 Real Time Updating
The third type of functionality, real time updating, is in many ways similar to dashboards in that both are focused on data presentation. The difference though, is that real time updating typically utilizes
significantly less modeling or simulation regarding data and is focused on the instantaneous visualization of current data. Robust supply chain tracking procedures are required for the proper execution of real time updating. This additional step to having a real time element to the data is a significant barrier and a separate challenge compared to those found with creating dashboards. If improper updates or missed updates occur frequently regarding the tracking of products, facilities, or suppliers, then the real time updating program will function at a substandard level. An effective real time updating system may involve significant investment in training, money and time to ensure proper execution, however real time updating programs provide managers an advantage in situations where reaction speed to supply chain issues would significantly impact the company's revenue stream. Caterpillar utilizes a central global supplier center (GSC) to track their global supplier network as well as barcode scanning programs at facilities to effectively monitor instantaneous inventory levels. Amazon would be an example of a company that leads the pack in efficient real time updating as they keep track of every single item in their warehouses as well as the in-transit location of every order that a customer places.
3.4 Purpose
To understand whether the multitudes of groups within Caterpillar, or any other company, that are pursuing various supply chain software implementation routes may be overlapping or missing key needs, we must understand the purposes for these programs. Supply chain software must answer or simplify key questions about the fundamental supply situation that planners cannot easily accomplish on their own. The purposes of these programs therefor relate to specific supply chain functions. When dealing with a company's supply chain, managers must understand the inventory policies, the supplier policies, the transportation policies, the overall interconnection of these previous categories, and then the long term interaction of the supply chain.
3.4.1 Facility Planning
Facility planning and design is often worked around the optimization of the flow of parts through the production process. At Caterpillar, this was typically the purview of manufacturing engineers and was a manufacturing focused domain. However, such an assumption regarding facility design is shortsighted as
corporations, including Caterpillar, not only maintain inventory at manufacturing sites, but also operate warehouses that focus on the distribution of parts and goods. When dealing with the movement of goods, mangers must undertake a micro supply chain and logistics focused approach to ensure maximum
efficiency. By utilizing a number of supply chain oriented facility design programs, managers may reduce distances moved or improve choke points, which translates to less wasted time, and better utilization of floor space, allowing more items to be stored in the same space.
3.4.2 Inventory Management
Inventory issues revolve around parts/raw material inventory, work in process inventory, or finished goods inventory. Questions in this realm pertain to how much should be on hand based on typical supply chain metrics such as target service level or responsiveness. Less sophisticated companies often have incorrect inventory levels, which may result in overstock situations wherein unnecessary financial resources are tied up, or understocking events wherein service level is impacted. Decision support requirements at Caterpillar focused heavily on optimization of inventory levels based on costs, service levels, lead times, and other supply chain constraints. Emphasis is often placed on this particular category as it is more readily adjustable. While at Caterpillar, two high visibility efforts in supply chain
improvement revolved around inventory optimization, further highlighting the importance of this subject. Also important for inventory management, though rarely mentioned during the study period, is the usage of real-time monitoring programs that gather and display current inventory data to ensure accurate control of the parts and product inventory.
3.4.3 Sourcing
Companies that produce large and sophisticated products often have tremendously complex sourcing issues as they deal with multitudes of suppliers and related contracts. In this regard, Caterpillar is no exception and has dedicated an entire business unit to ensuring that sourcing requirements are met in the most advantageous way possible. Supply chain programs exist in this field to provide decision support by determining the optimal supplier strategy among a group of potential suppliers (single source vs multi source, risks involved, overall costs) as well as presenting information regarding the performance of select suppliers. Visualization plays a significant part in real-time updating for sourcing needs, as shown
3.4.4 Transportation
Caterpillar was actually one of the nation's largest providers of third party logistics services until they recently divested that business. However, close ties to the divested business and a still sizable internal group dedicated to transportation and logistics ensures that this area remains a core competency. Supply chain programs serve to address decisions pertaining to the movement of goods both within the
corporation and externally to dealers or customers. Some transportation decisions are simplistic as there may be only one major vendor that takes a specific route, but often companies need to deal with the
option of many different transportation methods that offer different lead times and costs. The business needs within this category are addressed using some form of decision support software to optimize deliveries and real time updated programs to show the instantaneous location of a shipment of parts or products.
3.4.5 Network Design
As companies become more sophisticated in their approach to supply chain issues and requirements, managers realize that finding a solution to a specific aspect of the supply chain system, such as sourcing or transportation, may seem optimal. However, closer inspection may reveal that, due to the
interconnectedness of the entire supply chain, a local optimization for the supply chain may be executed to the detriment of a different aspect of the supply chain. An example of this situation is if transportation costs were minimized, yet inventory levels needed to increase by 50% in order to meet promised service level, then a net negative result occurs. Network design programs' purposes are to connect and determine the interactions of these relationships. The programs often utilize simulation capability to give different scenarios based on chosen constraints and may also search for an optimal solutions.
3.4.6 Long Term Strategic Planning
This is the final supply chain related purpose that is of special interest to business activity and it is one that is strongly related to Network Design. Long Term Network Planning is the examination of the supply chain over a larger time horizon and typically involves taking into consideration additional factors not considered in pure supply chain analysis. Some additional variables may be to include addressing difficult to define long term risks (ex: political instability and natural disaster) and difficult to predict shifts (ex:
labor rates, taxation adjustments, 3PL rate/size/efficiency changes). In many ways this is an evolution of Network Design to the Nth degree; however, problems occur when complexity is taken too far and goes
beyond even modem computational capability. Also, the predictive nature of these programs is far less exact and the solutions presented must be viewed critically before any decisions are executed.
4 Caterpillar as a Case Study
4.1 Business Units Involved
Caterpillar, similarly to other Fortune 500 companies, consists of multitudes of business units responsible for varying functions. As stated earlier in the thesis, Caterpillar is relatively decentralized. Individual business units have a substantial amount of autonomy when making decisions, though in recent years a centralizing force is progressing through the company. This is shown in the recent development of the Caterpillar Enterprise System Group (CESG), a new order-to-delivery organization building on the foundation of 6 Sigma and the Caterpillar Production System. This section of the thesis aims to highlight some of the major participants in the supply chain software usage field, some of the programs they have focused on, and how those programs fit into the supply chain program categorization framework. It is observed that the five major groups typically specialize in one of the supply chain program purposes mentioned earlier, though overlap occurs, especially regarding network design and long term strategic planning.
Global Purchasing (GP): This group is responsible for the contracting and supplier management for
Caterpillar. The alignment between Global Purchasing and the sourcing category is inherently direct. Sourcing has been an area of strong interest for Caterpillar due to the vast numbers of suppliers that Caterpillar has to deal with. Therefore it logically follows that Global Purchasing has invested time and effort in simulation and visualization based programs to help manage the large supplier network.
Caterpillar Logistics: Though this division of Caterpillar has changed in recent years, the work done in
the field is still reflective of the focus that was put in place. There are relatively mature programs
dedicated to optimization the loads on a shipment, tracking of these shipments, and some optimization of routes utilizing JDA Cast. Oceanic transportation has generally not been optimized due to the
comparatively low selection of oceanic trade routes and ports, meaning there is little to optimize.
Caterpillar Production System (CPS): Inventory optimization is a more nebulous category. It is the
responsibility of the individual facilities to manage their inventory levels, tied into purchasing to help ensure the flow of those parts meets needs. But there is not an official Caterpillar Inventory Management
Team. The closest and de-facto owner of this is then CPS, which manages overall production improvements and process improvements. With that, CPS has generated a number of programs to facilitate the inventory level decisions for the enterprise. Other groups, to include PD> and Logistics have taken forays into the inventory optimization category with their parallel investigations into iLog, Cast, and Logistics R&I's work, but CPS continues to appear to be the lead in this area. This is relatively new for Caterpillar and initial pilots within each of these programs show realistic and significant savings. The opportunity here is to continue to utilize these programs, but consolidation is necessary to ensure maximum expertise, highest efficiency, and lowest execution cost (when including licensing, training, R&D, etc).
Product Source Planning (PSP): PSP owns the support function for the long term strategic planning.
The GPNP process is the official current enterprise level program to support these long-term decisions. Often product groups independently create their long-term plans and then have PSP run the GPNP process as a sanity check. It works well for its purpose, which is to help determine the financial suitability of a project, taking into consideration supply chain as well as other business factors. Its low resolution has been adequate in balancing expediency with detail. Commercial programs show potential to augment
GPNP capability, but this may only occur once the programs (likely Supply Chain Guru or iLog) are
properly established with appropriate data and constraints.
Product Development and Global Technology (PD>): The facility planning role traditionally fell
to product or operations groups in charge of creating a new facility and various PD> support personnel. The focus was on creating the facility and optimizing the layout for the production
line.Logistics Research and Innovation partnered with PD>to apply Plant Simulation to high traffic warehouses, and it seems to be a reasonable adaptation of the original program. However, because of the special conditions under which such optimization may be of significant monetary value, there has not been much additional push in this field. What Logistics R&I is pursuing appears to be sufficient if it can be tied into the facility design process with the Product group and PD> teams.
The following sections and figures illustrate the current break down of Caterpillar's supply chain software efforts placed within the categories mentioned previously. The diagrams are further segregated into different decision tiers, the approximate organizational level at which the tools and the questions they address should be utilized. This framework supported the understanding of issues, redundancies, or opportunities. This thesis provides some description of the capability of the various programs to give
context, but does not go into specific detail to maintain Caterpillar's competitive advantage in supply chain program usage.
4.2 Frameworks Applied to Caterpillar
The programs listed are only those that are utilized within Caterpillar and have wider applicability than a specialized local Excel model. This means that additional commercial offerings were not evaluated unless there was a gap in Caterpillar's toolkit coverage and multitudes of local Excel models were not
mentioned. Some groups separated their supply chain analysis based on time horizon of the program, but most programs can be utilized for a variety of time horizons based on need so that is likely not as
applicable to corporate decision making regarding which programs to utilize.
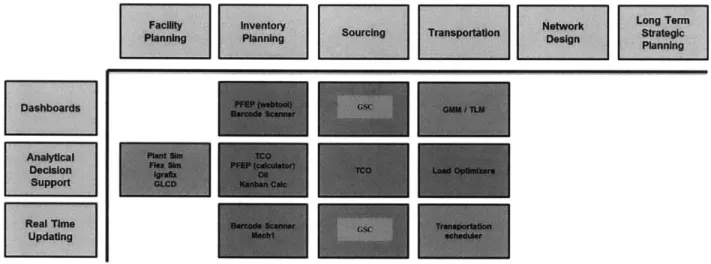
4.3 Operational Decision Level Programs
Figure 10: Operational Level Tools (Facility Level)
Caterpillar maintains a significant number of programs available for facility planning at the operational level. Two in particular, the Tecnomatix Plant Simulation and FlexSim programs are adapted from the production line engineering prospective. These programs can be utilized to examine local level supply flow, which Caterpillar adapted into their internal program, the GLCD. There is however an opportunity to reduce some redundancy. A closer examination of FlexSim and its competitor, Tecnomatix Plant Simulation, show that they are fundamentally the same program. Both revolve around programming
highly flexible nodes to serve as processes, can utilize programmable modules, and offer some form of
visualization support. The framework in this case helps highlight the density of programs with facility planning, allowing managers to then weigh licensing and training costs as they consolidate efforts.
The inventory planning and sourcing categories contain programs focused on making specific part level decisions or understanding material information at the facility level. Caterpillar's Barcode Scanner program utilized in Decatur is an example of an excellent internal inventory tracking program, both in regard to the software and in the Decatur facility's implementation of the program. There is significant discipline and effort required to ensure such a program is successful though. Often other facilities had more simplistic programs, a behavior that was found in external companies as well.
The framework also highlights four programs - TCO, PFEP, Oil and Kanban Calculator - in decision support, all Caterpillar internally created modules that addressed specific inventory and sourcing concerns. Seeing these four programs together helped focus the investigation on the history and purpose of these programs. It was ascertained that there is an opportunity to simplify the toolkit available by consolidating these programs into a singular updated offering.
Less research emphasis was placed on the sourcing and transportation categories at this level as well as at the tactical level. Caterpillar had distilled their needs in those areas and was much more focused regarding what decision support, dashboards, and real time updating they required for the sourcing and
transportation.
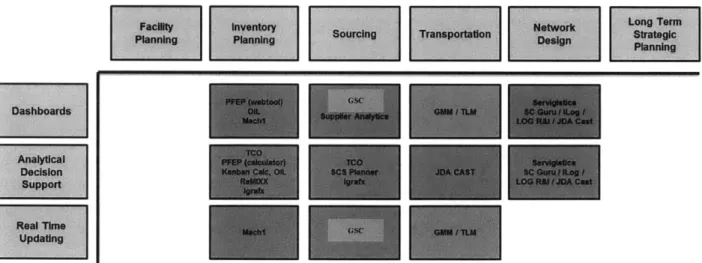
4.4 Tactical Decision Level Programs
The tactical level, defined here as the decision level for product groups, shows the introduction of network design. Inventory planning, sourcing, and transportation programs remain somewhat similar to the facility level. The level of detail examined by some of the programs may change, and some
constraints may be adjusted or results may be aggregated, but the usage is the same. The tactical level is also the focal decision level for the industry comparative investigation.
The network design category is an area of significant contention, and this ended up being the point of many discussions and a significant portion of this project's time. Much of the overlap that is occurring within Caterpillar happens in the network design category, as it is quite new to the organization (it is also a new area of development for most of the external companies). Correctly categorizing the supply chain software at this decision level focused an examination into network design.
It was ascertained, after learning the functionality of the various network design offerings (Supply Chain Guru, iLog, Cast, Logistics R&I's in-house program, and Servigistics), that each of these programs functioned similarly. The fundamental mathematical models behind each simulation/optimization program (all offered both capabilities) was similar (mixed integer programming was the typical method) as were the visualization capabilities. None of the programs displayed significant weakness or lack of functionality when compared to the others, though ease of use and ease of data entry differed. The input of constraints, which had significant impact on results, also differed, but the programs could likely be made to look very similar at the hands of experienced users. Logistics R&I claimed that their modeling method differed and offered a more robust solution while also better addressing Caterpillar's specific supply chain issues (high value, low turns, highly complex), but with the natural variability in simulation solutions based on differently designed constraints, it was difficult to ascertain a substantial dissimilarity. Therefore, we can see an opportunity for consolidation within the five network design programs.
Of note regarding the network design programs was their capability to perform inventory planning
decision support. The framework illustrates how these programs, nascent in their adoption within
Caterpillar, were not fully implemented for inventory planning. Caterpillar's enterprise level groups were investigating SC Guru and iLog for inventory planning at the strategic tier and so we see a future
opportunity to bring some computational capability to a lower decision level.
For the commercial programs, anecdotal evidence suggested that Supply Chain Guru was possibly more user friendly and robust than Cast or iLog. Also, some external corporations mentioned dissatisfaction in the computational capability or accuracy of the latter, leading them to change to Supply Chain Guru. It
must be observed that computational power plays a significant role in the success of these optimization and simulation programs and dissatisfaction arose from usage of earlier versions of those programs. Now that some modem laptops are as powerful as entire networks from the early 2000 era, computational power and the ability to deal with vastly more constraints and variables have significantly increased. This increases the ability of simulation programs to actually simulate and model, meaning a return to Cast or iLog may prove significantly more fruitful. Conversely, Supply Chain Guru may not have fared any better on platforms from 10-15 years ago.
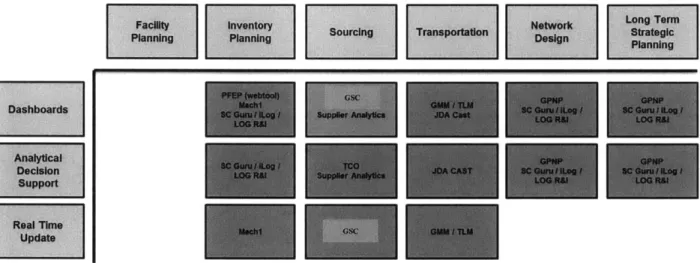
4.5 Strategic Decision Level Programs
Figure 12: Strategic Level Tools (Product Group Interactions, Enterprise)
The final level of corporate decision-making is the strategic level, which constitutes supply chain decisions that must be made at the highest level of the enterprise, often affecting multiple business units
or even the entire corporation. Most of the programs are unwieldy to be utilized at this level, as often they are too detailed. This was apparent when enterprise support groups no longer utilized the TCO for high level decision making (not to say they did not use the TCO for discrete inventory part analysis when necessary). The typical behavior found here is to use massive amounts of lower resolution data to understand the aggregate, visualize it into an easy to understand format, and then make decisions on this type of information.
A number of programs from the lower levels carry over, though their suitability is not excellent. The TCO
analysts who are curious about a specific item outside of the aggregate or items that are either difficult and/or expensive to procure.
Some programs, such as the supplier analytics dashboard and the global supplier center truly come into focus here as this was what they were intended to perform. The supplier analytics dashboard gives analysts and managers in Global Purchasing a way to understand the overall performance of thousands of suppliers combined with the capability to closely examine specific suppliers. The global supplier center takes a similar approach and gives a real time visual of the status of the worldwide distribution network, a view that at times can be crucial to the enterprise's rapid response to a major crisis.
Finally, we return to the categories that the majority of Caterpillar groups interested in supply chain optimization and visualization are investigating, network design and long term strategic planning. Network design is not significantly different in how it is utilized, but the complexity increases
significantly due to meshing the requirements of two different business units on a joint venture or adding a facility that affected a number of groups. The caution here is to find the correct level of detail, which may change from one scenario to the next and was highly subjective. For instance, a highly complex and difficult to move part may require analysis of various taxation laws, capabilities of logistics companies, and stability of the work force, and more as well as how these factors may interact or change in the near future. Conversely, designing in a new fastener manufacturing plant may mean cheap transportation responsiveness is the only significant factor. Much of this is dependent on how familiar a manager is with the capabilities of a specific simulation or optimization engine as well as how much time and effort the manager truly wants to spend.
At Caterpillar, the long term strategic design planning category has long been a purview of the GPNP process, which entails data collection from a variety of sources, to include supply chain related information, and then processing that informationThe decisions here are slightly different from exact planning, as it is not an exact footprint that is sought, but a roadmap for how the future may look. This means that simulation and scenario development, rather than optimization are critical. Analysts examine if something should be done, what are the general implications, and what may happen if these changes occur in the future. However, there is room for improvement as the GPNP program is not as detailed in the supply chain analysis as Supply Chain Guru, Logic Net, or Logistics R&I's programs. Further study needs to be conducted to see if these newer supply chain specific programs may be suitable to either accompany the current solver or possibly replace it as a different and more detailed alternative. The caveat to this idea is that new programs may offer more detail than necessary and may significantly
prolong the timeframe to collect and process data, thereby delaying decision-making. However, a robust implementation of SAP and other integrated data platforms may reduce the effect of this issue.
4.6 Conclusions from this Application
Applying the supply chain program categorization framework was useful to understand the program ecosystem that Caterpillar had within the corporation. Before, with only the list of programs used within Caterpillar, it was difficult to judge how well Caterpillar's supply chain needs were addressed. Now, conclusions regarding program redundancy and shortfalls were readily apparent. It is shown that the sourcing and transportation purposes are fulfilled with only a few major programs. These supply chain categories were historically contained within dedicated business units, showing how such centralization can streamline program usage. The inventory planning category contains more options at all decision levels, relating to how this has been more of a decentralized issue within Caterpillar. It was assessed that opportunity exists to consolidate some of these programs into a more cohesive offering, thereby reducing complexity, training requirements, and improving ease of knowledge transfer. Finally, the framework reinforces the segmentation that occurs in network planning and long term strategic planning as these are areas of new focus for Caterpillar.
The inferences made from the supply chain categorization framework allowed for the subsequent development of a multigenerational project plan specific to Caterpillar. This project plan was distilled in this paper for application to other corporations.
5
General Multigenerational Project Plan
The long term strategy that Caterpillar needs to adopt to ensure a continuous leading position in supply chain management revolves around addressing two specific issues, which are enhancing coordination and ensuring correct application of the programs that are already utilized. This relates to a concept espoused
by Llamasoft, which is the Supply Chain Center of Excellence.'8 The multi-generational project plan
generated while at Caterpillar revolves around the establishment and usage of such a group within the corporate context. The following plan in Figure 13 is an example of this plan when applied to Caterpillar, but can be easily adapted to other large companies: