HAL Id: hal-02475989
https://hal.archives-ouvertes.fr/hal-02475989
Submitted on 13 Feb 2020
HAL is a multi-disciplinary open access archive for the deposit and dissemination of sci-entific research documents, whether they are pub-lished or not. The documents may come from teaching and research institutions in France or abroad, or from public or private research centers.
L’archive ouverte pluridisciplinaire HAL, est destinée au dépôt et à la diffusion de documents scientifiques de niveau recherche, publiés ou non, émanant des établissements d’enseignement et de recherche français ou étrangers, des laboratoires publics ou privés.
Neural entrainment to music is sensitive to melodic
spectral complexity
Indiana Wollman, Pablo Arias, Jean-Julien Aucouturier, Benjamin Morillon
To cite this version:
Indiana Wollman, Pablo Arias, Jean-Julien Aucouturier, Benjamin Morillon. Neural entrainment to music is sensitive to melodic spectral complexity. Journal of Neurophysiology, American Physiological Society, 2020, �10.1152/jn.00758.2018�. �hal-02475989�
Neural entrainment to music is sensitive to melodic spectral complexity
Indiana Wollman1, 2, *, Pablo Arias3, Jean-Julien Aucouturier3, Benjamin Morillon4
1 Montreal Neurological Institute, McGill University, Montreal, Canada 2 Cité de la musique - Philharmonie de Paris, Paris, France
3 IRCAM-CNRS-Sorbonne Université, UMR 9912 STMS, 75004 Paris, France 4 Aix Marseille Univ, Inserm, INS, Inst Neurosci Syst, Marseille, France * Corresponding authors
Corresponding author:
Dr. Indiana Wollman
Montreal Neurological Institute McGill University
Canada
Abstract
During auditory perception, neural oscillations are known to entrain to acoustic dynamics but their role in the processing of auditory information remains unclear. As a complex temporal structure that can be parameterized acoustically, music is particularly suited to address this issue. In a combined behavioral and EEG experiment in human participants, we investigated the relative contribution of temporal (acoustic dynamics) and non-temporal (melodic spectral complexity) dimensions of stimulation on neu-ral entrainment, a stimulus-brain coupling phenomenon operationally defined here as the temponeu-ral co-herence between acoustical and neural dynamics. We first highlight that low-frequency neural oscilla-tions robustly entrain to complex acoustic temporal modulaoscilla-tions, which underscores the fine-grained nature of this coupling mechanism. We also reveal that enhancing melodic spectral complexity, in terms of pitch, harmony and pitch variation, increases neural entrainment. Importantly, this manipula-tion enhances activity in the theta (5 Hz) range, a frequency-selective effect independent of the note rate of the melodies, which may reflect internal temporal constraints of the neural processes involved. Moreover, while both emotional arousal ratings and neural entrainment were positively modulated by spectral complexity, no direct relationship between arousal and neural entrainment was observed. Overall, these results indicate that neural entrainment to music is sensitive to the spectral content of au-ditory information and indexes an auau-ditory-level of processing that should be distinguished from high-er-order emotional processing stages.
Keywords: auditory perception, emotion, neural oscillations, arousal, temporal envelope, EEG New and Noteworthy
Low-frequency (<10 Hz) cortical neural oscillations are known to entrain to acoustic dynamics -the so-called neural entrainment phenomenon-, but their functional implication in the processing of auditory information remains unclear. In a behavioral and EEG experiment capitalizing on parameterized musi-cal textures, we disentangle the contribution of stimulus dynamics, melodic spectral complexity and emotional judgments on neural entrainment, and highlight their respective spatial and spectral neural signature.
Introduction
Cortical neural oscillations are assumed to play a functional role in perception and cognition. Low-frequency oscillations in the delta-theta range (<10 Hz) in particular are known to play a mechanistic role in sensory selection, by sampling input signals and structuring the temporal activity of sensory cor-tices (Luo and Poeppel, 2007; Schroeder and Lakatos, 2009; Ghitza, 2012; Giraud and Poeppel, 2012; VanRullen, 2016; Riecke et al., 2018). When rhythmic inputs – such as speech or music – are per-ceived, these cortical oscillations tend to become coupled with the slow modulations present in the stimulus’ temporal envelope (which mirrors how sound intensity fluctuates over time). This coupling phenomenon is broadly termed neural entrainment (Ding and Simon, 2014; Haegens and Zion-Golumbic, 2017; Rimmele et al., 2018). Neural entrainment has been primarily studied in the context of speech perception, during which it occurs principally at the syllabic and prosodic rates (Doelling et al., 2013; Zion Golumbic et al., 2013; Vander Ghinst et al., 2016). It was shown to be modulated by the spectro-temporal fine structure of the acoustic input (Ding et al., 2013) as well as by intelligibility (Peelle et al., 2012; Gross et al., 2013). However, the relative contribution of low-level auditory and high-level cognitive processes to neural entrainment, and the functional role of low-frequency oscilla-tions in the processing of sensory information are current matters of debate (Ding and Simon, 2014; Kösem and van Wassenhove, 2016; Steinmetzger and Rosen, 2017).
Like speech, music has a rhythmic temporal structure (Ding et al., 2017), with systematic patterns of note onsets, accents and grouping (Patel, 2008). A recent study pointed to similar entrainment proper-ties during music perception (Doelling and Poeppel, 2015). Yet, contrary to speech, perceptual analysis of musical pitch sequences occurs preferentially in the right auditory cortex (Zatorre et al., 1994; 2002), which is known to operate at a slower oscillatory regime (Giraud et al., 2007; Morillon et al., 2012) and to have a better sensitivity to slow acoustic temporal modulations than its left counterpart (Abrams et al., 2008; Gross et al., 2013). Importantly, music has the capacity to carry strong expressive content, inducing feelings and thoughts (Juslin and Västfjäll, 2008), and music-induced emotions arise from the functional interaction between subcortical areas such as the striatum and amygdala and auditory corti-cal areas (Salimpoor et al., 2013; Liégeois-Chauvel et al., 2014; Salimpoor et al., 2015). Besides, pre-vious research revealed that musical expressions can be accurately predicted using a limited set of low-level acoustic cues including average and variability values of temporal features (e.g. sound low-level, tem-po, articulation, attack velocity), as well as spectral content (Juslin and Laukka, 2004). Based on these findings, we hypothesized that neural entrainment to musical stimuli is, like for speech, sensitive to acoustic dynamics (temporal factor), but that it is also modulated by a non-temporal dimension of stim-ulation: music spectral complexity.
To investigate these issues, we conducted a combined behavioral and EEG experiment in which participants were asked to listen to short musical excerpts and to assess their emotional reaction through self-reported valence and arousal ratings. We used a generative music algorithm designed to synthesize original musical textures with defined expressive content, such as happiness or sadness or a mixture of the two (Beller, 2009). To control for the spectral complexity of musical excerpts and in
or-der to disentangle the impact of music spectral complexity on neural entrainment from the one of tem-poral modulations, we generated control versions of the original melodies (hereafter called “neutral stimuli”), with preserved temporal envelopes but reduced complexity in terms of pitch, harmony and pitch variation. For the sake of brevity, in the following, we simply use the term “complexity” to refer to these spectral aspects of melodic complexity. Of note, in the present research, neural entrainment was operationally defined as the temporal coherence between the temporal envelope of the musical ex-cerpt and the concomitantly recorded EEG activity. Ultimately, this design allows us to investigate whether and how music complexity (original vs. neutral stimuli) and neural entrainment impact behav-ior (participants’ emotional ratings).
Materials and Methods
This study is composed of a preliminary behavioral experiment, whose aim was to validate our stimuli and design, and a subsequent EEG experiment, in which the exact same material and behavioral task were used.
Participants. Eight healthy volunteers participated in the preliminary behavioral experiment (6 men;
mean age 20 ± 4 yr; age range 18–30 yr) and twenty other healthy volunteers in the combined behav-ioral and EEG experiment (11 men; mean age 23 ± 3.8 yr; age range 18–32). All participants were right-handed and had normal audition (<20 dB loss per ear and frequency band between 125 Hz and 8000 Hz), verified with an audiogram test prior to the experiment. They provided written informed consent prior to the experiment, which was approved by the local ethic committee.
Emotion-Based Musical Synthesizer. Stimuli were generated using the Emotion-Based Musical
Syn-thesizer (EBMS; (Beller, 2009)), a computer music tool written in the Max programming language (Cycling ‘74, San Francisco, CA). EBMS algorithmically generates original musical textures of arbi-trary duration, which are meant to convey either a pure emotion (happy/sad/fearful/angry) or a mixture thereof (i.e. a linear combination of the above). In more details, the algorithm generates simple pseudo-random sequences of notes, in the MIDI format (Musical Instrument Digital Interface; a technical standard for musical notation and communication), whose musical parameters can be controlled along parameters known to correspond to stereotypical musical features of emotional expressions (Juslin and Laukka, 2004): speed (happy: high / sad: low), intensity (happy: high / sad: low), pitch (happy: high / sad: low), mode (happy: major / sad: minor), pitch and intensity variation (happy: large / sad: small). Since its creation, EBMS was used in several contemporary music pieces and art installations (Dorsen, 2015), but to the best of our knowledge, it is the first time it is used for experimental research.
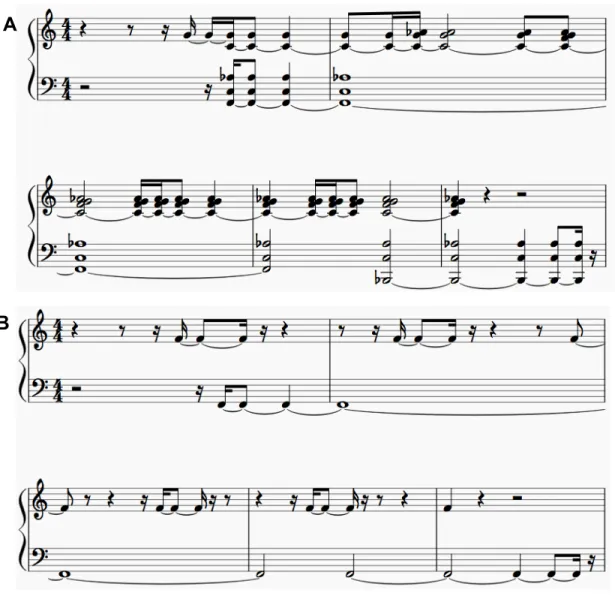
Original stimuli. Twenty-one 8-sec expressive piano stimuli were generated using EBMS (see
exam-ples on Supplemental Fig. S1 - https://doi.org/10.6084/m9.figshare.11568999). All excerpts were com-posed of two monophonic lines, one melodic line played on the right hand/high register of the piano, and one individual-note accompaniment line played on the left hand/low register of the piano. Excerpts were generated in the major/minor keys of B, C and F in equal proportions, and were selected from the algorithm’s random output so that they sounded as different as possible from one another. We restricted the set space of emotions to two dimensions categories (over the four offered by EBMS) in order to maximize the recognition of emotions. Melodies were thus generated using parameters meant to ex-press a mixture of happiness and sadness. The relative percentages of these two ‘emotions’ in the mix-tures were set based on informal testing.
Neutral stimuli. In addition to the twenty-one expressive excerpts generated with EBMS, we manually
generated twenty-one matched (in terms of acoustic envelope) “neutral” versions of the same stimuli, using the following procedure. We considered that the neutral version of an originally expressive mel-ody composed of various pitches is simply the repetition of a unique pitch of the same instrument tim-bre, all other acoustical features (intensity and rhythm) being matched. Taking advantage of the MIDI format, for each excerpt, we extracted the first note played in the melodic line and replaced all
subse-quent pitches in the line with this first pitch (for original stimuli meant to express either happiness or sadness only, all pitches in the melodic line were replaced with the pitch of the key in which the origi-nal excerpt was generated). Similarly, we replaced the accompaniment/left-hand line of each excerpt by the repetition of a single note two octaves lower than the one selected at the right hand. The neutral version thus contains one single pitch class, doubled two octaves apart. Importantly, while this proce-dure drastically reduced the spectral complexity of the excerpts linked to pitch, harmony and pitch var-iation, it preserved the original excerpt’s temporal envelope (Fig. 1). Our design thus separates tem-poral and non-temtem-poral dimensions of musical excerpts.
Experimental setup. During both the behavioral and EEG experiments, participants were seated in
front of a computer interface coded in python using the psychopy module (Peirce, 2007). Acoustical stimuli were presented binaurally through Sennheiser HD650 headphones during the preliminary be-havioral experiment and through Sennheiser CX 300-II earphones during the EEG experiment, at com-fortable level (around 60 dB SPL). EEG was recorded using a BrainProduct actiCHamp system (Brain Products GmbH, Germany) with 64 electrodes (international 10-20 localization system), a sampling rate of 500 Hz, and high-pass (cutoff frequency: 0.06Hz) and low-pass (cutoff frequency: 140Hz) online filters. One additional electrode was placed on the left side of the nose and set as reference. Im-pedances were kept under 10kΩ. To reduce the amount of eye movements during the EEG recording, participants were instructed to look at an on-screen fixation cross during stimulus presentation. Eye movements were monitored with two sets of electromyography bipolar electrodes (BIP2AUX adapter) placed above and below the left eye and at the outer canthi of both eyes, which were bipolarized off-line to yield vertical and horizontal electro-ocular activity (EOG), respectively. EEG recordings and stimulus presentation were synchronized using Cedrus StimTracker.
Experimental design. The goal of the EEG experiment was to investigate whether and how neural
en-trainment is modulated by the complexity of the musical material used, in binaural diotic listening con-dition. Each of the twenty-one original and twenty-one neutral melodies was presented once, in random order. Overall, these manipulations resulted in two experimental conditions (“original”, “neutral”). The experiment lasted approximately 30 minutes.
Behavioral task. In each trial, participants first listened to the excerpt. After the offset of the sound,
participants were asked to appraise the emotional content of the excerpt by first rating its perceived arousal and then its perceived valence. Ratings were acquired on two separate visual analogic scales (with twenty steps) going from “not emotional” to “highly emotional” for arousal, and from “negative” to “positive” for valence. Participants were specifically instructed to use the entire scales, i.e. that they should rate the recognized emotional content of the excerpt relatively to the set of melodies presented during the experiment. Once the answers were submitted, the next trial started.
Data analysis. Acoustic preprocessing. To estimate the temporal envelope of each melody, the sound
signal (synthesized with a piano sound using the MIDI output of EBMS) was decomposed into thirty-two narrow frequency bands using a cochlear model, and the absolute value of the Hilbert transform was computed for each of these narrowband signals. The broadband temporal envelope resulted from
the summation of these absolute values, and was used as the acoustic signal for all subsequent stimu-lus-brain coherence analyses (Chandrasekaran et al., 2009).
EEG preprocessing. Preprocessing of EEG data was performed following the standard procedure of
Brainstorm (Tadel et al., 2011). Briefly, electrical artifacts were removed using low-pass filtering (at 40 Hz), slow drifts using high-pass filtering (at 0.3 Hz), and eye blink artifacts using source signal projec-tions through principal component analysis.
Stimulus-brain coherence. In order to quantify the neural entrainment induced by the acoustic signal,
we computed the stimulus-brain coherence, a measure that quantifies in the spectral domain the syn-chronization between the acoustic envelope and the EEG neural signal. Importantly, coherence (in con-trast to phase-locking value) considers both phase and amplitude estimates in the measurement of the relationship between the two signals (Lepage and Vijayan, 2017). Importantly, this metric captures the similarity in the dynamics between two signals and is blind to their actual overall amplitude. Coherence was computed for each participant and experimental condition (“original”, “neutral”) according to the following steps. The acoustic and EEG signals were resampled at 128 Hz and segmented into 8-sec epochs. In accordance with prior studies on neural entrainment, we restricted our analyses to the low-frequency range ([1-10] Hz; e.g., (Ding and Simon, 2014)). A time-low-frequency decomposition was per-formed by estimating the complex-valued wavelet transform of both acoustic and EEG signals in this frequency range (0.5 Hz resolution) using a family of Morlet wavelets (central frequency of 1 Hz, time resolution (FWMH) of 3s, i.e. three cycles), with a zero-padding approach to minimize boundary ef-fects. These complex-valued signals were then separated into phase angle and amplitude information, and the epochs belonging to the same experimental conditions were concatenated. Finally, for each par-ticipant and condition, stimulus-brain coherence was computed over time, which here corresponds to the time duration of all concatenated trials (t ranging from 1 to n), following (Lepage and Vijayan, 2017): 𝐶",$ = &' 𝐴$,)*)+,. 𝐴 ",$,) ./0+1. 𝑒+.(45,67689:4;,5,6<=>8?) 1 )AB & C'(𝐴$,)*)+,)D 1 )AB . '(𝐴",$,)./0+1)D 1 )AB E (1) where 𝐶",$ corresponds to the coherence estimated at EEG channel c and frequency f (from 1 to 10 Hz), 𝐴$,)*)+, and 𝑃
$,)*)+, respectively the amplitude and phase angle of the acoustic signal, and 𝐴./0+1",$,) and
𝑃",$,)./0+1 respectively the amplitude and phase angle of the EEG signal.
The EEG power response spectrum was additionally computed. The modulus of the complex-valued EEG signals obtained as described above was squared to obtain EEG power estimates, transformed in decimal logarithmic units (so that they follow a Gaussian distribution), baselined with the 2 sec period preceding each trial, and finally averaged over time to obtain the spectrum per channel and frequency (between [1-10] Hz).
We also computed the acoustic temporal modulation spectrum (i.e., the spectrum of the temporal enve-lope) by averaging over time the modulus of the complex-valued signals obtained as described above. Finally, we computed the coherence between the acoustic envelopes of the original and their matched neutral melodies, in order to estimate the similarity (both in terms of phase and amplitude) between the two categories of melodies, by applying the same routine as described above.
For the specific generalized linear mixed model (GLMM) regression analyses (see below), stimulus-brain coherence was re-estimated per stimulus, i.e. per trial, using a leave-one-trial-out (LOTO) ap-proach (Gluth and Meiran, 2019). With this method, the stimulus-brain coherence value of one particu-lar trial is estimated by taking the difference between the parameter estimate for the complete dataset and for the dataset with one omitted trial (corresponding to the trial of interest). The parameter estimate for the complete dataset was then added to each stimulus’ estimate to center them around the mean. This method is particularly suited for datasets with low signal-to-noise ratios, such as EEG data.
Statistical procedures. All analyses were performed at the single-subject level before applying
stand-ard nonparametric two-sided paired statistical tests at the group level. Behavioral data were submitted to Wilcoxon and Friedman tests. Where applicable, categorization of stimuli by emotional arousal into high and low arousing stimuli was based on a median split (on the 42 stimuli). Stimulus-brain coher-ence and EEG power measures were submitted to cluster-based permutation statistics (1000 permuta-tions; 𝛼-cluster level = 0.005), computed across electrodes and frequencies (Maris and Oostenveld, 2007). Finally, to estimate the robustness of our results, we present behavioral results from two inde-pendent datasets (preliminary and main experiments), and present neural results at both the group and single-subject levels (Smith and Little, 2018).
Generalized linear mixed model. A generalized linear mixed model (GLMM) regression analysis was
performed to characterize the extent to which neural entrainment was impacted by stimulus spectral complexity (i.e. original vs. neutral condition) and emotional arousal ratings. To do so, stimulus-brain coherence (as estimated with the LOTO procedure) was analyzed using GLMMs, with condition (orig-inal/neutral) and arousal ratings used as predictors, and participant number and file tag (one value per original/neutral pair) used as random factors. We report p-values estimated from hierarchical model comparisons using likelihood ratio tests (Gelman and Hill, 2007), and only present models that satisfy the assumption of normality (validated by visually inspecting the plots of residuals against fitted val-ues) and statistical validation (significant difference with the nested null model). To test for main ef-fects, we compared models with and without the fixed effect of interest. To test for interactions, we compared models including fixed effects versus models including fixed effects and their interaction.
Causal mediation analyses. A model-based causal mediation analysis (CMA) was performed to
deter-mine whether spectral complexity manipulation (i.e. original vs. neutral condition) had a direct effect on neural entrainment or whether neural entrainment was mediated by participants’ arousal rating. Analysis was performed using the Mediation package for CMA analysis of the R software (Tingley et al., 2014).
Results
In this study, we investigated cortical neural entrainment to music. We focused on whether neural en-trainment is modulated by the spectral complexity of the musical excerpt (original vs. neutral condi-tion) and investigated whether and how complexity and neural entrainment impacted behavior (partici-pants’ emotional ratings). To this end, EEG was recorded while participants listened to and rated the emotional content of original melodies specially designed to express a mixture of happiness and sad-ness, as well as to their neutral versions, having preserved temporal envelopes but reduced complexity in terms of pitch, harmony and pitch variation (see Methods). The behavioral effects of our manipula-tion were first investigated in a preliminary perceptual experiment.
Acoustic and behavioral validation
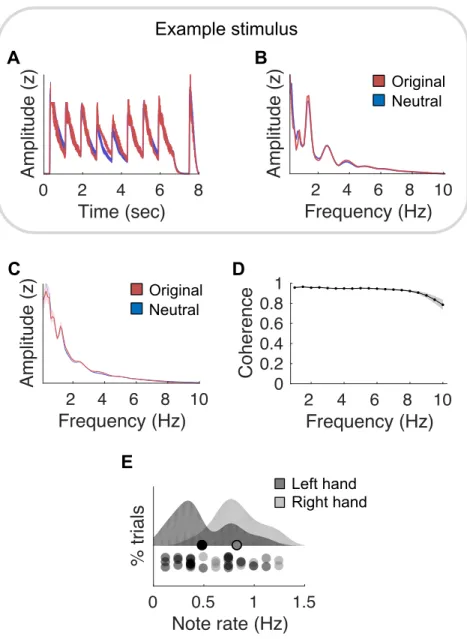
Concerning the acoustic stimuli, we first confirmed that original and neutral melodies were well matched in terms of loudness and rhythm. To this end, we compared the temporal envelope of each original melody to the one of its neutral version through a threefold approach. Firstly, we verified that the envelopes of both types of melodies nearly perfectly correlated over time (mean Pearson r2 = .85;
see Fig. 1A for a representative example). Secondly, we computed the spectrum of the temporal enve-lope (hereafter called “modulation spectrum”) of original and neutral melodies, which reflect how fast sound intensity fluctuates over time. We confirmed that they had the exact same modulation spectrum profile (see Fig. 1B for a representative example and Fig. 1C for the average over the 21 original and neutral melodies; mean Pearson r2 = .96; paired t-tests over frequencies: all ps > .4, after FDR
correc-tion for multiple comparison). Thirdly, we computed the coherence between the acoustical envelopes of the original and their matched neutral melodies, in order to estimate the similarity (both in terms of phase and amplitude) of their respective envelopes and confirmed that they were highly similar in the [1-10] Hz range (mean coherence C = .93; Fig. 1D). Finally, for each stimulus and each of its two monophonic lines (melodic line played on the right hand/high register of the piano, or left hand/low register of the piano, see Methods), we calculated the note rates, i.e. the number of acoustic events per second, with chords counting for one event (Fig. 1E). This analysis shows that the acoustic events oc-cur at a maximum rate of 1.3Hz.
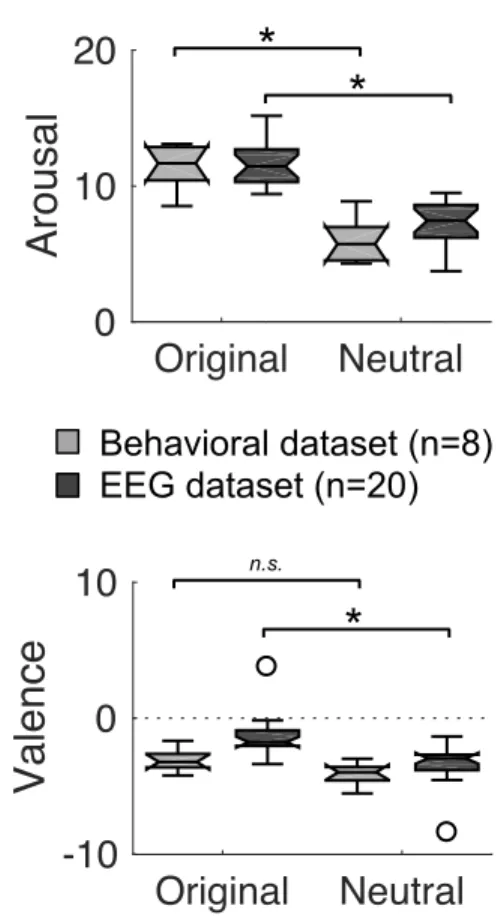
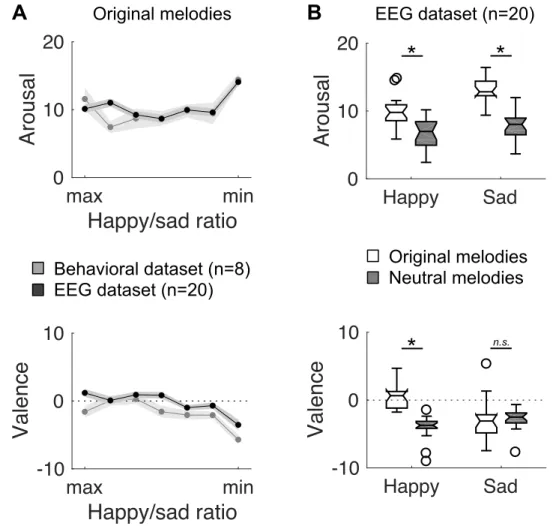
We then validated that original and neutral melodies elicited different emotional reactions in the intended direction, in both the preliminary and main experiments. Arousal was significantly reduced for neutral, as compared to original melodies (Wilcoxon signed-rank test: preliminary exp.: Z = 2.38, p = .017; EEG exp.: Z = 3.88, p < .001; Fig. 2, upper panels). There was also a trend for neutral melodies to induce more negative emotions than original melodies (preliminary exp.: Z = 1.68, p = .09; EEG exp.: Z = 3.32, p < .001; Fig. 2, lower panels). Incidentally, we also controlled that the original melo-dies with a higher percentage of happiness (see Methods) were rated more positively in terms of va-lence than original melodies with a higher percentage of sadness (Supplemental Fig. S2 - https://doi.org/10.6084/m9.figshare.11568906).
Stimulus-brain coherence
To capture the general spectral profile of neural entrainment induced by our set of melodies, we aver-aged stimulus-brain coherence across all trials, including original and neutral melodies (Fig. 3A). Overall, coherence peaked at four frequencies (~1, 2.5, ~3.5 and 5 Hz), and this pattern was not simply due to an increase of EEG power at these frequencies (Supplemental Fig. S3A - https://doi.org/10.6084/m9.figshare.11569008). The topographical maps estimated at those four fre-quencies showed that neural entrainment was maximal in parietal and temporal electrodes at 1 Hz, whereas it was maximal in fronto-central electrodes for the other peak frequencies (Fig. 3B). Moreover, our data revealed that the stimulus-brain coherence spectrum pattern (quantifying the synchronization of the acoustic envelope and neural oscillations) globally matched the acoustic modulation spectrum pattern, over the frequency range under study ([1-10] Hz), with peaks at ~1, 2.5, ~3.5 and 5 Hz (Fig. 3C). However, the 1 and 5 Hz peaks were considerably magnified in the coherence as compared to the acoustic modulation spectrum.
Modulation of neural entrainment by music spectral complexity
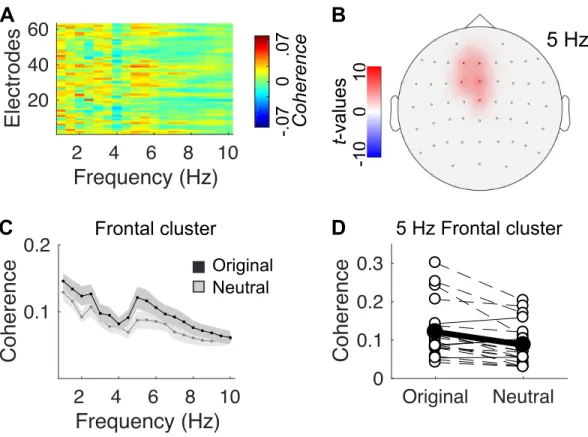
To assess the impact of complexity of the musical material on neural entrainment, we contrasted stimu-lus-brain coherence measures computed for original vs. neutral melodies (Fig. 4A). A selective effect of spectral complexity on neural entrainment was observed on a single spectro-spatial cluster, at [5-6] Hz on fronto-central electrodes (Fig. 4B-C): stimulus-brain coherence was significantly stronger for original melodies than for neutral melodies at 5 Hz only, in this cluster of electrodes. Incidentally, EEG power was not significantly different between original and neutral melodies (Supplemental Fig. S3B - https://doi.org/10.6084/m9.figshare.11569008). It is particularly striking that this effect of enhanced coherence for expressive melodies was not only present at the group-level, but at the individual level for 16 out of 20 participants (Fig. 4D). Because original and neutral melodies were constructed to have the same modulation spectrum, and thus the same rhythmic properties (see Fig. 1D), the stronger stimu-lus-brain coherence at 5 Hz for expressive melodies cannot be attributed to rhythmic differences be-tween the two categories of stimuli. Nor can it be attributed directly to pitch variations over time in the expressive excerpts since none of the stimuli had a note rate of 5 Hz (see Fig. 1E). Incidentally, in a control analysis, we estimated a subdimension of spectral complexity: the variance of pitches (in cents) over the 8-sec excerpts, defined as the mean of the deviation of each pitch from the average. We ana-lyzed this contribution to the entrainment effect using a GLMM analysis and found no significant im-pact of pitch variance on neural entrainment (p = .21). Therefore, spectral complexity could not be re-duced to pitch variance in our paradigm.
Modulation of neural entrainment with arousal ratings
A median split of arousal ratings was performed for each participant ([0-20] rating scale: high 14 ± 2.2 vs. low 4.8 ± 2.6 arousal ratings; Wilcoxon signed-rank test: Z = 3.92, p < .001). Stimulus-brain coher-ence at 5 Hz, on the frontal-central cluster (see Fig. 4B), was significantly stronger for high arousing stimuli than for low arousing stimuli (Z = 2.46, p = .014). This result reveals that high and low arousing
stimuli are associated with different coherence values, with stronger neural entrainment for high arous-ing stimuli.
Relationship between melodic complexity, arousal and neural entrainment
Because all the above analyses are only correlational, they do not allow us to conclude on the causal links between melodic complexity, arousal and neural entrainment. In particular, it remains to be inves-tigated whether the modulation of neural entrainment by music complexity reflects an acoustic or a higher order emotional/cognitive level of processing. In other words, at this stage we cannot conclude on whether the difference of coherence at [5-6] Hz on fronto-central electrodes is due to the intrinsic acoustic characteristics of original stimuli (compared to neutral) or to the recognized emotional load (reflected in the arousal ratings).
To study the relative effect of spectral complexity (i.e. original vs. neutral condition) and emo-tional arousal ratings on neural entrainment (extracted from the spectro-spatial cluster, see Fig. 4B), we conducted GLMM analyses. First, we compared models containing either ‘condition’ or ‘arousal’ with their corresponding nested null model (i.e. first layer in hierarchical GLMM analysis). We found that both condition (C2(9) = 7.0, p = .008) and arousal (C2(9) = 4.2, p = .04) significantly improved the
model’s ability to predict the variance of the coherence measure. Next, we compared the model includ-ing both condition and arousal to models containinclud-ing only one of these two factors (i.e. second hierar-chical layer). We observed that condition significantly improved the model’s performance (C2(10) =
4.0, p = .04), whereas arousal did not (C2(10) = 1.2, p = .27). Overall, this suggests that the variance of
coherence explained by arousal at the first level of the GLMM is a subset of the one explained by con-dition. This finding supports the link between spectral complexity and arousal previously reported, showing that arousal ratings were significantly different for neutral, as compared to original melodies (Fig. 2).
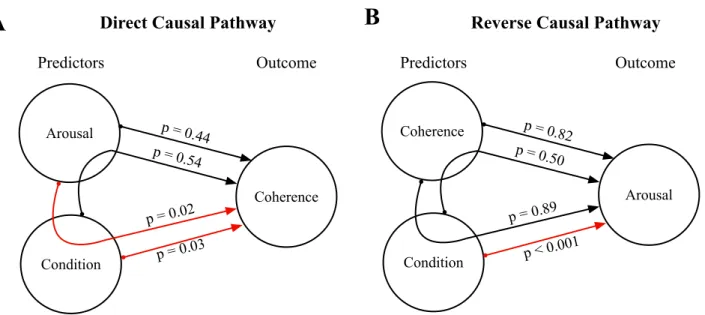
To further investigate the link between spectral complexity (i.e. original vs. neutral condition), emotional arousal rating and neural entrainment, we conducted model-based Causal Mediation Anal-yses. First, we tested whether the previously evidenced link between arousal and coherence was medi-ated by condition (Fig. 5A). Although no significant Average Direct Effect from arousal to coherence was found (ADE = 2.51e-05, p = .44), there was a significant Average Causal Mediation Effect medi-ated by condition (ACME = 2.52e-05, p = .02). Similarly, we tested whether the effect of condition on coherence was mediated by arousal. A significant Average Direct Effect from condition to coherence (ADE = 3.76e-04, p = .03) was present, but no significant mediation by arousal was found (ACME = 5.06e-05, p = .54). These analyses suggest that the effect of arousal ratings on neural entrainment is in-direct, that is to say that it is significantly mediated by the spectral complexity of stimuli (original vs. neutral). Finally, we tested the reverse causal pathway by considering arousal as the outcome of the model (Fig. 5B). A significant Average Direct Effect from condition to arousal was present (ADE = 2.17, p = .001), but no significant mediation by coherence was found (ACME = -0.0024, p = .50).
Moreover, the effect of coherence on arousal was not significant (ADE = 1.4847, p = 0.82; ACME = -0.0928, p = 0.89).
In short, these analyses further demonstrate that the complexity of the musical material has a di-rect impact on neural entrainment and reveal that spectral complexity mediates the observed relation-ship between emotional arousal ratings and neural entrainment.
Discussion
In this study, we pushed forward the idea that cortical neural oscillations play a functional role in the processing of auditory information, not only in speech but also in the less-studied context of music per-ception. In particular, we hypothesized that neural entrainment to musical stimuli is sensitive to acous-tic dynamics (temporal factor), but that it is also modulated by a non-temporal dimension of stimula-tion: music spectral complexity.
Slow oscillations are known to entrain to the dominant rhythm (tempo) of pure tone sequences (Morillon and Baillet, 2017), speech streams (Peelle et al., 2012) or musical stimuli (Doelling and Poeppel, 2015; Doelling et al., 2019). The present study significantly extends this account by showing that neural oscillations also entrain to more variable acoustic fluctuations, since the pattern of neural entrainment (i.e. stimulus-brain coherence spectrum) mirrors the complex pattern of the averaged acoustic modulation spectrum of the stimuli, with peaks at ~1, 2.5, ~3.5 and 5 Hz (Fig. 3). This high-lights the fine-grained nature of this coupling mechanism, which robustly captures the temporal dynam-ics of acoustic stimuli.
Critically, our study also demonstrates that neural entrainment to music is also impacted by non-temporal manipulations, which is in line with previous studies in the speech domain or focusing on pure tone stimulation (reviewed in: (Ding and Simon, 2014; Haegens and Zion-Golumbic, 2017; Rim-mele et al., 2018)). Here, we investigated the contribution of spectral complexity of a musical excerpt to neural entrainment, and show that cortical oscillations become more closely coupled with slow fluc-tuations in the music signal when the melody is expressive (in the sense of more harmonically com-plex), compared to its envelope-matched neutral version, confirming our hypothesis. In particular, we observed a selective effect of melodic spectral complexity on neural entrainment in the theta range (5 Hz). This result cannot be explained by differences in the temporal structure of our stimuli since both the comparison of the modulation spectra of original and their matched neutral melodies (reflecting how fast sound intensity fluctuates over time) and the estimation of the coherence between their respec-tive temporal envelopes ruled out the possibility of a selecrespec-tive difference of amplitude at 5 Hz across stimuli. The sole difference between original and neutral stimuli is in their spectral content: the acousti-cal manipulation was accomplished by creating monotonic versions of the original stimuli without changing the overall temporal envelope, in such a way that complexity in terms of pitch, harmony and pitch variance was reduced to its minimum. In other words, this manipulation was more complex than mere changes in pitch over time (note rate), or pitch variance over the excerpt. Hence, this result pro-vides new evidence that not only the temporal information (acoustic dynamics) but also the spectral in-formation of acoustic stimuli critically contribute to neural entrainment (Henry and Obleser, 2012; Ding et al., 2013; Lakatos et al., 2013; Zoefel and VanRullen, 2015). Importantly, though our neutral stimuli consisting of one pitch only are a drastic control, the observed frequency-specific effect of spec-tral complexity on neural entrainment is hardly compatible with habituation/adaptation responses rela-tive to repetirela-tive/predictable stimuli (Pérez-González and Malmierca, 2014), since the coherence meas-ure reflects only the similarity in the dynamics between two signals (and not their actual overall
amplitude). Furthermore, the present data suggest that a peak in the acoustic modulation spectrum of the melodies is not a sufficient condition to observe an effect of spectral complexity on neural entrain-ment. Indeed, coherence peaked at frequencies that were also present in the stimuli themselves but the effect of spectral complexity on neural entrainment was found only at 5 Hz. That the effect is selective to the theta range could then be due to specific constraints of the neural (perceptual or attentional) structures involved in the processing of acoustic properties more complex than the note rate or pitch variance, but this remains to be further investigated. In particular, recent work highlighted a temporal coding preference of the auditory system for two distinct sampling regimes: theta (4-7 Hz) and gamma (30-45 Hz) ranges. This means that perceptual information tend to be sampled in parallel at these spe-cific timescales, which is reflected in a preferential neural entrainment at theta and gamma rates during perception of auditory streams with a wide-range of acoustic dynamics (Teng et al., 2017; Giroud et al., 2019). The present result speaks in favor of more engagement of the slower (theta) timescale during perception of original than during perception of neutral excerpt. This timescale has been shown to be implicated in the processing of abstract global (vs. local) acoustic patterns (Teng et al., 2016), and could be mobilized here to deal with the higher perceptual complexity of original stimuli.
With the present setup, we could also investigate the relationships between music complexity, neural entrainment and behavior (through participants’ emotional ratings) to disentangle whether the entrainment effect observed in the theta band reflects a difference of processing at the auditory level (low-level acoustic processing) and/or at a higher emotional level. As mentioned, the strength of this neural entrainment could scale with non-temporal perceptual complexity (see e.g. (Folta-Schoofs et al., 2014)), which would in turn impact auditory or attentional processes (e.g. (Lakatos et al., 2013)). Or it could scale with the strength of emotional engagement, reflecting the functional interaction between subcortical (striatum, amygdala) and auditory cortical areas (Salimpoor et al., 2013; Liégeois-Chauvel et al., 2014; Salimpoor et al., 2015). Yet, these two factors of perceptual complexity and emotional ap-praisal could also be functionally related as shown in one recent study of musical emotional processing, in which judgments of negative valence were found to be related to the perceptual ambigui-ty/complexity in the auditory scene (Bonin et al., 2016). Our data show that although high and low arousing stimuli are associated with different levels of neural entrainment, spectral complexity of the musical material mediates this observed relationship. Therefore, if there are some acoustical attributes of the stimuli that increase the stimulus-brain coupling phenomenon and some attributes that make them more arousing, our study demonstrates that these attributes only partly overlap. In sum, this study suggests that the selective effect of complexity on neural entrainment mostly reflects an auditory pro-cessing that should be distinguished from higher-order emotional levels of propro-cessing.
On the whole, this study provides fundamental insights into mechanisms underlying auditory infor-mation processing in the context of music perception. The present results also suggest that neural en-trainment does not directly underpin emotional judgment.
Conclusion
Overall, this study highlights that cortical neural activity closely entrains to complex acoustic temporal modulations but is also sensitive to non-temporal manipulations. In particular, increasing music spec-tral complexity, in terms of pitch, harmony and pitch variation, enhances neural entrainment. This ef-fect is frequency-specific (5 Hz) and could reflect specific constraints of the neural processes involved. Importantly, while spectral complexity modulates both neural entrainment and emotional arousal rat-ings, neural entrainment reflects an auditory-level of processing independent from higher-order emo-tional processes. In the end, these results speak against the idea that neural entrainment only reflects acoustic temporal modulations (see also (Breska and Deouell, 2017; Rimmele et al., 2018)), and reveal its intricate nature in a non-speech context. If neural entrainment reflects the quality of sensory infor-mation, being in first instance an instrument of sensory selection, that is to say a gain control modulato-ry mechanism (Schroeder and Lakatos, 2009; Cravo et al., 2013; Nobre and van Ede, 2017), neural en-trainment also constitutively reflects the content of sensory information, corresponding to a cortical processing stage at which multiple (spectrotemporal) acoustic features are synthetized into a whole au-ditory object (Poeppel et al., 2008; Shamma et al., 2011; Ding et al., 2013).
References
Abrams DA, Nicol T, Zecker S, Kraus N. Right-hemisphere auditory cortex is dominant for coding syllable patterns in
speech. J Neurosci 28: 3958–3965, 2008.
Beller G. EBMS – Emotion-Based Musical Synthesizer. Retrieved on 22/05/2018 from
www.gregbeller.com/2013/02/ebms/.
Bonin TL, Trainor LJ, Belyk M, Andrews PW. The source dilemma hypothesis: Perceptual uncertainty contributes to
musical emotion. Cognition 154: 174–181, 2016.
Breska A, Deouell LY. Neural mechanisms of rhythm-based temporal prediction: Delta phase-locking reflects temporal
predictability but not rhythmic entrainment. PLoS Biol 15: e2001665, 2017.
Chandrasekaran C, Trubanova A, Stillittano S, Caplier A, Ghazanfar AA. The natural statistics of audiovisual speech.
PLoS Comput Biol 5: e1000436, 2009.
Cravo AM, Rohenkohl G, Wyart V, Nobre AC. Temporal expectation enhances contrast sensitivity by phase entrainment
of low-frequency oscillations in visual cortex. J Neurosci 33: 4002–4010, 2013.
Ding N, Chatterjee M, Simon JZ. Robust cortical entrainment to the speech envelope relies on the spectro-temporal fine
structure. NeuroImage 88C: 41–46, 2013.
Ding N, Patel AD, Chen L, Butler H, Luo C, Poeppel D. Temporal modulations in speech and music. Neurosci Biobehav
Rev 81: 181–187, 2017.
Ding N, Simon JZ. Cortical entrainment to continuous speech: functional roles and interpretations. Front Hum Neurosci 8:
311, 2014.
Doelling K, Arnal L, Ghitza O, Poeppel D. Acoustic landmarks drive delta-theta oscillations to enable speech
comprehen-sion by facilitating perceptual parsing. NeuroImage (June 18, 2013). doi: 10.1016/j.neuroimage.2013.06.035.
Doelling KB, Assaneo MF, Bevilacqua D, Pesaran B, Poeppel D. An oscillator model better predicts cortical entrainment
to music. Proc Natl Acad Sci USA 116: 10113–10121, 2019.
Doelling KB, Poeppel D. Cortical entrainment to music and its modulation by expertise. Proc. Natl. Acad. Sci. U.S.A.
(Oc-tober 26, 2015). doi: 10.1073/pnas.1508431112.
Dorsen A. Talk about A Piece of Work: A Group Self-Interview. The Drama Review. 2015.
Folta-Schoofs K, Wolf OT, Treue S, Schoofs D. Perceptual complexity, rather than valence or arousal accounts for
dis-tracter-induced overproductions of temporal durations. Acta Psychol (Amst) 147: 51–59, 2014.
Gelman A, Hill J. Data Analysis Using Regression and Multilevel/Hierarchical Models. Cambridge University Press,
2007.
Ghitza O. On the role of theta-driven syllabic parsing in decoding speech: intelligibility of speech with a manipulated
mod-ulation spectrum. Front Psychology 3: 238, 2012.
Giraud A-L, Poeppel D. Cortical oscillations and speech processing: emerging computational principles and operations.
Nat Neurosci 15: 511–517, 2012.
Giraud AL, Kleinschmidt A, Poeppel D, Lund TE, Laufs H. Endogenous cortical rhythms determine cerebral
specializa-tion for speech percepspecializa-tion and producspecializa-tion. Neuron 56: 1127–1134, 2007.
Giroud J, Trébuchon A, Schön D, Marquis P, Liégeois-Chauvel C, Poeppel D, Morillon B. Asymmetric sampling in
human auditory cortex reveals spectral processing hierarchy. bioRxiv (March 18, 2019). doi: 10.1101/581520.
Gluth S, Meiran N. Leave-One-Trial-Out, LOTO, a general approach to link single-trial parameters of cognitive models to
neural data. Elife 8, 2019.
Gross J, Hoogenboom N, Thut G, Schyns P, Panzeri S, Belin P, Garrod S. Speech Rhythms and Multiplexed
Oscillato-ry SensoOscillato-ry Coding in the Human Brain. PLoS Biol 11: e1001752, 2013.
Haegens S, Zion-Golumbic E. Rhythmic facilitation of sensory processing: a critical review. Neurosci Biobehav Rev
Henry MJ, Obleser J. Frequency modulation entrains slow neural oscillations and optimizes human listening behavior.
Proc Natl Acad Sci USA 109: 20095–20100, 2012.
Juslin PN, Laukka P. Expression, Perception, and Induction of Musical Emotions: A Review and a Questionnaire Study of
Everyday Listening. Journal of New Music Research 33: 217–238, 2004.
Juslin PN, Västfjäll D. Emotional responses to music: the need to consider underlying mechanisms. Behavioral and Brain
Sciences 31: 559–75– discussion 575–621, 2008.
Kösem A, van Wassenhove V. Distinct contributions of low- and high-frequency neural oscillations to speech
comprehen-sion. Language, Cognition and Neuroscience (October 18, 2016). doi: 10.1080/23273798.2016.1238495.
Lakatos P, Musacchia G, O’Connel MN, Falchier AY, Javitt DC, Schroeder CE. The Spectrotemporal Filter
Mecha-nism of Auditory Selective Attention. Neuron 77: 750–761, 2013.
Lepage KQ, Vijayan S. The relationship between coherence and the phase-locking value. Journal of Theoretical Biology
435: 106–109, 2017.
Liégeois-Chauvel C, Bénar C, Krieg J, Delbé C, Chauvel P, Giusiano B, Bigand E. How functional coupling between
the auditory cortex and the amygdala induces musical emotion: a single case study. Cortex 60: 82–93, 2014.
Luo H, Poeppel D. Phase patterns of neuronal responses reliably discriminate speech in human auditory cortex. Neuron 54:
1001–1010, 2007.
Maris E, Oostenveld R. Nonparametric statistical testing of EEG- and MEG-data. Journal of Neuroscience Methods 164:
177–190, 2007.
Morillon B, Baillet S. Motor origin of temporal predictions in auditory attention. Proc Natl Acad Sci USA 114: E8913–
E8921, 2017.
Morillon B, Liégeois-Chauvel C, Arnal L, Bénar C-G, Giraud AL. Asymmetric Function of Theta and Gamma Activity
in Syllable Processing: An Intra-Cortical Study. Front Psychology 3: 248, 2012.
Nobre AC, van Ede F. Anticipated moments: temporal structure in attention. Nat Rev Neurosci 27: 611, 2017. Patel AD. Science & music: talk of the tone. Nature 453: 726–727, 2008.
Peelle JE, Gross J, Davis MH. Phase-Locked Responses to Speech in Human Auditory Cortex are Enhanced During
Com-prehension. Cerebral cortex (New York, NY : 1991) 23: 1378–1387, 2012.
Peirce JW. PsychoPy--Psychophysics software in Python. Journal of Neuroscience Methods 162: 8–13, 2007.
Pérez-González D, Malmierca MS. Adaptation in the auditory system: an overview. Front Integr Neurosci 8: 19, 2014. Poeppel D, Idsardi WJ, van Wassenhove V. Speech perception at the interface of neurobiology and linguistics. Philos
Trans R Soc Lond, B, Biol Sci 363: 1071–1086, 2008.
Riecke L, Formisano E, Sorger B, Başkent D, Gaudrain E. Neural Entrainment to Speech Modulates Speech
Intelligibil-ity. Curr Biol 28: 161–169.e5, 2018.
Rimmele JM, Morillon B, Poeppel D, Arnal LH. Proactive sensing of periodic and aperiodic auditory patterns. Trends in
Cognitive Sciences in press, 2018.
Salimpoor VN, van den Bosch I, Kovacevic N, McIntosh AR, Dagher A, Zatorre RJ. Interactions between the nucleus
accumbens and auditory cortices predict music reward value. Science 340: 216–219, 2013.
Salimpoor VN, Zald DH, Zatorre RJ, Dagher A, McIntosh AR. Predictions and the brain: how musical sounds become
rewarding. Trends in Cognitive Sciences 19: 86–91, 2015.
Schroeder CE, Lakatos P. Low-frequency neuronal oscillations as instruments of sensory selection. Trends in
Neurosci-ences 32: 9–18, 2009.
Shamma SA, Elhilali M, Micheyl C. Temporal coherence and attention in auditory scene analysis. Trends in
Neuroscienc-es 34: 114–123, 2011.
Steinmetzger K, Rosen S. Effects of acoustic periodicity and intelligibility on the neural oscillations in response to speech.
Neuropsychologia 95: 173–181, 2017.
Tadel F, Baillet S, Mosher JC, Pantazis D, Leahy RM. Brainstorm: a user-friendly application for MEG/EEG analysis.
Computational Intelligence and Neuroscience 2011: 879716, 2011.
Teng X, Tian X, Poeppel D. Testing multi-scale processing in the auditory system. Sci Rep 6: 34390, 2016.
Teng X, Tian X, Rowland J, Poeppel D. Concurrent temporal channels for auditory processing: Oscillatory neural
en-trainment reveals segregation of function at different scales. PLoS Biol 15: e2000812, 2017.
Tingley D, Yamamoto T, Hirose K, Keele L, Imai K. Mediation: R package for causal mediation analysis. Journal of
sta-tistical software 59, 2014.
Vander Ghinst M, Bourguignon M, Op de Beeck M, Wens V, Marty B, Hassid S, Choufani G, Jousmaki V, Hari R, Van Bogaert P, Goldman S, De Tiege X. Left Superior Temporal Gyrus Is Coupled to Attended Speech in a
Cocktail-Party Auditory Scene. J Neurosci 36: 1596–1606, 2016.
VanRullen R. Perceptual Cycles. Trends in Cognitive Sciences 20: 723–735, 2016.
Zatorre RJ, Belin P, Penhune VB. Structure and function of auditory cortex: music and speech. Trends in Cognitive
Sci-ences 6: 37–46, 2002.
Zatorre RJ, Evans AC, Meyer E. Neural mechanisms underlying melodic perception and memory for pitch. Journal of
Neuroscience 14: 1908–1919, 1994.
Zion Golumbic EM, Ding N, Bickel S, Lakatos P, Schevon CA, McKhann GM, Goodman RR, Emerson R, Mehta AD, Simon JZ, Poeppel D, Schroeder CE. Mechanisms underlying selective neuronal tracking of attended speech at a
"cocktail party". Neuron 77: 980–991, 2013.
Zoefel B, VanRullen R. Selective perceptual phase entrainment to speech rhythm in the absence of spectral energy
Figures
Figure 1. Melodic stimuli. (A) Amplitude envelope of a representative original expressive melody,
to-gether with its neutral melody counterpart. Neutral versions of original melodies (composed of various pitches) are simply the repetition of a unique pitch of the same instrument timbre, all other acoustical features (intensity and rhythm) being matched. (B) Normalized modulation spectrum of the acoustic temporal envelope of the melodies depicted in (A). (C) Normalized averaged modulation spectrum of the 21 original and neutral melodies. (D) Coherence computed between the acoustic temporal enve-lopes of the original and their matched neutral melodies, estimated across all melodies between [1-10] Hz. (C-D) Shaded error bars indicate SEM. (E) Distribution of the note rate, viz. the number of acous-tic events per second (with chords counting for one event), across melodies for each of the two mono-phonic lines (left and right hands). Circles on the distributions depict means for each monomono-phonic line. Circles under the distributions depict individual pieces.
2 4 6 8 10 Frequency (Hz) Amplitude (z) 2 4 6 8 10 Frequency (Hz) Amplitude (z) 2 4 6 8 10 Frequency (Hz) Amplitude (z) 2 4 6 8 10 Frequency (Hz) Amplitude (z) 0 2 4 6 8 Time (sec) Amplitude (z) 0 0.5 1 1.5 Note rate (Hz) % trials
Figure 1. Acoustic analysis
A B C r2 = .93 Original Neutral D Example stimulus Left hand Right hand E Original Neutral 2 4 6 8 10 Frequency (Hz) Amplitude (z) 2 4 6 8 10 Frequency (Hz) Amplitude (z) 2 4 6 8 10 Frequency (Hz) 0 0.2 0.4 0.6 0.8 1 Coherence 2 4 6 8 10 Frequency (Hz) 0 0.2 0.4 0.6 0.8 1 Coherence
Figure 2. Behavioral results. Boxplots of arousal and valence behavioral judgments during the
pre-liminary behavioral (n = 8; gray boxplots) and the EEG (n = 20; black boxplots) experiments. Circles depict outliers. Stars/n.s. indicate significant/non-significant differences (p < .05).
-10 0 10
Valence
0 10 20Arousal
Figure 2. Behavioral data: no Joy n=20 (+n=8)
Original Neutral -10 0 10
Valence
Original Neutral 0 10 20Arousal
Original Neutral-10 0 10
Valence
Original Neutral 0 10 20Arousal
*
*
n.s.*
Behavioral dataset (n=8) EEG dataset (n=20)Figure 3. Neural entrainment to melodic stimuli. (A) Stimulus-brain coherence, computed between
the acoustic temporal envelope and the 64 EEG neural signals, estimated between [1-10] Hz across all (original and neutral) melodies. (B) Topographical map of coherence estimated at 1, 2.5, 3.5, and 5 Hz.
(C) Comparison of the acoustic modulation spectrum and the stimulus-brain coherence spectrum
aver-aged across EEG channels. Please notice that for visualization purpose the exponents of the power-law like distribution (1/f decay) of the two spectra were normalized.
Figure 3. Stimulus-brain coherence: no Joy n=20
0 10 20 30 40 50 60 70 0 10 20 30 40 50 60 70 -30 -20 -10 0 10 20 30 0 .05 .1 Coh ere nce Target Distractor
*
Target Distractor 0 0.5 1 1.5 Element weight 0 4 8 12 16 0 1 2 3 Element position Element weight Motor-tracking Listen 0.7 0.75 0.8 Performances (% ) Target Distractor 0 0.5 1 1.5 Element weight Motor-tracking ListenA
B
*
Coherence Acoustic spectrumA
0 .1 Coherence 5 Hz 3.5 Hz 2.5 Hz 1 HzB
2 4 6 8 10Frequency (Hz)
20 40 60Electrodes
C oh ere nce Aco ust ic Amp lit ud e 2 4 6 8 10Frequency (Hz)
0.03 0.05 0.07 0.3 0.5C
Figure 4. Effect of melodic spectral complexity on neural entrainment. (A) Contrast between
stim-ulus-brain coherence estimates in original vs. neutral conditions (original > neutral), computed across melodies for each EEG channel between [1-10] Hz. (B) Topographical map of the non-parametric clus-ter permutation statistical analysis of the coherence contrast, computed across channels and frequencies (α-cluster level = .005). Significant differences are observed at [5-6] Hz in a frontal cluster composed of channels F1|Fz|FC1|FCz|Cz. (C) Detail of the coherence spectrum of the original and neutral condi-tions, estimated in the frontal cluster. Shaded error bars indicate SEM. (D) Individual coherence esti-mates at 5 Hz in the frontal cluster. White circles indicate individual estiesti-mates. Dashed lines indicate participants showing increased coherence in the original vs. neutral condition. Black circles and line indicate group average.
2 4 6 8 10
Frequency (Hz)
0.1 0.2
Coherence
Figure 4. Diotic: original-neutral: no Joy n=20.
A
5 Hz
5 Hz Frontal cluster 0 10 20 30 40 50 60 70 0 10 20 30 40 50 60 70 -30 -20 -10 0 10 20 30 -. 07 0 .0 7 C oh ere nce Frontal clusterC
D
B
-1 0 0 1 0 t-va lu es Target Distractor*
Target Distractor 0 0.5 1 1.5 Element weight 0 4 8 12 16 0 1 2 3 Element position Element weight Motor-tracking Listen 0.7 0.75 0.8 Performances (% ) Target Distractor 0 0.5 1 1.5 Element weight Motor-tracking ListenA
B
*
Original Neutral 2 4 6 8 10Frequency (Hz)
20 40 60Electrodes
Original Neutral 0 0.1 0.2 0.3Coherence
Figure 5. Results of the Causal Mediation Analysis. (A) Direct causal pathway: results from the
Causal Mediation Analysis when considering stimulus-brain coherence as an outcome and arous-al/condition as either the treatment or the mediator. (B) Reverse causal pathway: results from the Caus-al Mediation AnCaus-alysis when considering arousCaus-al as an outcome and condition/ stimulus-brain coher-ence as either the treatment or the mediator. Red arrows represent significant pathways.
Arousal Condition
A
B
Outcome Predictors Coherence p = 0.44 p = 0.02 p = 0.54 p = 0.03 Predictors OutcomeDirect Causal Pathway Reverse Causal Pathway
Coherence Condition Arousal p = 0.82 p = 0.89 p = 0.50 p < 0.001
Figure S1. Representative examples of the melodic stimuli. (A) Exemplar of sheet music of an
orig-inal stimulus. (B) Exemplar of sheet music of its neutral version.
A
Figure S1. Exemplars of sheet music
Figure S2. Behavioral results. A. Arousal and valence behavioral judgments of original melodies
dur-ing the preliminary behavioral (n = 8; gray line) and the EEG (n = 20; black line) experiments, as a function of the relative percentage of happiness and sadness used to generate the melodies (x-axis di-vided into 7 bins ranked from maximal happy/sad ratio to minimal happy/sad ratio). In the EEG exper-iment, both arousal and valence ratings significantly differed between the different categories of stimuli (repeated-measures parametric ANOVA; main effect of stimulus category: all F6,42 > 7.3, all p < 0.001).
Shaded error bars indicate SEM. B. Boxplots of arousal and valence behavioral judgments of original and neutral melodies during the EEG experiment, with trials divided with a median split procedure along the happy/sad ratio (50% happiest, 50% saddest). Stars/n.s. indicate significant/non-significant differences (Wilcoxon signed-rank tests: p < .05, corrected for multiple comparison). Circles depict outliers. Happy Sad -10 0 10
Valence
Happy Sad 0 10 20Arousal
EEG dataset (n=20)B
*
*
Original melodies Neutral melodies Happy Sad -10 0 10Valence
Happy Sad 0 10 20Arousal
max minHappy/sad ratio
-10 0 10Valence
max minHappy/sad ratio
0 10 20Arousal
Behavioral dataset (n=8) EEG dataset (n=20)A
*
n.s. Original melodiesFigure S2.
Figure S3. EEG response to melodic stimuli. (A) Power response (in decibel) of the 64 EEG
chan-nels, estimated between [1-10] Hz across all (original and neutral) melodies. (B) Contrast between power response estimates in original vs. neutral conditions (original > neutral), for each EEG channel between [1-10] Hz.
Figure S3: EEG Power
0 10 20 30 40 50 60 70 0 10 20 30 40 50 60 70 -30 -20 -10 0 10 20 30 -1 0 1 Po w er (d B)
![Figure 3. Neural entrainment to melodic stimuli. (A) Stimulus-brain coherence, computed between the acoustic temporal envelope and the 64 EEG neural signals, estimated between [1-10] Hz across all (original and neutral) melodies](https://thumb-eu.123doks.com/thumbv2/123doknet/14529246.533241/22.918.281.642.95.672/entrainment-stimulus-coherence-computed-acoustic-temporal-envelope-estimated.webp)
![Figure S3. EEG response to melodic stimuli. (A) Power response (in decibel) of the 64 EEG chan- chan-nels, estimated between [1-10] Hz across all (original and neutral) melodies](https://thumb-eu.123doks.com/thumbv2/123doknet/14529246.533241/27.918.300.620.98.494/figure-response-melodic-stimuli-response-estimated-original-melodies.webp)
