Constraining the divertor heat width in ITER
The MIT Faculty has made this article openly available.
Please share
how this access benefits you. Your story matters.
Citation
Whyte, D. G., B. LaBombard, J.W. Hughes, B. Lipschultz, J. Terry,
D. Brunner, P. C. Stangeby, D. Elder, A. W. Leonard, and J. Watkins.
"Constraining the divertor heat width in ITER." Journal of Nuclear
Materials 438, Supplement (July 2013), pp.S435-S439.
As Published
http://dx.doi.org/10.1016/j.jnucmat.2013.01.088
Publisher
Elsevier
Version
Author's final manuscript
Citable link
http://hdl.handle.net/1721.1/103873
Terms of Use
Creative Commons Attribution-NonCommercial-NoDerivs License
Detailed Terms
http://creativecommons.org/licenses/by-nc-nd/4.0/
June, 2014
Plasma Science and Fusion Center
Massachusetts Institute of Technology
Cambridge MA 02139 USA
This work was supported by the U.S. Department of Energy, Grant Nos.
DE-SC00-02060, contract DE-FC02-99ER54512 and cooperative agreement DE-FC02-04ER54698.
Reproduction, translation, publication, use and disposal, in whole or in part, by or for the
United States government is permitted.
PSFC/JA-12-83
Constraining the divertor heat width in ITER
D.G. Whyte, B. LaBombard, J.W. Hughes,
B. Lipschultz, J. Terry, D. Brunner, P.C. Stangeby
1, D. Elder
1,
A.W. Leonard
2, J. Watkins
31 University of Toronto Institute for Aerospace Studies, Toronto, Canada 2 General Atomics, San Diego, CA USA
P1-037
Constraining the divertor heat width in ITER
D.G. Whyte
1, B. LaBombard
1, J.W. Hughes
1, B. Lipschultz
1, J. Terry
1, D. Brunner
1P.C. Stangeby
2, D. Elder
2, A.W. Leonard
3, J. Watkins
41MIT Plasma Science Fusion Center, Cambridge, MA, 02139, USA.
2University of Toronto Institute for Aerospace Studies, Toronto, M3H 5T6, Canada.
3 General Atomics, San Diego, CA 92186-5608, USA. 4 Sandia National Laboratories, Albuquerque, NM 87185, USA.
A model is developed which constrains heat width,
λ
rbased on global power balance, momentum conservation, pedestal stability and sheath heat transmission. The model relies on measurements of the ratio of separatrix to pedestal pressure; a ratio ~5% is found to be expected for ITER. Applying this model indicates a constraint that the allowedλ
r~ 10-30 mm for ITER if the divertor is in the high-recycling regime as expected (T<20 eV) while aλ
r~1-3 mm requires a separatrix pressure approximately equal to the top pedestal pressure in violation of physical reasoning and the concept of a pedestal. A weaker constraint is applied in the model that upstream separatrix temperature simultaneously satisfies power balance. The constrained model cannot satisfy power balance withλ
r < 3 mm, and in order to obtainλ
r~5 mm requires divertor plasma temperature > 100 eV, a condition which would have very negative consequences for the divertor, but has never been observed experimentally.PACS: 52.40.Hf, 52.55Rk
PSI keywords: divertor plasma, power deposition, edge plasma, edge modeling Corresponding author: D. Whyte, 175 Albany St, Cambridge MA 02139 USA Corresponding author e-mail: [email protected]
1. Introduction and Motivation
The issue of the scape-off layer (SOL) integral radial power width,
λ
rremains a critical and unresolved issue [1, 2] for designing magnetic fusion boundary plasmas compatible with the limit of peak heat flux < 10-15 MW m-2 in actively-cooled plasma-facing components. For fixed total power(P) plasma exhaust requirements, the peak heat flux ~
1 /
λ
r, so ifλ
ris too small the divertorcomponents will fail. However first-principles explanations explaining
λ
rremain elusive. Empirical attempts at estimatingλ
r,in large-scale devices like ITER have historically shown large amounts of scatter and poor self-consistency [3]. Recent activities have sought to improveλ
r,measurement fidelity in many present experiments (e.g. [4, 5]). Regression analysis of these data [5, 6] and a heuristic drift model [7] have suggestedλ
r~ 1-3 mm for ITER (depending on the precise definition ofλ
r) a factor of up to five lower than previous estimates (e.g. [8]) raising serious concerns for ITERdivertor viability.
Given these concerns and uncertainty it is desirable to develop methods of constraining
λ
rin ITER (and future fusion devices) independent of theλ
rmeasurements themselves. We develop here such a method, constrainingλ
rbased on SOL and pedestal pressure, sheath heat transmission and global power balance. This strategy is motivated by several observations. Recent developments in peeling-ballooning modeling and pedestal transport provide near-predictive capability for the H-mode pedestal pressure [9] while the SOL is adjacent to and essentially part of the pedestal. Simultaneously, recent measurements in Alcator C-Mod [10] confirm the standard sheath heat transmission coefficient [1]. Because the C-Mod divertor most closely matches the expected local conditions of the ITER divertor strikepoint (plasma density, ion flux, vertical, high-Z metal target) this provides confidence in using divertor density, n, and temperature, T, to calculate plasma heat exhaustq
div∝ nT
3/2
∝ p T
1/2which in turn is highly constrained to the divertor plasma pressure, p. Plasma pressure is the only quantity necessarily conserved along the separatrix from the divertor to the “upstream” midplane because the plasma can only exchange momentum to neutral species, which only exist in a small region of the SOL near the divertor plate in non-detached conditions. Taking these together, a relationship between the separatrix pressure and the known pedestal pressure will then provide a rigorous constraint on the allowed
λ
r and divertor T through the power exhaust requirement sinceP
div∝ p T
1/2
λ
r. A further motivation for this methodology is that the divertor pressure and pedestal
In both regions it is expected that ions and electrons contribute roughly equal to total plasma pressure (due to collisional coupling) and therefore the unmeasured ion temperature is largely avoided as a diagnostic issue. The following labels are used for locations: “ped” is the top of the pedestal, “sep” is the separatrix, “U” is the upstream separatrix at the outer midplane and “div” is the separatrix at the divertor plate.
In Section 2 we use pressure measurements on present experiments to provide an expectation of the ratio of separatrix to pedestal pressure in ITER. In Section 3 the pressure/power balance model is developed and applied to the ITER Q=10 H-mode scenario. Section 4 discusses the sensitivity of the model results to its assumptions and Section 5 contains the conclusions.
2. Assessing the ratio of separatrix to pedestal pressure
The ratio of separatrix pressure to pedestal pressure has been measured over a variety of conditions in Alcator C-Mod and DIII-D (Fig. 1). The discharges used for the analysis are a subset of those used for cross-device comparisons of heat flux width [4]. All discharges are H-mode (ELMy H-mode on DIII-D, EDA H-mode on C-Mod) with auxiliary heating from both neutral beams and RF heating. Separatrix pressure is obtained from the maximum electron pressure at the outer divertor as measured by embedded Langmuir probes. The outer divertor is used because in all cases these plasma were not detached, and therefore total pressure will be constant along the separatrix. The total separatrix pressure is defined here as four times the electron pressure at the sheath entrance: a factor of two arising from the Bohm sound-speed criterion which forces the static pressure (nT) to decrease a factor of two, and the other factor of two from the assumption that ions and electrons equally contribute to pressure (Ti=Te) in the collisional divertor plasma. The pedestal electron pressure, defined as the
pressure at the “top” of the pedestal, is measured by upstream Thomson Scattering (TS). The pedestal “top” typically resides at 4-5% of the minor radius inside the separatrix (insert, Fig. 1, [11]). The total pressure at the pedestal’s top is taken to be twice the electron pressure, i.e. Ti~Te based on C-Mod and
DIII-D ion measurements. We also include a single data point as published from JET (Fig. 2 of [11]) which uses TS for both the separatrix and pedestal pressure, therefore relying on magnetic reconstructions for the separatrix value.
The separatrix-to-pedestal ratio ranges from ~1-10% and the most likely value for ITER is ~5% (Fig. 1). The ratio best organizes to global power density (P/S, heating power per surface area) with a
roughly linear dependence among the different devices and within data from each device as well (although there is considerable scatter). Conversely there is no apparent organization of the ratio to q95. The experimental P/S and q95 cover the range expected for the ITER 500 MW fusion power Q=10
scenario (P/S~150MW/700m2~ 0.22 MW/m2, q
95 ~3) and therefore we use the experimental trends to
interpolate an expected separatrix-to-pedestal ratio of 0.05 with 50% uncertainty based on the data scatter (shaded region of Fig. 1).
3. Model and Results
A simple model satisfying global power exhaust is developed for the ITER (R0=6.2 m, B0=5.3 T)
Q=10, 500 MW fusion power case. Total heating power is 150 MW, power into the SOL is PSOL=100
MW and the power exhausted to the divertor plate Pdiv=50 MW. The SOL parallel area available to
exhaust heat to the two divertors is
A
q//≡ 4π R λ
rB
θB
φ⎛
⎝⎜
⎞
⎠⎟
U 17 λ
r[m
2]
Eq. 1where the average major radius R~5 m of the divertors, and the upstream (“U”) outer midplane field pitch
(B
θ/ B
φ)
U ~ 0.27 withB
φ(R)
= B
0R
0/ R
,B
φ,U 4 T
and Ip=15 MA. Noteλ
r(B
θ/ B
φ)
is aconstant on a flux surface which is why it is used to conventionally define the radial power width as its equivalence at the outer midplane even though it is physically evaluated at the divertor plate [12]. The parallel heat exhaust at the separatrix location of the divertor plate (“div”) is set by sheath heat transmission
q
//=
γ 10
20n
20, div(
)
c
skT
div 1.1 n
20, divT
div3/2[MW m
−2]
Eq. 2where
γ
~ 8 [1] is the heat transfer coefficient as recently validated [10], n20 [1020 m-3] and T [eV]are divertor density and temperature respectively and
c
s= 8.7x10
3
T
div1/2
[m/s] is the sound speed set by the Bohm criterion. In order to satisfy power exhaust
P
div= q
//A
q// =50 MW. Note that by our model definitionλ
ris the “integral” radial width evaluated at the divertor so that it is readily used to determine global divertor power exhaust; a definition previously used (e.g. Eq. 1 of [12]). Note because theλ
r is defined by the power exhaust requirement it requires no explicit model for the shape of the heat footprint yet can be used to determine the peak heat flux. The stated SOL widths in other studies may be somewhat smaller since they use multiple parameters to characterize the divertor heat width [5]. Furthermore it is noted that some regression fits [5,6] and the drift model [7] suggest the width is solely set by poloidal B. Since this is matched for ITER by Alcator C-Mod, one wouldexpect an integral
λ
r~3 mm taken directly from C-Mod H-mode measurements [4]. Therefore we estimate that these studies predict or extrapolate a range ofλ
r ~ 1- 3 mm to compare to our simple model.To satisfy divertor power exhaust Eqs. 1 and 2 can be combined to find a requirement for the divertor static pressure
p
20, div≡ 2 n
20, divT
div=
5.4
T
div1/2
λ
r
[10
20m
−3eV ]
Eq. 3assuming Ti=Te in the definition of p20.
Invoking total pressure conservation at the separatrix and noting that static pressure decreases a factor of two from the upstream plasma to the sheath entrance we constrain separatrix total pressure based on heat exhaust requirement by
p
20, sep=
10.8
T
div 1/2λ
r[10
20m
−3eV ]
Eq. 4However the separatrix pressure is also constrained by the pedestal. Based on extensive modeling and comparison to experiments the ITER Q=10 pedestal pressure [9] is expected to be 92 kPa or p20,ped
~3000. Note that this is not a large extrapolation from present experiments with present experiments straddling the ITER beta values and the absolute ITER pressure only 2.5x that found in C-Mod ELMy H-mode (see Fig. 8 of [9]). Based on Section 2 we expect the ITER separatrix pressure to be 5% of the pedestal pressure or p20,sep=150 +/-50%. Using Eq. 4 and p20,sep=150 , Fig. 3 shows the allowed
combinations of Tdiv and
λ
r that satisfy power balance. For the standard assumption that the divertorwill be in the high-recycling regime so that Tdiv~10 eV we find that the expected value of
λ
r~ 22 mmwith a range of
λ
r~15 – 40 mm between 75 < p20,sep < 225. For Tdiv~10 eV, aλ
r~ 1-3 mm wouldrequire a separatrix pressure ~ 3000, i.e. near-to or in excess of the pedestal pressure, clearly in violation of physical reasoning and/or the definition of a pedestal.
A further constraint on the upstream conditions in ITER is that the scenario operates near the Greenwald density limit (n20 ≤ IP[ MA]/
π
a[ m ]2
1.2) [13] so that the pedestal density is < 1020 m-3. From a multi-device database [8] it was found that the separatrix density was ~40-50% of the pedestal density and therefore a reasonable estimate to the upstream density is n20,U ~ n/nGr ~ fGr ~ 0.4-0.5, i.e.
increasing the upstream density significantly from these values would violate the global Greenwald density nGr ~1020 m-3 on ITER. Therefore we can estimate the upstream electron temperature
T
e, U
p
20, sep1
+
α
(
)
n
20=
10.8
1
+
α
(
)
T
div1/2λ
rf
Gr, 20[eV ]
Eq. 5where
α ≡ T
i/ T
e at the upstream separatrix. The expected Te,U values consistent with divertor powerexhaust are shown in Fig. 2b for the case of
α = 2
andn
20, U~ f
Gr= 0.4
showing that at fixed Tdiv~10 eV the upstream Tsep increases from ~200 eV at
λ
r~ 10 mm to ~2000 eV atλ
r~ 1 mm.This upstream T can be further used to estimate local parallel heat exhaust out of the upstream / midplane SOL towards the divertors via either Spitzer-Harm electron heat conduction [1]
q
//, SH
2
7
κ
0, eπ Rq
95T
e, U7/2− T
e, div 7/2(
)
≈ 10
−5T
e, U 7/2− T
e, div 7/2(
)
[MW m
−2]
Eq. 6 withκ
0, e = 2000 [W / m /T7/2], or in the case the heat is “Flux-Limited” q//, FL 0.3 n vth, ekTe≈ 2 fGrTe, U
3/2
[MW m−2] Eq. 7
where vth,e is the electron thermal velocity. Following standard practice the resulting parallel heat flux
is determined by the limiting of these two and
1
q
//, U=
1
q
//, SH+
1
q
//, FL Eq. 8with the result shown in Fig. 2 c for the case described above. It is immediately observed that a portion of the Tdiv,
λ
rspace is disallowed because the upstream (heat source) T is less than the divertor(heat sink) T, in violation of basic thermodynamics. For Tdiv=10 at the pressure constrained value
λ
r~22 mm the upstream heat flux is several 100’s MW/m2 , while for
λ
r ~1 mm the heat flux exceeds
10 GW/m2 even in the flux-limited regime.
The results of Fig. 2 are combined into Fig. 3 to examine reasonable ranges of Tdiv ,
λ
rspace wherepower and pressure balance can be satisfied. The case is with the same parameters as Fig. 2. A significant region of the space (blue shading) is disallowed due to Tdiv >TU indicating that even
without further constraints the minimum allowed width is ~ 4 mm. The SOL power exhaust
P
SOL≡ q
//, UA
q//, U, where the parallel exhaust width is evaluated using upstreamλ
r, U (Eq. 1), isshown by the dotted line contours overlaid with the separatrix pressure requirements. It is possible that the upstream width
λ
r, U is smaller than the divertor widthλ
r since this quantity is not necessarily conserved from upstream to downstream, just pressure. Therefore we estimate that a reasonable “modeled” range for PSOL = 100 is obtained in the rangeλ
r/ 3
≤
λ
r, U≤
λ
r reflecting theinstance from ~2/7 of the temperature gradient scale-length [8]. The intersection of possible PSOL
=100 MW and Pdiv (via the p20,ped constraint) indicate the allowed range of Tdiv ,
λ
rthat simultaneouslysatisfy divertor and SOL power exhaust requirements (red shaded region of Fig. 3). In this case, the most likely value at p20,ped=150 and PSOL=100 MW is with Tdiv ~12 eV and
λ
r~20 mm, suggestingthis very simple model predicts that the high-recycling divertor is a self-consistent response of the SOL/divertor. The possible ranges are Tdiv ~3-50 eV and
λ
r~8 to 40 mm.4. Discussion on sensitivity to separatrix density
Given the simplicity of the model in Section 3 it is worthwhile to examine the sensitivity of the allowed
λ
rand Tdiv to model assumptions. The results in Fig. 3 already account for the expected~factor of 2-3 uncertainty in model parameters (pressure ratios, sheath heat transmission factor or upstream power width) indicating that the basic result of the model regarding divertor heat width are robust. The remaining important assumption is the upstream density. Based on present experiments [8] it is most likely that n20,U~0.4 however it will not violate the density limit to allow this parameter
to decrease.
The results of relaxing n20,U to lower values is shown in Fig. 4. Lowering n20,U increases upstream T at
constant pressure and therefore the disallowed Tdiv >TU space (Fig. 3) decreases in size.
Simultaneously the higher upstream T affects PSOL predictions through Eqs. 6, 7. Fig. 4 shows the
results of evaluating the maximum possible values that satisfy power balance via the methodology demonstrated in Fig. 3. It is seen that at the “most expected” (p20,ped=150 and PSOL=100 MW)
equilibrium point that
λ
r decreases to ~ 4-5 mm as n20,U approaches 0.2, while the maximum allowedλ
r tends to stay quite large ~ 40 mm. However it is seen that in order for the “most expected”equilibrium
λ
rto decrease below ~8 mm a simultaneous divertor temperature in excess of 100 eV is required. Such a high plasma temperature has never been observed in a divertor (but would be problematic for a divertor due to very high sputtering) even in the low-recycling or “sheath-limited” regimes which find maximum Tdiv <100 eV. It is beyond the scope of this paper to fully discuss this indetail, but it would seem likely that very high divertor temperatures (well in excess of 100’s of eV up to 1 keV) are disallowed due to thermal and ionization stability arguments for the SOL. Or stated another way there is a good reason one uses closed flux-surfaces to attain high T plasmas.
assumption it appears that the ITER heat width is robustly > 10 mm based on pressure/power balance and 1-3 mm widths do not appear possible if the ITER divertor temperature is < 100 eV. It is unclear at this point why this result is so inconsistent with some present empirical extrapolations [5,6]. It is suggested that considerations of pressure/power balance along the lines of the presented work be applied to the present database and analysis to determine issues of self-consistency.
5. Conclusions
A model independent of measuring power widths
λ
r is developed which constrains ITERλ
rbased on global power balance, momentum conservation and recent improvements in understanding pedestal stability and sheath heat transmission. Experimental measurements suggest a separatrix to pedestal pressure ratio ~5% for ITER. Applying the simple model indicates a constraint that the allowedλ
r~ 10-30 mm for ITER if the divertor is in the high-recycling regime as expected (divertor T~5-20 eV). With a high-recycling divertor, aλ
r~1 mm would require a separatrix pressure approximately equal to the pressure at the top of the pedestal clearly in violation of the concept of a pedestal. A weaker constraint is also applied in the model that upstream separatrix pressure and T must simultaneously satisfy power balance. Even assuming large uncertainties in the model, it is not possible to satisfy power balance with aλ
r< 4 mm even in the extreme case of divertor T > 100 eV.Acknowledgments
This work is supported by US DOE award DE-SC00-02060, contract DE-FC02-99ER54512 and cooperative agreement DE-FC02-04ER54698. DGW thanks R. Goldston for useful discussions.
References
[1] P.C. Stangeby ”The Plasma Boundary of Magnetic Fusion Devices,” IOP Publishing Ltd. (2000).
[2] R A Pitts et al Phys. Scr. T138 014001 (2009). [3] B. Lipschultz et al. Nucl. Fusion 47 1189 (2007). [4] B. LaBombard et al. Phys. Plasma 18 056104 (2011). [5] T. Eich, et al. Phys. Rev. Lett. 107 215001 (2011).
[6] M. Makowski, et al. “Analysis of a Multi-Machine Database on Divertor Heat Flux,” submitted to Physics of Plasmas (2012).
[7] R. Goldston, Nucl. Fusion 52 013009 (2012).
[8] A. Kallenbach, et al. J. Nucl. Mater. 337–339 381 (2005). [9] P. Snyder, et al. Nucl. Fusion 51 103016 (2011).
[10] D. Brunner, B. LaBombard Rev. Sci. Instrum. 83 033501 (2012). [11] M. Beurskens et al. Plasma Phys. Control. Fusion 51 124051 (2009). [12] A. Loarte, et al. J. Nucl. Mater. 266-269 587 (1999).
Figure Captions
Fig. 1
Measured ratios of divertor separatrix pressure to pressure at the top of the H-mode pedestal. C-Mod and DIII-D use divertor probes for divertor pressure and upstream Thomson Scattering for the pedestal pressure. The JET data point [10] from upstream data only. (Top) Ratio organized to q95
(Bottom) Ratio organized to global heating power density P/S. The star indicates expected value for ITER Q=10 H-mode scenario: q95~3, P/S~0.22 MW m-2. (Top Insert) Example pedestal pressure
profile and fit from C-Mod.
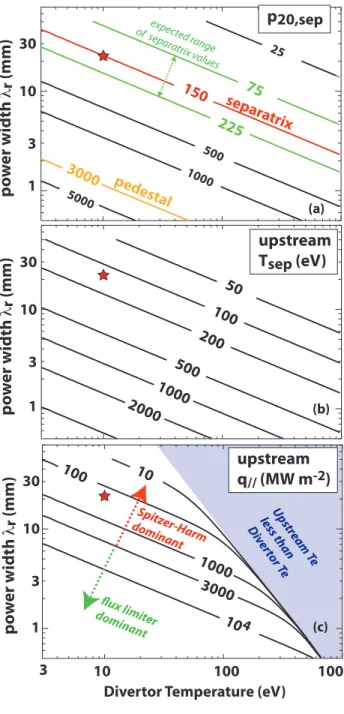
Fig. 2
Contours of model results versus assumed Tdiv and
λ
r for ITER Q=10 case of Pdiv = 50 MW,upstream density n20,U = 0.5, p20,ped ~3000 (a) Separatrix pressure required to satisfy divertor heat
exhaust. Red line: expected ITER value for p20,sep ~ 5% (Fig. 1) of p20,ped denoted by orange line (b)
Upstream electron temperature assuming Ti,U=2Te,U. (c) Upstream parallel heat flux. Regions where
Spitzer-Harm conductivity or flux limiters dominant are noted as well as disallowed regions due to divertor T exceeding upstream T. Star indicates most expected value if ITER divertor T = 10 eV.
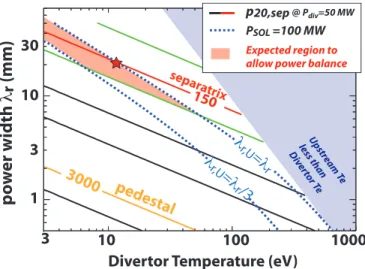
Fig. 3
Integrated contour plot of model for ITER Q=10, Pdiv = 50 MW, upstream density n20,U = 0.5, p20,ped
~3000. Solid line contours: separatrix pressure required to satisfy divertor heat exhaust (Fig. 2). Dashed line contours: upstream PSOL =100 SOL power exhaust from product of upstream q//,U (Fig. 2)
and
A
q//, U∝
λ
r, U for two different limiting assumptions of the upstream width compared to thedivertor width. Shaded blue region is disallowed due to divertor T exceeding upstream T. Star indicates where Pdiv and PSOL are simultaneously satisfied. The red shaded region indicates expected
Fig. 4
Sensitivity of model results for allowed Tdiv (bottom) and
λ
r (top) to assumed upstream density n20,Ufor case: Pdiv = 50 MW, PSOL=100 MW, Ti,U=2Te,U. Diamonds: Pdiv=50 MW and PSOL =100 MW are
exactly satisfied. Squared and triangles denote allowed range for minimum and maximum
λ
r respectively. The shaded red region of Fig. 3 shows an example of how the range is determined.Fig. 1
C-Mod R=0.67m DIII-D R=1.67 m JET R= 2.9 m
Pheat / Surface Area (MW m-2)
0.1 0.3 1.0 0.03 psep pped ITER 0.1 0.01 psep pped 0.1 0.01 q95 2 4 8 10 ITER r/a 1.0 0.95 0.9 pe,20 103 102 10 TS datafit #1000616008
Fig. 2 po w er w id th λr (mm) 1 10 30 3
Divertor Temperature (eV)
10 100 1000 3 150 75 225 3000 1000500 5000 25 separ atrix pedestal 500 50 100 200 1000 2000 100 1000 3000 104 10 po w er w id th λr (mm) 1 10 30 3 po w er w id th λr (mm) 1 10 30 3 p20,sep upstream q//(MW m-2) upstream Tsep (eV)
flux limiter dominant Spitzer-Harm dominant Upstre am Te les s th an Diver tor Te expected rang e of separ atrix v alues (a) (b) (c)
Fig. 3 Up stream Te les s than Diver tor Te 150 3000 pedestal
Divertor Temperature (eV)
10 100 1000 3 po w er w id th λr (mm) 1 10 30 3 separ atrix p20,sep @ Pdiv=50 MW PSOL =100 MW Expected region to allow power balance
λr,U =λr λr,U
Fig. 4
upstream separatrix: density (n20)
or Greenwald fraction 0.1 0.2 0.3 0.4 0.5 D iv er to r T (e V ) H ea t w id th λr (mm) 10 100 1000 1 10 100 4 40 p20,div = 150 PSOL=100 MW min. allowed λr max. allowed λr Evaluation criterion