Corporate Subsidies In Maine: What Mainers Got For Their Money
by
Stacey A. Cordeiro
BA in Sociology and Psychology Boston University
Boston, MA (1995)
Submitted to the Department of Urban Studies and Planning in partial fulfillment of the requirements for the degree of
Master in City Planning at the
MASSACHUSETTS INSTITUTE OF TECHNOLOGY
June 2000
@2000 Massachusetts Institute of Technology
All Rights Reserved
Department of Urban Studies and Planning May 18, 2000
2/
~,?
Certified by
Karl F. Seidman, Lecturer Department of Urban Studies and Planning Thesis Supervisor
Accepted by
Associate Professor Paul Smoke Chair, MCP Committee Department of Urban Studies and Planning MASSACHUSET OF TECH
ROTCH.
AUG 0
LIBRA 06IN111ult 2 200 RIES AuthorCorporate Subsidies In Maine: What Mainers Got For Their Money
by
Stacey A. Cordeiro
Submitted to the Department of Urban Studies and Planning on May 18, 2000 in partial fulfillment of the
requirements for the Degree of Master in City Planning
ABSTRACT
New legislation in the State of Maine mandating the disclosure of business incentive payments by the State to private businesses has made possible an examination of how this money was spent. An analysis was conducted on publicly available data, which were derived from reports filed by 188 companies that received subsidies from the State of Maine in 1998.
Because of significant flaws in the data, generalizations are hazardous. However, three major sets of findings were evident: while the major goal of the program was job
creation, followed by job retention, most of the money spent on business incentives was could not be linked to specific job retention or creation numbers. Of money that was associated with a job retention or creation claim, much more money was spent on retention, and many more jobs were retained than created. Second, job creation was, consistent with stated goals, concentrated in areas of the state outside the typically more prosperous southern coast region, although overall investment was not. Finally, the programs show a defacto strategy of industrial retention, although this goal was not an explicit strategy by the State. While a conventional strategy for economic development, it is important that the goals of the program emerge from public consensus.
Recommendations include further research to refine self-reported claims of job creation and retention, improvements in reporting requirements, more explicit targeting of incentive programs, and more extensive accountability measures to ensure that Mainers are getting a good value for their money.
Thesis Supervisor: Karl F. Seidman Title: Lecturer in Economic Development
Table of Contents
Table of Contents ... 3
Chapter 1: Introduction ... 4
M ethodology ... 6
Chapter 2: Background... 11
Tax Incentives in business location decisions ... 11
D o taxes m atter? ... ... ... ...... 11
W hy do they m atter?... ... ... ... . . 15
A ctivism in corporate subsidies ... 16
M aine's Incentive program s ... 19
Chapter 3: D ata A nalysis ... 25
W hat M aine Bought... 25
W here M aine's incentives w ent... . 31
W hich Industries M aine supported ... . 34
Grow ing or D eclining Industries?... .. ... ... ... . . .. 34
Industrial M ix... .36
Chapter 4: Conclusions and Recommendations ... 38
Further Research ... 39
Reporting Requirem ents ... 40
Targeted Incentives... 41
A ccountability M easures ... 42
Bibliography ...-- 44
A ppendix A : M aine's Disclosure Law ... 46
"The reality is, when I'm negotiating, I don't even know the real cost of what I'm putting on the table or the value of what the firm is offering. We're just shooting in the dark.",
-Deputy commissioner of Chicago's Department of Planning and Development, after losing 1000 warehousing and distribution jobs with the Spiegel Corporation to Columbus, Ohio in 1992.
Chapter 1: Introduction
In 1976, Business Week reported on a new "war between the states"2 in the form of tax incentives that were being used to lure businesses from one state to another. A quarter-century later, business incentives have grown dramatically in scale. They are now so common that states and local governments that do not provide them are sometimes thought to be at a disadvantage. Governments have been known to bow to competitive pressures, against their better judgment and against the evidence of research that shows no relation between these incentives and economic development. Some of the flagship deals include Alabama's bargain with Mercedes-Benz, valued at $170,000 per job, and Kentucky's incentive package for a steel "mini-mill", which may have cost as much as
$350,000 each for 400 jobs. Maine recently joined this big-ticket club, with an incentive
package of almost ten million dollars granted to National Semiconductor in 1998 alone. In exchange, the company increased its full time employment by 73 jobs, putting the cost-per-job at $135,0003. The hefty subsidies paid to National Semiconductor have been harshly criticized, since the plant has not reached even half of its capacity since its
construction in 1995, and its owners came close to selling it in 19994.
In 1998, annual spending on business incentives by state and local governments was estimated at over $50 billion. According to In These Times, "That is more than the yearly national budget for welfare grants and food stamps - and doesn't even include federal
corporate subsidies which depending on how you slice them amount to another $75
'As quoted in Wiewel 1994.
2 Anonymous (Business Week) 1976.
3 Breslow 1999.
billion to $167 billion a year."5 Timothy Bartik further estimates that these subsidies exceed the funding of economic development programs by a margin of 3:1 to 8:1.6 This paper focuses on incentives for businesses to expand and retain employment in the State of Maine. As will be described later, the two main programs Maine uses for this purpose are a rebate on local property taxes, and a Tax Increment Financing (TIF) program, where businesses can negotiate deals with local governments to rebate the portion of their property taxes that are the result of an investment in buildings and machinery. The rebate may be direct, or it may take the form of a bond issue, to be paid back using the tax increment.
The problem of business incentives in the form of tax breaks (some consider this a form of corporate subsidy) is an interesting one. Since incentives are not generally regarded as good policy, they are often created not to compliment an existing economic development strategy, but simply to compete with other states in a now-famous 'race to the bottom'. Further, incentive programs are usually created by legislatures, not by economic development agencies, and are therefore designed with the sponsors' interests in mind. An added complication, which is something Maine has wrestled with, is that development
incentives, in the form of tax abatements and TIF deals, are negotiated by local governments, but are regulated by the State.
It is my intention in this paper to examine the State of Maine's development incentives in the light of common economic development strategies. Maine presents a useful case
study because of its new disclosure law, which makes extensive data available for the first time about the amounts and recipients of subsidies. Hopefully, this study will result in recommendations for bridging the gap between economic development strategy and the political pressures that result in such roundly criticized expenditures of public funds. The following chapter outlines major research in the area of development incentives, showing that the effectiveness of tax breaks as an economic development strategy is
highly questionable, but often considered a necessary evil by elected officials and
5 Anonymous (In These Times) 1998. 6 Bartik 1994 (2).
economic development professionals. It then describes the incentive programs currently being used by the State of Maine and the intended results of these programs, attempts at citizen action to change the rules governing business incentives, and various ways incentives can be targeted toward economic development goals. Chapter three examines the data made available by Maine's disclosure law and shows how the money was spent, as well as in what regions and industries, and for what types of jobs. The final chapter presents conclusions and recommendations based on these findings.
Methodology
The State of Maine has been using business development incentives since the mid 1980s , and an estimated 1,400 businesses receive some kind of assistance from the State each year8. Under pressure from critics of the subsidy programs, the Maine Legislature in
1998 passed "An Act on Return on Public Investment From Economic Development
Incentives" (see Appendix A for text of the Statute). This law requires reporting by both the State agencies administering the subsidies and the firms receiving them. Only those businesses that received more than $10,000 in assistance during 1998 were to be included in the reports, and only seven of Maine's 36 business incentive programs9 were subject to reporting requirements. According to James Nimon of the Department of Economic and
Community Development, the decision to include these seven and not the others was somewhat arbitrary, and the result of political wrangling over the issue on the floor of the legislature'0. In the end, Maine's two largest incentive programs were included in the disclosure law, and many of the others are negligible in comparison.
About 300 firms should have filed reports with the State". However, only 188 did so, and of these, several had missing or inadequate information. The reporting form and instructions are included as Appendix B. Businesses were asked to report on the amount of subsidy they received during the 1998 calendar year in each of the seven incentive categories, jobs created and retained as a result of the subsidy, 1998 year-end
7 Maine Department of Economic and Community Development 2000. 8 Carrier 1999.
9 Editor (Bangor Daily News) 1999 (2).
'0 Nimon 2000.
employment, and actual employment change for 1998. Figures for job creation and retention, as well as year-end employment, were broken down by twelve occupational categories.
The most common method used to evaluate business incentive programs is to calculate the total money spent per business and divide this by the number of jobs created.
Obviously, several problems arise with this method of comparing the dollar value of the subsidy to the number of jobs gained or lost. First, the true costs of the subsidy are not just the dollar value of the subsidy, as subsidies take different forms such as Tax
Increment Financing, Industrial Development Bonds, Infrastructure Investments, Loan Guarantees, grants for job training, and infrastructure investments, to name a few. The costs could include actual state tax revenues and federal grants, as well as the opportunity costs of foregone revenue or spending elsewhere. True benefits are even harder to measure, as they could include variables such as the increased income taxes paid by the workers, increased sales and corporate taxes due to increased business in the state, and multiplier effects of employment income and increased output.
Further, creating a cost-per-job figure is often misleading, because some methods calculate this figure using a one-time cost, while others use an annual cost. Using the example given in the introduction of the "mini-mill" in Kentucky, the figure of $350,000 per job was obtained by considering the subsidy a one-time expenditure. However, the
actual package of incentives used in this deal consisted in large part of tax credits that will be spread over a 25-year period. On a net present value basis, the cost per job figure is reduced to $102,000 2. While still a high price tag, this is a dramatically different figure than the first.
In addition to these difficulties in measurement, the "but for" question raises issues affecting the accuracy of creation and retention numbers. That is: "But for the subsidy, what would have happened to employment in subsidized firms?" Creation claims can be verified to some degree by comparing them to overall changes in employment. However, claims that jobs were retained are nearly impossible to verify, particularly because most
private business information is not publicly available. In either case, the important question is whether the jobs would have been created or retained even without the subsidy. The only way to reliably determine this would be to set up a quasi-experimental study, in which firms receiving a subsidy were matched to firms not receiving the
subsidy. As this is outside the scope of my research, I will use what information is available to answer this question. In addition to the quantitative questions on the State of Maine's disclosure form, respondents were also asked to respond to the question, "Where would your company be if these incentives were not available to you?" (see Appendix B) While undeniably vague, this question provides some insight into the "but for" question. Given the difficulty of assigning a cost-per-job figure to development incentives, as well as the questionable value of such a figure, I have tried to provide a more informative evaluation of Maine's development incentive expenditures. I have looked for evidence of
strategies and goals that the drafters of the incentive legislation intended, in order to compare these to the actual results of the programs. In addition, I have given
consideration to what activists believe the strategy of the programs should be, as well as what conventional economic development theory suggests the goals might be. Chapter two gives more information about what these goals might be, and Chapter three presents
my findings on how well Maine's incentive programs are meeting these goals.
The data I use in this paper has some limitations. First, since this was the first year the reporting was required, the survey instrument used by the State seems to have been confusing to respondents. James Nimon reports that he received many telephone calls from respondents who did not know how to answer the questions on creation and retention, and that many felt such numbers could not even be determined. Additionally, several businesses omitted information without comment, and many did not return the survey at all. Clearly, this introduces a bias into an analysis of the available data. Another serious limitation of these data is that the person who returned the survey was not necessarily the person who would have made decisions about investment or
employment levels. Therefore, many of the answers, particularly in the qualitative section, reflected the uncertainty of the person answering the survey, who in many cases
would not have been included in the decision to hire more people, and who might not have known if job losses were imminent.
Finally, perhaps the most serious limitation of this information is that it is self-reported. The firms responding to the survey had a clear motive to exaggerate job creation and retention claims, since further funding for the programs depends in large part on public opinion, and public opinion probably depends on job creation figures. Conversely, firms are aware of how difficult it is to verify these numbers, and no penalties are in place for giving misleading information on these forms, so there was really no reason not to give the highest numbers they could. Many firms actually gave job creation numbers that were actually impossible -job creation figures were larger than the change in
employment for the firm, and job retention figures were larger than overall employment. It is not known how many firms should have returned a reporting form to the State of Maine, but estimates are between 250 and 300. 188 firms returned forms. Of these 188,
90 made some claim of job creation or retention. 66 claimed job creation, and 69 claimed
retention (45 claimed both).
There were some serious problems with the data. First, 17 firms (9%) did not offer any information about beginning and ending employment levels for 1998. One of these, however, still claimed job creation and retention.
Second, many errors were made in the reporting of job creation and retention.
Specifically, 38 of 66 firms that claimed creation (58%), reported job creation figures that were larger than the actual increase in jobs over that time period. Some of these (13) even claimed job creation, even though employment declined during 1998. It may be possible that some jobs were created, even though overall employment decreased.
Results for job retention were similar, though not as severe. Of the 69 firms that claimed retention, 14 (20%) reported retention claims that were larger than their beginning
employment. That is, they claimed to have retained more jobs than they actually started with. Of these, three listed 1997 employment levels as zero.
Additionally, 20 firms reported creation and retention numbers that did not add up because, had each of their claims been correct, their expected 1998 employment but for the subsidy would have been less than zero, which is impossible.
Another possible error was that 12 firms reported job creation numbers that were exactly equal to job retention numbers. That is, reports of jobs created were the same as jobs retained for full-time, part-time, and total jobs. While it is possible that these numbers could be exactly the same, it is likely that this was an error by the reporter, due to a misunderstanding of the reporting categories.
These errors all constitute serious flaws in the data. If all observations including one of these errors are excluded from the analysis, 122 cases are left of the original 188 (since many reports contained more than one error, the number of errors does not add up to the number of excluded firms). This is 65% of the reporting firms, and between 41% and 49% of the firms that probably should have reported.
When determining errors, I always compared full-time jobs to each other and part-time jobs to each other. For example, one firm reported a 1997 year-end employment level of 20 full-time and 80 part-time employees and a 1998 year-end employment of 40 full-time
and 145 part-time. This firm was excluded because it reported a job creation of 25 full-time jobs, while full-full-time employment only rose by 20 jobs. If I had only used total
employment figures, this firm would not have been excluded, as 25 jobs is fewer than the firm's overall job growth from 100 to 185 employees.
Chapter 2: Background
Tax Incentives in business location decisions
Much has been written on the effects of taxation on business location decisions. In this paper, I'm interested in not only location decisions, but decisions about investment and disinvestment. The results in this area have been mixed, with some researchers claiming that taxation has a significant effect, while others say it is negligible. This section will review literature on two questions: do tax incentives matter to location and investment decisions, and if so, why? It will then go on to discuss one of the few things we can tell with some certainty from the literature: that taxation is a more significant factor in intra-regional location decisions than in inter-intra-regional ones.
Do taxes matter?
Taxes matter to the extent that they are considered, along with many other factors, in decisions about locating or investing in a business. But relative to other factors, they have very little influence on these decisions. Robert Ady, a facility location consultant for Deloitte & Touche/Fantus Consulting, says that, while reporting on tax rates is part of his job, neither he nor his clients felt that taxes were an important factor in location decisions. Ady's clients were asked to assign percentages of relative importance to broad
classes of location factors: labor, transportation, utilities, occupancy, and taxes, and taxes came in last with just 4%". In the end, Ady concluded, "The single most important factor in site selection today is the quality of the available work force".
Some researchers have found evidence that levels of taxation make a difference. For example, in 1987, Leslie Papke found that differences in overall tax burden among regions were statistically significant and were inversely related to both the level and placement of capital investment. More broadly, Timothy Bartik saw a relationship
13 Ady 1997.
between tax rates at the state and local level and employment growth. He asserted that a
10% increase in taxes would cause a decline in jobs of 3.3% in the long run".
On the other hand, Russell Hanson found that "incentives have marginal, if any, influence on business location decisions" 1, and others have concurred. According to Schweke,
"Incentives are not good development policy. In using them to attract businesses, we waste scarce public dollars but do not create any net new jobs in the vast majority of cases. (In other words, it may decide where the jobs are created but not whether the jobs are generated.) In effect, we are subsidizing the shareholders of these companies for economic actions they would usually have taken anyway."17 (parentheses in original) The situation is similar for the question of job retention. Wiewel says, "Research on relocating firms points to space constraints and ownership of existing facilities as the most important determinants of moving. In most cases, expanding firms are constrained
from staying in the city by the difficulties of assembling land, environmental problems, or other externalities."' 8
Blair's conclusion about tax incentives is probably the best summary of the various opinions: "...it would be imprudent to ignore taxes as one of the important factors that influence the industrial development of regions. Nevertheless, the preponderance of evidence shows that state and local tax policies alone will do little to change the economic fortune of regions." 1
As these few examples illustrate, different authors draw different conclusions from the available evidence. Among others, Bartik has pointed out that "equally competent" studies on this topic produce "widely divergent" and "fragile" results. The disagreement among academics is reflected in practice. Some evidence of this is available in the ambiguous findings of a 1993 Deloitte & Touche study of economic development practitioners in which 49 percent "believed that jurisdictions would be better off with no
'" Bartik 1992.
16 Hanson 1992. 17 Schweke 1996. 18 Wiewel 1994. 19 Blair 1995.
incentives. However, in the same survey 63 percent of the practitioners responded that communities without incentives are competitively disadvantaged."2 0 The efficacy of tax
incentives for economic development purposes is largely a matter of opinion.
These differences of opinion originate in a few major places. One is the difficulty of operationalizing the variables to study. Herbert Rubin has described economic
development as an "inherently ambiguous" conceptl, and this ambiguity is evident when looking for endpoints to study. Broad variables such as overall growth and employment levels don't work because they don't have adequate comparisons, and there are too many other factors that can influence them to separate the effect from tax policy. Many studies end up using self-reported data such as the number of jobs created for lack of other variables. Even then, job creation figures are dubious, because it is difficult to tell when a
job was actually 'created' and when it would have just appeared elsewhere.
The issue of whether a job was really created or if it was only relocated is a problem of defining the area to be studied. Similar problems arise when defining the population under consideration. Tax incentives are not only criticized as transfers from taxpayers to
corporations, but their benefits are also thought to accrue to new workers that are attracted to a place for the new jobs, rather than the people who lived there already. An example of this is a study by Bartik, which showed that for each 100 jobs created, the distribution would be as follows: "6 or 7 to local residents who would otherwise be unemployed, 16 to local residents who would otherwise be out of the labor force, and 77
,22
or 78 in-migrants"
Tax incentives, as well as other development policies, also vary by region and industry. While some industries may require very particular locational factors such as access to transportation, a highly qualified labor force (or conversely, a very inexpensive labor force), others have greater consideration for the quality of life of the area, in order to attract employees for whom this is important. Even worse, if the importance of tax incentives is a matter of opinion for academics and practioners of economic development,
20 As reported in Sheldon 1994. 21 Rubin 1988.
it is probably even more so for the executives who make investment and location
decisions. For some, a marginal effect on the bottom line may be important. Others may be picky about their ideas of what a "business climate" should be like. Given this
subjectivity, a good question for localities faced with competition in business incentives would be, 'For what kinds of firms is a small difference in taxation an issue, and are these the kinds of firms we want to attract?'
Even with all this uncertainty, there are some things that are fairly clear. One is that taxation matters more within regions than across regions. In a meta-analysis of empirical studies, Wasylenko estimates an interregional elasticity of -0.2 and at least -0.8
intraregionally2 3. This is intuitive, considering that tax rates show more variation within
than across states, especially in the case of property taxes, which are the most frequent candidates for abatement. Ady confirms these findings in his account of how location decisions are made. A detailed estimate of overall tax burden is usually not even made, he says, until the mostly likely region for location has been identified. "The only case where taxes along could sway a location decision is a company relocation within a city or
metropolitan area, where labor, transportation, and utility costs are consistent. Then tax variations, and frequently occupancy costs, can be the final determinant" .
However, even here there is not consensus. Schmenner, for example, found that, when relocating, firms that stayed within a 20 mile radius more often chose a site where the taxes were at least as high as where they left, while firms that moved over 20 miles "generally select lower tax locations"2 6
One more interesting finding is particularly relevant to this research. As might be expected, corporate profit tax levels are more important in capital-intensive industries.
23 Wasylenko 1997.
24 Chamey 1983.
25 Ady, 1997.
26 Schmenner 1982. 27 Bartik 1984.
Why do they matter?
Perhaps one of the best reasons we still care so much about tax incentives, despite the sketchy evidence that they are useful, is simply that we can see them. Blair says taxation may receive more attention than its due because it is measurable28. While it doesn't clearly doesn't have a dramatic effect on the bottom line, it is quantifiable, and numbers can make it seem dramatic, when considered next to more important, but less tangible, factors.
Blair goes on to describe a second reason: that taxation is also a large part of the 'business climate', which is a much more "slippery" concept. The business climate is largely subjective, both in definition and in the weight given it. It could be considered a collection of factors that add to the impression of the State's good will to businesses, or a heuristic device used by executives to guess what kinds of policies the State might enact toward business in the future. What these decision makers really need to know is the
certainty of their financial position, which is crucial in making long-term plans, and the business climate is often the tool they use to estimate this position.
Ady's account of location decisions also indicates that tax rates are used more often as symbols of less tangible factors than for their real value. At the initial stages of screening locations, "...if any state is not reasonably competitive with the others based upon
... general tax inputs, it will probably be eliminated", he reports. That is, if one state has a corporate tax levy that is a few points or more above the others, it "may be eliminated, even though actual corporate income taxes for the project have not been calculated." Swanstrom aptly characterized this attitude, when he called tax breaks for businesses "symbolic reassurances" from local governments2 9
Margaret Dewar has offered another theory to explain the persistence of tax incentives as economic development policy. Politicians, she says, benefit from the ability to claim responsibility for high-profile plant births and expansions and the jobs they bring, so they have a strong motivation to offer incentives to enhance their own political power". The
28 Blair 1995.
29 Swanstrom 1985.
same problems that make these claims hard to verify also make them hard to refute, and politicians are allowed to get away with their dubious claims. Schweke elaborates that in comparison to sounder methods of improving the economy such as investments in
education, tax deals provide more benefit to the politician, because "the benefits of success can happen during an elected official's term, while the additional costs and downside risks may occur later during another political administration"".
Activism in corporate subsidies
Business incentives have become an activist issue. Here is a list, compiled by Sheldon, of the most commonly cited reasons that writers and activists oppose corporate
subsidies3 2:
- They make little or no difference to location decisions
- They are unfair and inequitable - they shift the community's fiscal burdens to other taxpayers and/or contribute to a decline in service levels.
- They subsidize competitors, giving the recipient an unfair advantage - They penalize small businesses
- They are upwardly redistributive: benefits primarily accrue to corporations, their owners, and their managers.
- Practioners wrongly push incentives, due to the nature of their jobs. To make it look like they're producing something concrete, they include taxation factors where they don't belong.
- Governments shouldn't be picking and choosing businesses to subsidize, they should make their jurisdiction as attractive as possible to all kinds of business. - Location consultants are becoming bounty hunters - their pay has been known to
be linked to the dollar amount of the package they can deliver. - The system favors business over workers and taxpayers
- Incentives are symbolic politics - they have little real value, and are used by politicians for their own image.
Prominent among activists around the issue of corporate subsidies is Greg LeRoy of Good Jobs First!, a project of the Washington, D.C.-based Institute on Taxation and 31 Schweke 1996.
Economic Policy. LeRoy advocates limiting incentives to those that are connected with a specific return, such as job creation or retention, a net tax increase to the state, or
multiplier effects to the economy.
LeRoy outlines several actions that can be taken to make subsidies more accountable to government and taxpayers33. First and foremost is the provision of disclosure laws. The
basic knowledge of how much is being spent on incentives, as well as who benefits, has been almost universally unavailable, if not to government, to the citizens. Smart
disclosure laws allow the first step to accountability - transparency - and they allow an independent analysis of what the state is buying for taxpayers' money. Also along these lines is his call for public participation in the creation of subsidies: some have suggested that citizens should vote on large subsidy deals, or that they should have substantial representation on the boards that oversee and dispense incentive money.
Several of LeRoy's other proposals would create eligibility requirements for businesses to receive subsidies, and penalties if they violate these requirements. Requirements include job creation guarantees, advance notice of plant closings, job quality (wages, benefits, etc), environmental protection, and targeted hiring, for example to distressed regions. Enforcement would mostly take the form of "clawback" provisions: firms that
do not meet these requirements would be required to pay back the amount of the
government subsidy, plus interest. Further, firms that have a history of failing to live up to an agreement could be barred from further incentives, and firms would not be allowed to use the incentives to move jobs from one area to another.
LeRoy is not alone: new community groups have been organized around this issue. Citizen organizations working on these issues include the Minnesota Alliance for Progressive Action, and Connecticut's Citizens for Economic Opportunity. Maine also has activists working to change the laws governing incentives, including the Maine Citizen Leadership Fund and the Maine Center for Economic Policy36.
" LeRoy 1997.
34 Smith 1999.
3 Wong 1999
As these activists win such accountability measures, opportunities arise to examine the costs and benefits of state subsidies to corporations. Minnesota, for example, was one of the first states to introduce very strong disclosure and reporting laws. Their reporting law allowed the Institute on Taxation and Economic Policy to analyze data on subsidies given
by cities and towns to induce firms to locate, expand, or stay there. Their report3 7
uncovered 38 subsidies where the cost to the state per job created exceeded $100,000. In addition, the jobs "created" with state subsidies paid lower wages than the average job in Minnesota. The report was widely criticized as partisan, and one of the strongest
arguments against it was that the per-job cost figures were distorted by a detail in the law. To be eligible for subsidies, businesses must claim that they created at least one new job. When firms did not know how many jobs to attribute to the subsidy, they were instructed to report one job, to comply with this requirement38. When included in the overall analysis, these one-job reporters drove up the subsidy-per-job figure. However, it would be a reasonable criticism to dispute this reporting detail. If a firm cannot demonstrate how many jobs they created, they could be considered to have failed to meet the eligibility requirement.
Maine's new disclosure law invited a similar analysis. Marc Breslow recently completed an analysis using the data collected through the new disclosure law 9. In it, he found that jobs created in 1998 cost the state $36,000 each, averaged across the seven subsidy
categories. Broken down by category, however, tax credit programs cost $269,000 per
job, while programs for job training cost only $2,300 per job created. Additionally, he
found that while subsidized firms grew in terms of employment, they did so at a slower rate than Maine employment overall. The figures were 2.1% and 2.7%, respectively. Like the Minnesota study, Breslow's work on subsidies in the State of Maine was
criticized by proponents of the programs. The general complaint was the narrow focus of the study, that is, he focused on the cost per job created, without attempting to account for jobs retained, or the even less tangible benefits of greater cost-competitiveness of Maine's firms, and the overall business climate. A program administrator also
3 LeRoy 1999. 38 Isaacson 2000.
complained that some of the unimpressive results, especially the low response rate, were due to the reporting requirement being new and untested. In the 1999 reporting cycle, he said, many of these problems had been improved.
Maine's Incentive programs
The State of Maine's web site boasts that "compared to many other states, Maine offers more programs and resources to promote business growth, and is dedicated to bringing technology and a strong infrastructure to the State." The State programs that fall under the reporting law are as follows40:
- Business Equipment Tax Rebate (BETR) reimburses property taxes paid on new plants and equipment for 12 years. In 1996, approximately 30,000 firms were expected to file for the reimbursement4 . The program does not include office furniture. Businesses pay the local tax, and then file with Maine Revenue
Services within 60 days of payment, to receive a reimbursement from the State. Cost in 1998: $23.7 million (61% of total).
- Municipal Tax Increment Financing (MTIF, or TIF) allows towns and cities to exempt property taxes for specific business for up to 30 years. The municipality may either issue bonds to finance the investment or pay the money directly to the company undertaking the investment. Designation of a TIF district requires a public hearing and a majority vote by the local legislative body. A company receiving a TIF can receive a refund on a local tax bill and then submit the same tax bill to the state for a second refund under BETR.4 2 Cost in 1998: $9.5 million
(24% of total).
- Passed in response to concerns about corporate giveaways, Employment Tax Increment Financing (ETIF) will reimburse income taxes to businesses hiring at least 15 new employees within a two-year period, up to half of each employee's state payroll withholding each year. To qualify, a business must pay the new workers a higher wage than the average income in that county and provide health and retirement benefits. The business will be reimbursed for 30%, 50%, or 75% of income tax withholdings from new qualified employees, depending on
unemployment levels in the county. A company must also demonstrate that an
ETIF is an essential element to making a project work43. Cost in 1998: no firms received this subsidy in 1998.
- Governor's Training Initiative (GTI) gives partial reimbursement for training costs related to expansion, retention, or upgrading of a business. Employees hired under this program must receive a wage of at least 85% of the average for that
39Breslow 1999.
40 Where not otherwise specified, details of incentives are from Breslow 1999. 41 Porter 1996.
42 Porter 1996.
occupation in the relevant labor market, and the business must pay at least 50% of health insurance costs. Firms with fewer than 25 employees of those in business for fewer than three years are exempt from this requirement. Cost in 1998: $2.5 million (6% of total)
- Jobs and Investment Tax Credit (JITC) provides a credit against state income taxes of 10% of the investment amount. To qualify, a business must create 100 jobs and invest in property worth $5 million over two years. Utilities are
excluded and the size of the credit can vary, based on several factors. The benefit is capped at $500,000 annually, and participation in the program is limited to seven years. Jobs must pay higher wages than the average for the labor market area and must include health and retirement benefits. This cannot be used simultaneously with an ETIF. Cost in 1998: $1.7 million (1% of total).
- Maine Quality Centers (MQC) provide new or expanding firms free education and training to employees at the state's Technical Colleges. Eligible firms must create at least eight new full-time jobs with benefits in the state. Cost in 1998:
$1.6 million (4% of total).
- Research Expense Tax Credit (RETC) covers research expenses as defined by the IRS. To be eligible, these expenses must exceed the average research expenditure
by the company during the prior three years. The tax credit is 5% of the increase
in expenses, plus 7.5% of research payments to educational institutions. The credit is limited to the first $25,000 of tax, plus 75% of the tax over $25,000 per year, and unused credits can be carried forward for 15 years. Cost in 1998: $0.6 million (4% of total).
According to Jonathan Speros of KPMG Peat Marwick, a New England-based location assistance consulting firm, Maine is the 10th most expensive state in the nation in which to do business, but is the cheapest place in New England4 4. In 1994, independent candidate Angus King won the election for Governor of Maine on the issues of
improving the business climate and creating jobs in the state. Until then, he had been a successful businessman and radio show host, but this was his first race for public office. In 1999, the Portland Press Herald editorialized, "No issue defines Gov. King more than the Business Equipment Tax Reimbursement program."45
This program, known as BETR, was created in 1995 after a struggle between the new governor and the legislature over the two-year budget. While Maine had had business incentive programs for many years, including authorization for Municipal Tax Increment Financing (TIF) that dated from 1985, BETR soon became the largest of the State's *"Porter 1996.
business incentive programs. Expenditures through the BETR program in 1998 were
$23.7 million, and are projected to reach $68.5 million by 2003. Through the program,
businesses can apply for a reimbursement of municipal property taxes on machinery and equipment for up to twelve years. Businesses pay the local tax as usual, and then apply to the State for reimbursement, within 60 days.
In the few years since its inception, the program has been the subject of rancorous debate, and has been the point at which proponents and opponents of state assistance to business have been organized around. Early in 1999, the Maine Chamber and Business Alliance issued a policy statement called "Where We Stand", which urges the continuation of BETR. It reads, "The BETR program makes Maine a more attractive place for capital investment by removing the economic disincentive that municipal taxation of business machinery and equipment creates."46. Soon after, an editorial in the Portland Press Herald that even if BETR causes a loss of jobs in the short run by mechanizing their work, it preserves and creates jobs in the long run by helping firms be more competitive. "The BETR program ... stands strongly on macro-economic theory. When businesses invest in capital equipment, productivity rises, with pay and employment increasing in
"47
the overall economy."
Predictably, not all opinion has been this positive, and the program's most vocal
opponents include members of the legislature. Rep. Elizabeth Townsend, D-Portland, co-chair of the Legislature's Appropriations Committee, said of the program that she'd "like to see very clear documentation that is has produced jobs", and committee member Judith Powers, D-Rockport, says her "concern is that it's a train out of control."48 Several measures have been introduced in the legislature to limit the BETR program, but no legislator has yet proposed eliminating it. The only significant change to the program, outside the reporting requirement, was to make public utilities ineligible for the program in 1997, reducing the cost of the program by 15%4 . Other proposals have included
46 Quinn 1999.
47 Editor (Portland Press Herald) 1999
48 Carrier 1999.
49
limiting the term of reimbursement from twelve to three years5, and limiting the reimbursement amount to 90% or 75% (firms are currently reimbursed for 100% of the amount of their tax). A proposal to disqualify certain sectors, such as retail trade, failed
by a wide margin in the Senate.
Another proposal, which has also failed to pass so far, would eliminate the practice of "double-dipping". Under the present system, businesses that negotiate TIF deals with local governments can receive reimbursement from the BETR program for the same taxes that are also being used to finance the TIF deal. Since BETR and TIF are the largest expenditures made on development incentives, this reform has the most support. Even Governor King, who has threatened to veto whole budgets if they contain changes to his pet projects5', has indicated that he might support this change. Still, it failed in the Senate by a vote of 27-6. As the BETR program grows, so do the TIF deals. In the early years of the program, relatively few TIFs were negotiated by local governments. But in recent years, the number has grown considerably - there were 37 in 1993, the year before Governor King's election, and 118 in 1998, costing $9.5 million.
Gov King ran for reelection in 1998, again as an Independent, with opposition from all the major and minor parties. The Bangor Daily News printed statements from the candidates. Included was the question, "What would you do to bring jobs to Northern
and Eastern Maine?" While his enthusiasm for business incentives was well known, it was not part of his campaign rhetoric:
"My first priority is jobs (throughout the state, not just in southern Maine), ones that pay
more, have better benefits, and provide satisfaction, security, and opportunity for growth... Achieving my first priority will require a major restructuring of our
educational system, with greater emphasis on research and development, economies in administration, more focused and less redundant curricula at the various campuses, better use of distance leaming technology, development of a community college system around the university and tech colleges, better recruitment and retention. This is the key to achieving the breakthrough economic growth we seek.",2
His answer to question about bringing jobs to Northern and Eastern Maine was, "In the short term, we will continue to work with the area economic development organizations and do all the things that we've started - cut taxes, streamline regulations,
50 Ibid.
5' Turcotte 1999 (2).
lower Workers' Compensation costs, protect the environment, etc. In the long term, the key is investment in R&D and better education. If we do this, the new jobs with better pay and benefits will follow.""1
After Governor King's reelection, an editorial in Bangor Daily News said, "Maine is not, as BETR's staunchest supporters claim, one of only a few states that taxes business equipment - it is one of 39. And BETR is not, as detractors say, the only such program not tied to performance measures in economic development. Thirty states have programs like BETR. Not all reimburse so much for so long, but none effectively ensure that benefits extend beyond the business's bottom line."54
A Maine Sunday Telegram poll around 1996 showed that 51% of state residents polled
"favored lowering taxes on businesses so that companies will earn more money and hire more people; 68 percent of those surveyed favored giving tax breaks to businesses paying above average wages."55
An argument from the business community is that economic development and taxation policy needs to be consistents6. If the incentive is to make business equipment affordable for businesses, they have to know how long they'll be receiving the subsidy. In fact, the business community has rallied to the cause of BETR. An employee of the Mead paper
company distributed "BETR Works" stickers to people attending a hearing about limitations on subsidies57.
In August of 1999, Great Northern Paper mills in Millinocket and East Millinocket were sold by Botwater Inc of South Carolina to Inexcon of Quebec for $250 million. The new owners said they would cut between 200 and 225 jobs58. The year before, GNP had received $417,904 in investments, leveraging $25,183,816 in capital investments and
$2,997,543 in training investments, according to self-reported data. GNP's parent
company had announced about March 1998 that it was selling the Millinocket mill, but
5 Ibid
54 Editor (Bangor Daily News) 1999 (1). " Porter, 1997.
56 Hall 1999. 57 Turcotte 1999 (1). 5 Lagasse 1999 (2).
would invest $200 million in the E. Millinocket59. Unions tried without success to buy the Millinocket mill. GNP collected the incentive, and eventually both mills were sold. The new ownership said they have plans to invest $100 million for new paper machines, $20 million in the power system, and $20 million for a new satellite plant, to employ 3-5 people6 0. Also, they said most of the predicted layoffs had come through retirements.
59
Adams 1999.
Chapter 3: Data Analysis
A few results are evident from this cursory investigation into the intended results of
Maine's business incentives programs. The first is to create jobs in the state, and secondarily to retain jobs. The second is to create employment in the economically distressed counties in the North and East of the state, that is, away from the more urban Southern coast. And finally, while not explicit in statute or rhetoric, the design of these programs clearly indicates an intention to target investments in the manufacturing sector. This chapter will evaluate how well the incentives are meeting these goals.
What Maine Bought
Following the analysis Breslow has already conducted on these data, this section will elaborate on the levels of job creation and retention Maine taxpayers got for their money.
My calculations are substantially different from Breslow's numbers, largely because I
have tried to include job retention in the equation, as well as money spent with no creation or retention claim at all, but also in that my figures are based on total
employment levels, while he used only full time jobs. Since no information about how many hours were involved in part-time jobs was reported, it was not possible to give them their proper weight in these calculations. To solve this problem, Breslow decided to leave part time jobs out of his calculations, while I have counted them equally with full time jobs. This should not in itself create dramatic differences in our numbers, since only a small number of the job creation and retention claims involved part time jobs.
Overall, the State of Maine spent $13,313,042 on the 122 firms included in this data set. As a whole, these businesses claimed to have created 517 jobs, and retained 5,036 more.
The average cost to the state was $2,397 per job. However, firms with errors on their reporting forms (those that were excluded from this analysis) were about one third of those who returned disclosure forms, but they were the recipients of almost two thirds of
the money spent by the state. Altogether, $22,252,683 was paid to the 66 firms that provided inadequate data for analysis.
- - -~--- -~ ,- - ,w rm~1iE5P=~-
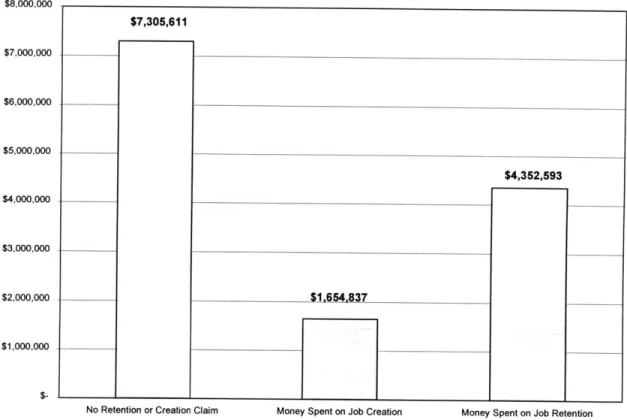
-Figure 1: Categories of Spending by the State of Maine on Development Incentives, 1998
$8,000000 $7,305,611 $7,000,000 $6,000,000 $5,000,000 $4,352,593 $4,000,000 $3,000,000 $2,000,000 $1,654,837 $1,000,000
No Retention or Creation Claim Money Spent on Job Creation Money Spent on Job Retention
Source: Author's calculations from Maine Economic Development Incentive Report data
Of the 122 firms that returned reporting forms, 82 did not claim any job creation or
retention at all. These firms accounted for $7,305,611 of incentives. The firms receiving incentives reported a total of 517 jobs created. Total money spent on creation was
$1,654,837, averaging $3,201 per job. Likewise, firms receiving incentives reported 5,036 jobs retained. Total money spent on retention was $4,352,593, averaging $864 per job. While these figures are low, it should be noted that they do not include the expense
of over seven million dollars, which was not associated with any job creation or retention claim at all, and that this was the largest category of incentive money.
To break up subsidy amounts by jobs retained and created, I added all the jobs created and retained by each company and divided these by the total subsidy received by that company to get a crude measure of the money spent on each job. While creation and retention may be more or less valuable depending on the observer, there is no objective criterion to value them by, so I weighted them equally. I then calculated figures for the total amount spent on job creation and retention for each firm, by multiplying the per-job
figure for that firm by the number of jobs created and/or retained. Finally, by summing the total figures spent on creation and the total figures spent on retention, and dividing these by total number of jobs created and retained, respectively, I arrived at the average per-job creation and retention price tags stated above. Again, it should be noted that these figures also include part time jobs, in part because no information is available about these jobs that would allow me to weight them properly. (But this shouldn't make much difference - 5026 of 5036 jobs retained were full time, and 514 of 517 jobs created were
full time).
The highest cost per job created or retained was Specialty Minerals, which received a subsidy of $36,435 for each of eight jobs it claimed to have created. C.M. Almy was not far behind, at $35,153 for each of 3 created and 5 it claims to have retained. $35,000 is a significant level, since , as Breslow reports, "two federal agencies, the Department of Housing and Urban Development and the Small Business Administration, have a limit of $35,000 per job". However, this limit is the cap for the lifetime of the subsidy, and here we are looking at annual figures. If the federal standard were applied to these subsidies, many more would be ineligible. Overall, the largest subsidy of the 122 went to Fraser Papers, which received $1,060,000. The National Semiconductor deal, referred to in the introduction, was excluded from this analysis because of reporting errors, as were several of the larger deals.
A better comparison would be to look at what the firm said would happen to employment
"but for" the assistance from the State. I constructed categories of "but for" scenarios by subtracting job creation and retention claims from actual 1998 employment. Those firms that had zero employment in 1997 but not 1998 were classified as Startups. Those whose "but for" employment figure was larger than or equal to their actual 1997 employment were judged as firms that would have increased employment even without the subsidy (the subsidy would then be considered to have added additional employees), and those with "but for" employment less than 1997 levels were considered likely to have lost employment. Of these, a few attributed all of 1998 employment to creation or retention due to the subsidy, and those were classified as likely to have shut down without
assistance from the state. The figures that follow make use of these constructed categories.
Table 1 shows a more detailed breakdown of how Maine's business incentive spending was used. Altogether, 2% of the money was spent for startups, 17% to avert shutdowns,
and 44% to preserve jobs that might have been lost. However, 37% of the money went to firms that, by their own figures, estimated that they would have added employment anyway, although not as much as with the subsidy.
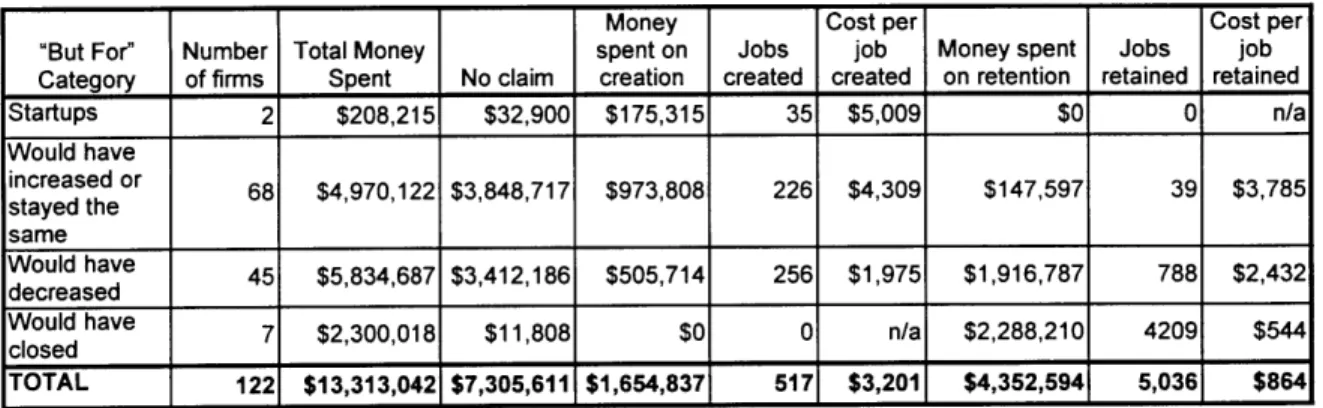
Table 1: Summary of Incentive Spending and Effects, by "But For" categories
Money Cost per Cost per
"But For" Number Total Money spent on Jobs job Money spent Jobs job
Category of firms Spent No claim creation created created on retention retained retained
Startups 2 $208,215 $32,900 $175,315 35 $5,009 $0 0 n/a Would have increased or 68 $4,970,122 $3,848,717 $973,808 226 $4,309 $147,597 39 $3,785 stayed the same Would have 45 $5,834,687 $3,412,186 $505,714 256 $1,975 $1,916,787 788 $2,432 decreased ___________
Would have 7 $2,300,018 $11,808 $0 0 n/a $2,288,210 4209 $544
closed _______________
TOTAL 122 $13,313,042 $7,305,611 $1,654,837 517 $3,201 $4,352,594 5,036 $864
Source: Author's calculations from Maine Economic Development Incentive Report data
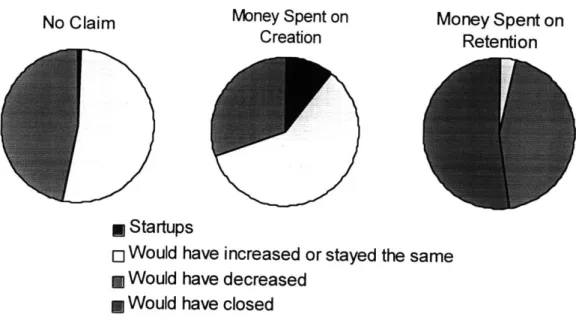
Using these more detailed figures, it is possible to break down each of the three broad categories of spending: money spent on creation, money spent on retention, and money not associated with a creation or retention claim, by their "but for" categories. The following pie charts show how each of the three broad spending categories breaks down.
Figure 2: Proportion of Incentive Spending Used for Business by "But For" Categories
No Claim
Money Spent on
Money Spent on
Creation
Retention
* Startups
o
Would have increased or stayed the same
* Would have decreased
* Would have closed
Source: Author's calculations from Maine Economic Development Incentive Report data
Of the $7.3 million spent on firms that did not associate the money with any employment
gains or retention, 53% went to those businesses that added employment in 1998, and 47% to those that lost employment. (Since in this category there were no claims about the subsidy assisting in job creation or retention, actual 1998 employment levels were equal to the "but for" employment level.) Money spent on creation totaled $1.7 million, with 58% of this being used by firms that would have added employment anyway to increase the hiring of new employees. 31% was spent on firms that otherwise would have lost employment, and 11% of this money was used for job creation at startup companies. Finally, the category of money spent on job retention breaks down into 44% spent on retaining employment that might have disappeared, 3% spent on retention
claims by firms that would have kept all their jobs, and 53% used to retain jobs that could have been loss to a plant closure.
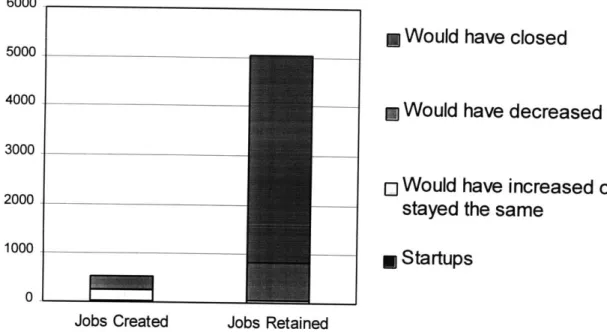
Figure 3: Number of Jobs Created and Retained, by "But For" Categories
6000
* Would have closed
5000
4000
*
Would have decreased
3000
o
Would have increased or
2000
stayed the same
1000
*
Startups
0
Jobs Created Jobs Retained
Source: Author's calculations from Maine Economic Development Incentive Report data
This chart shows a break down of the number of jobs created and retained by the "but for" categories explained above. What is remarkable is that, although relatively few firms (7) claimed that they would have closed without the subsidy from the state, employment in those firms accounts for the vast majority of jobs retained overall.
Specifically, 4,209 of the 5,036 jobs that firms say were retained as a result of
development incentives (84%) would have been lost due to plant closures, if the retention claims are correct. The dollar amount of cost per job retained overall is very low ($864), but it falls even lower if we consider only those jobs preserved due to averted closures
($561). It is helpful that, although these claims are dramatic, impending plant closures
are probably easier to verify than disinvestment, which accounts for most of the rest of the retention category.
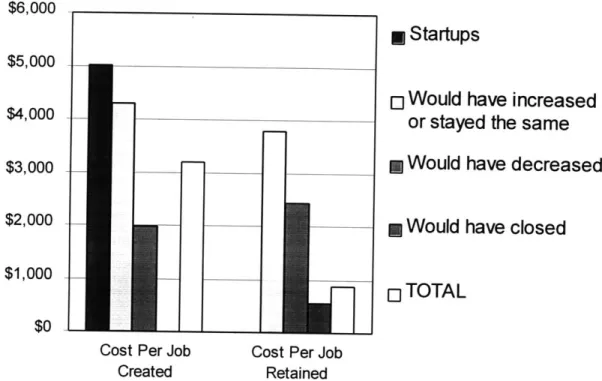
Figure 4: Cost Per Job Created and Retained, by "But For" Categories
$6,000
N
Startups
$5,000
0
Would have increased
$4,000
-
or stayed the same
$3,000
*
Would have decreased
$2,000
-
Would have closed
$1,000 - 0
TOTAL
$0
Cost Per Job Cost Per Job
Created Retained
Source: Author's calculations from Maine Economic Development Incentive Report data
In fact, cost-per-job figures vary considerably depending on whether we mean jobs created or retained, as well as on the "but for" category the subsidized firm falls into. This graph shows cost per job figures for all these classifications. As stated above, the overall cost per job created is just over $3,000 each, and the cost per job retained is under
$1,000. Jobs at startups were the most expensive, at $5,000 each. In terms of both
creation and retention, additional employment added at firms that would have expanded anyway was relatively expensive, and jobs created and retained that were facing
disinvestments were relatively cheap. Based on these numbers, jobs retained at firms facing closure were a bargain.
Where Maine's incentives went
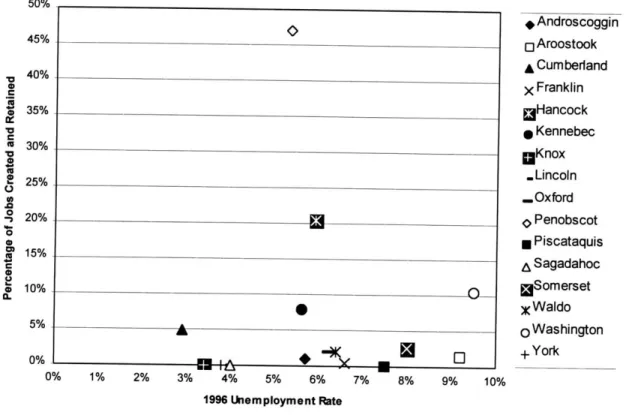
The second objective was to bring jobs to Maine's less prosperous counties. The
following chart shows how many jobs were created in each county, in relation to the 1996 unemployment rate in that county. The distribution does not indicate a relationship
between the unemployment rate and the number of jobs being created in the county, although most of the jobs created and retained (73%) were located outside the southern coastal counties.
Figure 5: Distribution by County of Jobs Created and Retained
50% * Androscoggin 45% 0 Aroostook A Cumberland V40%X Franklin 35% aHancock V Kennebec W 30% *Knox V .Lincoln
S..Oxford
10 20% 0 Penobscot 0 Piscataquis a 15% 5 Sagadahoc C 10% *Somerset g y Waldo 5% - Washington 0% +York 0% 1% 2% 3% 4% 5% 6% 7% 8% 9% 10% 1996 Unemployment RateSource: Author's calculations from Maine Economic Development Incentive Report data This does not necessarily mean that investment was concentrated in these counties.
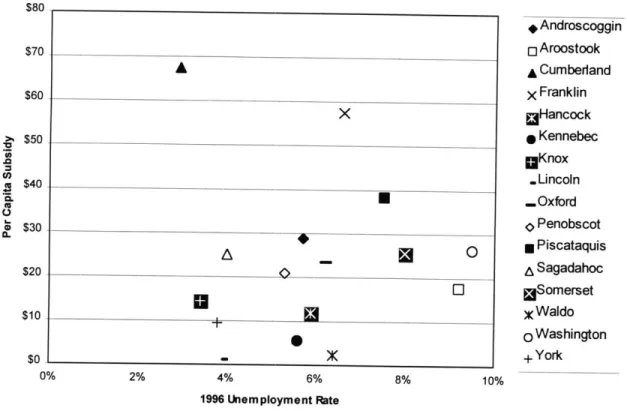
Including all subsidized firms, there does not seem to be a relationship between economic distress (measured by unemployment) and the level of investment directed to firms in the county. In this case, total subsidies were adjusted to reflect the population density of the county, as more populous areas could be expected to have greater concentrations of economic activity.
Figure 6: Distribution by County of Development Incentive Spending $80 # Androscoggin $70 0Aroostook A A Cumberiand $60 X Franklin X Hancock $50 Kennebec aKnox $40 .Lincoln a $40 - .. Oxford 3 0 Penobscot (. 0 *Piscataquis $20 Sagadahoc 0 gSomerset $10 )KWaldo 0 Washington $0 + York 0% 2% 4% 6% 8% 10% 1996 Unemployment Rate
Source: Author's calculations from Maine Economic Development Incentive Report data
Generally, the southern coastal counties, York, Cumberland, Sagadahoc, Lincoln, Knox, Waldo, and Hancock, tend to have low unemployment. Here they range from 3% to 6%. The "rim" counties, Oxford, Franklin, Somerset, Piscataquis, Aroostook, and
Washington, tend to have higher unemployment, from 6% to 10%, with the centrally located counties of Androscoggin, Kennebec, and Penobscot falling in the middle. The figure above shows per-capita expenditure on business incentives for all of Maine's counties. Even though the southern counties had low unemployment rates, just as much expenditure on business subsidies was concentrated there as in the northern counties, some of which have very high rates of unemployment. The major outlier is Cumberand County, where National Semiconductor is located.
While investment in businesses does not seem to be concentrated in the remote counties,
outside the southern counties. Per-job costs were $2,849 in these more prosperous counties, and $2,256 in the rest of the state.
There are reasons for concentrating development in Maine's more urban areas (the coast and south), and reasons for spreading development around the state. Rural areas have lower per capita income and higher rates of unemployment, so may be logical targets for development. However, Maine's wilderness and agricultural land can be considered a valuable asset that needs preservation, and encouraging development in remote areas can be expensive. State Economist Laurie Lachance estimates that expansion into rural and
suburban areas is costing taxpayers $50-75 million per year in "redundant" infrastructure
61
and services
Which Industries Maine supported
Growing or Declining Industries?
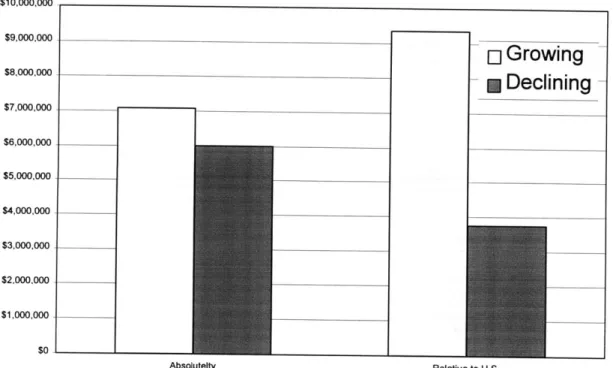
Figure 7: Incentive Spending on Growing and Declining Industries
$10,000,000 $9,000,000 $9.","
E]Growing
-$8,000,000 Declining -$7,000,000 $6,000,000 $5,000,000 $4,000,000 $3,000,000 $2,000,000 $1,000,000 $0Absolutelty Relative to U.S.