A Consumption-Based Accessibility Index of
Transportation and Land Use
by
Michael Scott Ramming
B.S., Civil Engineering
Washington University in St. Louis, 1991
Submitted to the Department of Civil and Environmental Engineering in Partial Fulfillment of the Requirements for the Degree of
Master of Science in Transportation
at the
Massachusetts Institute of Technology
February 1994
© Massachusetts Institute of Technology 1994
Alt rights re.erd
.
Signature of Author , . .- -- --
X
Department of Civil an Enviro~ ntal Engineering
%~_ 5 November 1993
Certified by
.--David H. Bernstein Assistant Professor, Department of Civil and Environmental Engineering Thesis Supervisor
Accepted
by
p
'-
-
-i-.--.
-.
Joseph M. Sussman Chairman, Departmental Committee on Graduate Studies
WA
1 1994;kwscraPr * A ll' I'd
A Consumption-Based Accessibility Index of
Transportation and Land Use
by
Michael Scott Ramming
Submitted to the Department of Civil and Environmental Engineering on 5 November 1993 in Partial Fulfillment of the Requirements for the Degree of
Master of Science in Transportation
Abstract
Accessibility is examined from the economic viewpoint of consumer surplus net of travel disutility. The theory for an accessibility index is derived from discrete choice theory and refined so that conventional data sources, such as the U.S. Decennial Census, may be used to estimate the parameters of such an index. An attempt is made to apply the accessibility methodology to data from the Boston metropolitan area to allow comparisons of possible transportation or land use-related government expenditures. The mode choice submodel reveals that the region's residents are particularly sensitive to out-of-vehicle travel disutility. Unfortunately, however, housing values alone are insufficient to provide statistically significant estimates of determinants of accessibility.
Thesis Supervisor: David H. Bernstein Title: Assistant Professor,
Department of Civil and Environmental Engineering
Page 5
Acknowledgments
Many people have contributed to this thesis and thanks are due ...David Bernstein for being interested in the relations between transportation and land use, agreeing to supervise this research effort, and having faith in my abilities to conduct this project in a timely, rigorous manner, even when I doubted those abilities;
Tom Piper for helping me see the grand scheme in the midst of my equations, and for his help in obtaining data from CTPS;
Val Southern, Arnie Soolman, Yong Chang, Mark Scannell, B. J. Mahal, and Steven Falbel at CTPS for providing travel data, and Kurt Schumann at the Central Massachusetts RPC for answering questions after normal business hours;
the sponsors of the Boston Globe Livable Region Conference, which funded this research, and then-Secretary of Transportation (last September, when this project was just forming) Richard Taylor for having the courage to support our attempt to improve the means by which people look at transportation systems;
Fred Salvucci and James "Kibo" Parry for continuing to remind me of the true reason behind transportation, and for sharing many great stories;
Ruth Bonsignore, Dan Turk, Lisa Cole, Anne Kinsella, Tilly Chang, Bill Cowart, Dinesh Gopinath, Milly Polydoropoulou, Oki Hatsgai, other members of the Livable Region Conference team, and classmates who have shared data and insights with me;
Bill Twomey of TAMS, Nagi, and Geoff Lauprdte for their interest in my work and their desire to continue examining accessibility;
Moshe Ben-Akiva for discussions about the derivation and statistical properties of my model;
Jerry Rothenberg for discussions about the many complexities of modeling reality;
my friends and colleagues from the East-West Gateway Coordinating Council in St. Louis for giving me an introduction to the urban transportation planning process;
Charles River Associates for their support and patience in waiting for the results of this thesis, and Mark Hickman for the glowing recommendation which got me a job at CRA in the first place;
roommates Dongsu, Denis, Harrison, and Nick who put up with my unusual sleep schedule; sun, jpkirby, queef, tegeler, jjgraham, gagne, elabenur, eddietwo, danw, mdtanner, dalbader, and everyone else on Athena who put up with my silliness; Mom and Dad for
supporting and believing in me, even when it would be weeks between calls home;
and of course caffeine in all its wonderful forms, including Necco Sky Bars, Constant Comment Tea, chocolate covered espresso beans, and Folgers Coffee Singles.
A Consumption-Based Accessibility Index ...
Contents
Abstract. Acknowledgments . . . . Contents . . . . List of Tables . . . . List of Figures . . . .1. Introduction and Summary .
1.1. The need to measure accessibility 1.2. Problem statement .
1.3. Outline of this thesis.
2. Review of Theoretical and Empirical Research 2.1. Sociological and behavioral framework . 2.2. Measures of accessibility and travel impedance 2.3. Hedonic price estimation of product attributes. 2.4. Residence and commercial location models.
2.5. Empirical results suggesting the importance of accessibility 3. Theoretical and Analytical Issues.
3.1. Actual or potential travel . 3.2. Appropriate level of aggregation.
3.2.1. Decision-making units. 3.2.2. Decision time frames. 3.3. Data limitations.
3.3.1. Variety within population
3.3.2. "Horizontalness" of geographic information . 3.3.3. Desire for detailed economic variables
3.4. Capacity of the transportation network. 3.4.1. The household's perspective 3.4.2. The business's viewpoint 3.5. Affect of improved accessibility.
3.5.1. Income effect: more travel, greater opportunities 3.5.2. Substitution effect: competing neighborhoods
3 5 6 9 9 10 10 13 15 16 16 21 24 26 28 31 31 33 34 35 36 36 47 47 38 38 39 40 40 . . 41 Page 6
Page 7
3.6. Extrapolation to the intercity level .. 41
3.6.1. Cross-city comparisons .. 41
3.6.2. Accessibility to productive resources . .. 42
4. Model Development . 43
4.1. Simplifying assumptions .. 44
4.1.1. Additive utility of attributes .. 44
4.1.2. Trip chaining .. 44
4.1.3. Hedonic utility values consistent
between short and long runs .
.
..
45
4.1.4. Joint distributions of stochastic disturbances .. 45
4.2. System specification .. 46
4.3. Accessibility model .. 50
4.3.1. Components of accessibility. .50
4.3.2. Destination utility model . . .. 52
4.3.3. Travel disutility model for multiple modes . . . . 52 4.3.4. Correction for using aggregate destination data . 56 4.3.5. Aggregation of accessibility over all destinations 60
4.4. Residence choice models . . . .. 62
4.4.1. Apartment rent model .. 65
4.4.2. Housing purchase model .. 69
4.4.3. Other housing modeling issues. 71
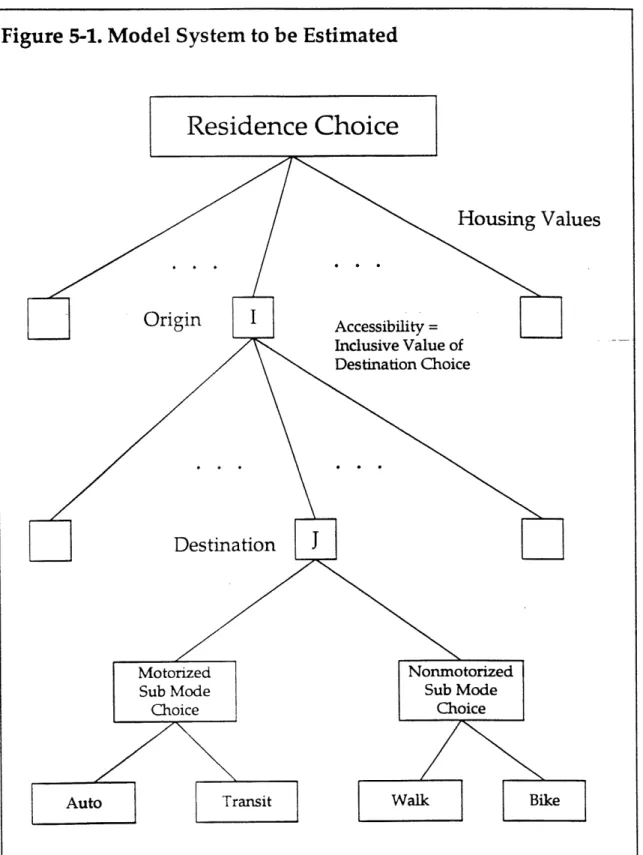
5. Analysis and Estimation.
5.1. Description of data and sources 5.2. System to be estimated.
5.2.1. Motorized sub mode choice model. 5.2.2. Nonmotorized sub mode choice model 5.2.3. Rental model.
5.2.4. Housing purchase model
5.3. Results . . . .
5.3.1. Motorized sub mode choice model. 5.3.2. Rental model .
5.3.3. Housing purchase model
5.4. Sensitivity to inputs and assumptions
73 73 74 81 84 85 88 . . . .. . . ... 89 89 93 94 98 -·*'-I-"--·I--'"MiCll)r*BB3·BI-
-Page 8 A Consumption-Based Accessibility Index ...
6. Policy Implications and Conclusions
6.1. Improving the understanding of accessibility 6.2. Accessibility in other transportation models References Consulted.
Appendix A. Calculating Intra-District Nonmotorized Distances. Appendix B. Model Extension for Transit Mode-of-Arrival . Appendix C. SAS® Code to Estimate Accessibility Parameters Colophon. 102 102 104 108 . 115 . . 118 120 124
Page 9
List of Tables
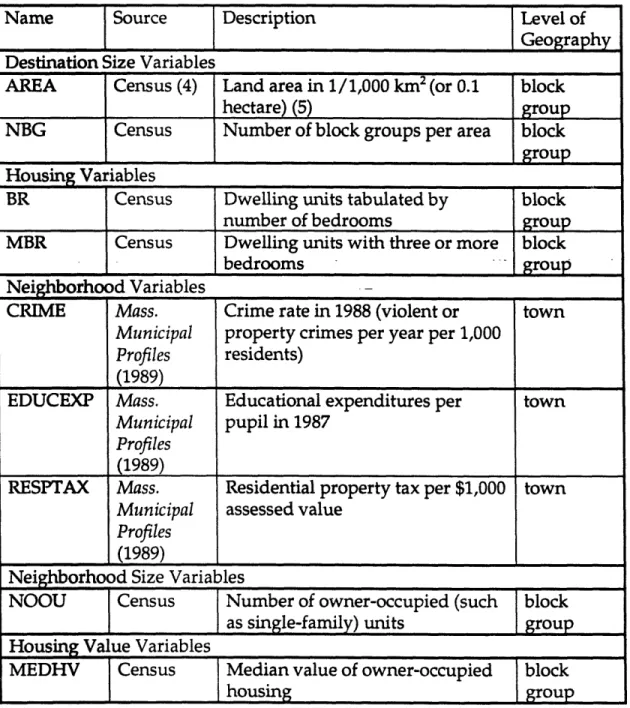
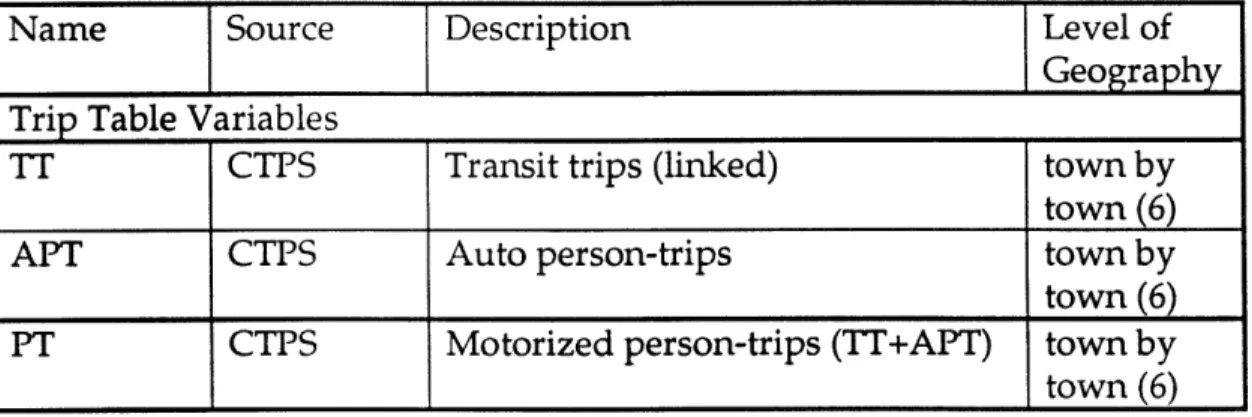
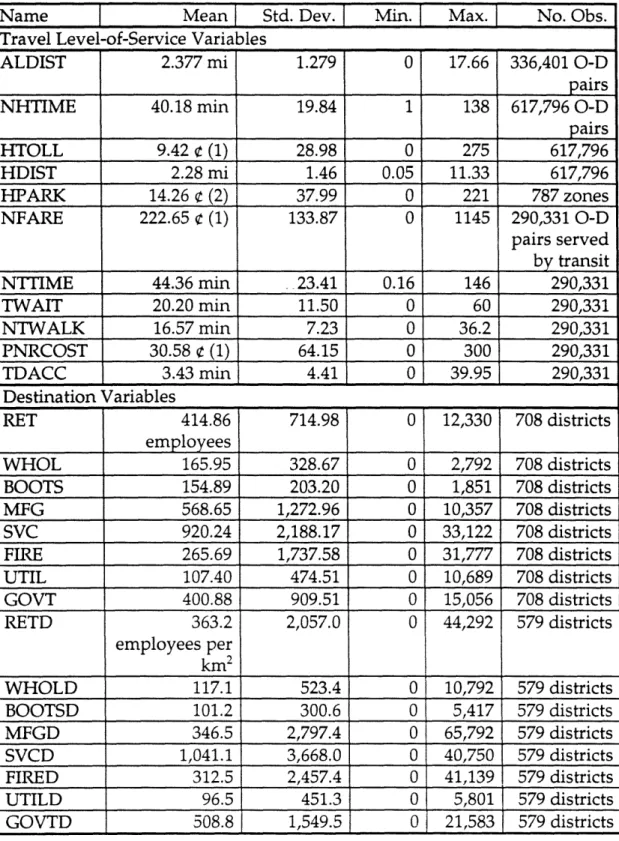
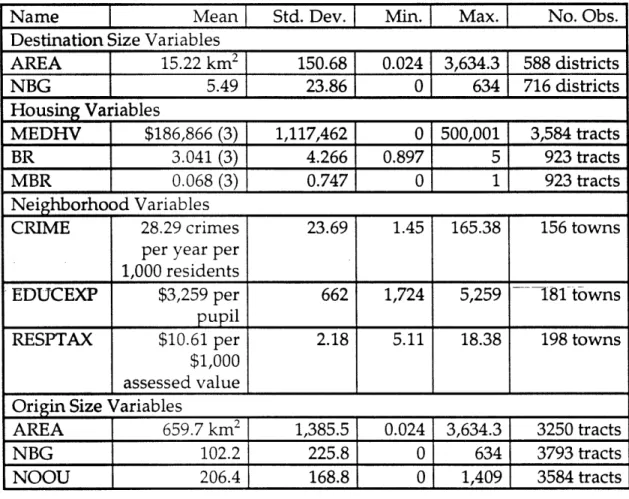
List of Variables ...Summary Statistics . . . .
Estimated Motorized Mode Choice Model Estimated Housing Purchase Model .
Housing Purchase Model without Accessibility
. · * 75 79 * . . . 90 . . . . 95 . . . . 99
List of Figures
Figure 4-1. Model System Schematic . . . .
Figure 4-2. Comparison of Max and Logsum Operators Figure 5-1. Model System for Estimation.
Figure A-1. Distances within a Prototypical District
Table 5-1. Table 5-2. Table 5-3. Table 5-4. Table 5-5. . . . .. 47 . . . ...55 .82 . . . ...116 la.'wrUV"PII1FCYc·asamu*aor-l--
---Page 10
Chapter 1
Introduction and Summary
Many transportation projects list improving mobility as one of their goals: moving people faster, or moving more people, or both. Such criteria are easy to meet, as transportation professionals generally have an excellent understanding of vehicle capacities and flows. However, transportation planners and citizens alike have called for less attention on mobility--merely being able to move from place to place - and more attention on
accessibility, which incorporates some notion of the benefits of what can be reached. Indeed, such an approach is justified any time, but is even more necessary during times of constricting resources.
1.1. The Need to Measure Accessibility
Accessibility is an important analysis and evaluation measure because it puts people's wants and desires as the paramount concern. An accessibility measure would help both politicians and transportation planners, since it looks at transportation as an investment which enables
improvements in urban residents' quality of life. Accessibility can also be used to examine the effects of other "enabling" expenditures, such as development incentives, education reform, or crime-fighting programs.
Introduction and Summary
This approach is in sharp contrast to traditional transportation planning measures, such as what road segments are over capacity or severely congested; or how many people ride a certain transit line Accessibility has the advantage of considering the transportation and land use systems together. In other words, a change to either system affects accessibility. Thus while traditional measures often lead planners to think exclusively about transportation improvements, accessibility should lead them to think about both. In short, instead of focusing on transportation characteristics such as level-of-service, accessibility focuses on the impacts on residents' life processes (that is, all activities important to urban dwellers, such as their jobs, their consumption of goods and services, and their ability to get sufficient health care and education).
We know that it is important not to consider travel solely in terms of mobility, or travel for travel's sake, since reactive "sizing" (e.g. widening a road just because it's overused now) completely neglects the effect that changes to the transportation network have on other systems such as land use. Transportation systems that try to serve demand retroactively are obsolete before they are built. Instead, we need to consider the decisions that motivate the travel: people need the ability to go places in order to buy the necessities of survival, and usually have income left over which
they spend at other places to make life more enjoyable. The accessibility measure developed here has a behavioral and microeconomic framework that makes it more robust than traditional measures, which often use
-·~~~"II~~l~~b~~(Bg~~ Dl~~~~l 0lirXI~~~~ s Le~~ ~ s~~ilbl+ ~
A Consumption-Based Accessibility Index ...
arbitrary functions based on the sole consideration that those functions "fit" past travel best.
Perhaps the easiest way to understand the importance of an accessibility measure is with some examples. In a city with low accessibility, certain types of stores may have "geographic monopolies" since there are so few of these stores and the stores are hard to get to. But by improving accessibility (by improving transportation, or by reducing barriers to entry such as the ability to get large loans), the market will be made "contestable" - that is, it may appear at first glance to be a geographic monopoly, but stores aren't able to charge monopoly prices because either consumers would travel farther to other stores, or new stores would enter the market. Another benefit of geographic competition is that it will lead to better quality products being produced and a greater number of options available to citizens.
Another use of this accessibility measure is for examining how urban residents might like a certain activity to be distributed throughout the city. A policy-maker may be interested in providing low income housing. The analyst might determine that low income persons place a high priority on access to blue-collar and service jobs, supermarkets, fast-food restaurants, discount and hardware stores, quality public education, sports arenas, and places of worship, while placing lower priorities on access to sit-down restaurants, theaters, and department stores. Then the analyst could construct an accessibility index that reflects where low income people
Introduction and Summary
would like to live. Information is readily available on where different socioeconomic groups do live and where vacant land or buildings are available. -The analyst would "match up" the desire for low income housing with areas of opportunity, and therefore recommend where the creation of "enterprise zones" for development incentives might be most effective.
1.2. Problem Statement
In order to receive the full planning benefits of an accessibility measure, we need to carefully consider what aspects of life such a measure should reflect. An accessibility measure should deal explicitly with the fact that different people have different preferences. Different preferences are important for several reasons. Certainly the world would be a much more boring place if everyone was identical. But more importantly, differences are good because they allow people to get the most enjoyment out of what they like most, without getting in other people's way. Such "Jack Sprat" outcomes occur in many policy questions. The "rebuttable presumption" of the Boston Transportation Planning Review (BTPR) is one such situation: core-oriented growth is good for all since the core can easily be made accessible to both those who prefer the open spaces of the suburbs
and those who enjoy the activity of the center city.
An accessibility measure should also address the microeconomic notion of scarcity. Because of constraints on time and money, travelers don't make
:'~P i~~i( D~61~s~"" ~I~ `~
A Consumption-Based Accessibility Index ...
all the trips they could or even would like to make. Traditional measures are concerned only with trips actually made and ignore trips that people might like to make but haven't been able to. However, improvements to transportation affect not only existing trips, but also allow new trips to occur. Accessibility's "potential" travel definition helps us understand "latent demand" better, since accessibility reflects the whole travel demand curve instead of just one point on that curve. Considering potential travel is important because unchosen options do have value to people. Accessibility can look at the different types of preferences that urban residents have, and how the choices made by those people will change when their options change (from a certain type of shop opening or closing in such and such a location, for example).
Finally, an accessibility measure should be able to incorporate traditional comparisons of transportation projects with other important government expenditures and influences on travel behavior. Perhaps the most important motivation of travel is the spatial distribution of activities throughout a city or region. Equally important are taste differences among citizens who consume transportation services, housing, and countless other goods. The challenge, then, is to develop a model of accessibility which can take into account the complexities of human behavior, but yet is simple enough to be able to be estimated and applied using readily available data and computational equipment.
Introduction and Summary
1.3. Outline of This Thesis
This study will begin by examining basic microeconomic and discrete choice theory and developing a specification flexible enough that planning biases need not be introduced for the sake of model simplicity. Then for specified purposes, -the model can be reduced to allow more direct estimation and application, at the expense of not being able to examine as wide of a range of planning options.
Chapter 2 examines current literature on accessibility as it relates to performance of transportation networks and residence choice decisions. This chapter also reviews the econometric theory relevant to the approach of this thesis. Chapter 3 discusses some issues involved with developing a useful, operational measure of accessibility. Chapter 4 outlines the theoretical model, and chapter 5 describes the results of estimating such a model for the Boston region. Chapter 6 examines the implications of model results and offers some general policy suggestions.
4 4 - -
Page 16
Chapter 2
Review of Theoretical and Empirical Research
This research attempts to review the methods used by several fields in order to better understand how transportation and land use systems interrelate. Sociologists and behavioral scientists concentrate on the activities people would prefer to participate in; the distribution in time and space of those activities; and how that distribution, along with other perceptions of the activities, motivates people's actions. More traditional transportation planners tend to have a supply focus: they calculate travel times and costs, and measure land uses in terms of square footage and persons employed. Economists assume individuals act rationally, and therefore examine how these decision makers trade off attributes of various products to maximize their objectives. Each of these approaches is examined below. Next, the work of other researchers to combine each of these approaches into transportation and location choice models is examined. Finally, results of some empirical work suggesting the significance of accessibility is presented.
2.1. Sociological and Behavioral Framework
Urban passenger transportation is a result of people's behavior patterns. Thus, to understand accessibility, it is necessary to examine the spatial areas within which an urban dweller conducts various activities, the motivations
Review of Theoretical and Empirical Research
between the supply and demand for these activities, and the allocation of time among activities. There are several approaches to this problem:
Barrett (1974) develops a behavioral approach to residence choice based on the concepts of action space, awareness space, place utility, search behavior, and vacancy set:
The 'action space' consists of the points and paths that the individual uses in his normal space patterns for a given period of time. ... In fact, the 'knowledge' of these actual places is filtered through personal, cultural, social and economic screens so that in reality the 'action space' is a perceived space. Therefore the term 'awareness space' appears to be a more appropriate term .... 'Place utility' is the degree of differentiation between the satisfaction of a person's present location and the perceived advantages of moving to another location (Barrett cites Wolpert, 1965). ... A fourth factor, 'search behavior' is the action taken on the part of the potential mover to acquaint himself with possible alternative locations. ... Since persons can only move into available places, the type of places and where they are located is spatially significant. Thus the term 'vacancy set' fluctuates (over time) in both size and
location ....
The concepts of awareness space and place utility will be useful in developing a measure of accessibility in terms of the consumption possibilities associated with a location.
Chapin (1974) considers the aggregate supply and demand for activities and the hierarchical relationship of people to groups such as families, cliques, gangs, firms, governments, religions, and ethnicities. In Chapin's framework,
Ichow s -'-IY1~~·~3~·11~·
A Consumption-Based Accessibility Index ...
the demand for, or propensity to engage in, activities is dependent on
"motivations and thoughtways predisposing action" and "roles and person
characteristics preconditioning action." The supply of, or opportunity to engage in, activities is modeled as being dependent on the perceived availability of facilities or services, and the perceived quality of those facilities or services. Brand (1990) proposes a similar model where individual behavior is based on needs, resources, and information on opportunities. The resulting individual decisions are observed in aggregate travel and land use patterns.Most of the research on this subject focuses on the amount of time that households allocate to general activities, but how this allocation process relates to transportation is still the subject of ongoing research. For example Hammer & Chapin (1972) examine the use of leisure time in Washington, D.C., but ignore the separation in locations of these activities. Ettema, Borgers, and Timmermans (1993) examine how constraints on activities affect the scheduling of activities (for example, a shopper may need to go to the bank in order to have sufficient cash for grocery shopping, and then return home quickly before frozen foods defrost), which in turn influences trip chaining and travel patterns within the day. Kunert (1993) argues that households have weekly cycles of trip-making behavior, and that one day time-allocation or travel surveys do not obtain sufficient information about trip generation rates.
Review of Theoretical and Empirical Research
We will examine how economic actors (individuals or households, and firms) allocate time and money resources to maximize consumption or profit, and how this allocation is affected (and in turn affects) the transportation network and land use patterns of a city. To illustrate, consider individuals attempting to maximize their satisfaction from consumption not only by choosing which products to buy, but where to buy these products. The choice of where to buy
products depends both on the difficulties presented by the transportation
network in reaching that place, and the opportunities available at the final destination. The next two sections explore how each component of this choice- components which we will call "travel disutility" and place utility - may be quantified in a meaningful manner.
Before examining measures of accessibility though, it useful to discuss what such a measure should attempt to incorporate. In some reports, the terms
accessibility and mobility are used interchangeably to refer to the degree of
separation of various human activities (ex. Morris, Dumble and Wigan, 1979). As an example of what is meant by activities, Hunt et. al. (1984) define accessibility in terms of the distance to and frequency of transit service, in order to examine the equity of service provision in northern New Jersey across income groups. Linneker and Spence (1992) approach accessibility from the viewpoint of manufacturers who rely on vans to deliver their products to market, and examine the changes in accessibility from the construction of a circumferential freeway around London.
jE;ppcXY"·-·`\"-m"""
A Consumption-Based Accessibility Index ...
In related literature, mobility is used to indicate a change in residence (ex. Butler et. al., 1969, and Simmons, 1968). Also, accessibility is sometimes used in the transportation field to refer to the lack of physical constraints on certain groups, particularly the disabled and elderly, which would otherwise make travel by a specified mode difficult or impossible. (An example of this use occurs in the Americans with Disabilities Act of 1990.)
Morris, Dumble and Wigan (1979) offer this distinction between mobility and
accessibility:
... personal mobility is interpreted to mean the ability of individuals to move from place to place: this depends principally upon the availability of different moves of transportation, including walking.
.... On one hand accessibility may be interpreted as a property of individuals and space which is independent of actual trip making and which measures the potential or opportunity to travel to selected activities. Alternately, it may be held that "proof of access" lies in the use of services and participation in activities, not simply in the presence of opportunities.
This study will adopt the convention that mobility refers to the physical and technological constraints on the choices of travel modes available. Accessibility will refer to the set of activities to which a person has the
potential
to travel, even if such a trip is not made. This assumes that people view an unused opportunity as better than (or at least as good as) noopportunity. However, discussion of how opportunities are valued will be
deferred until a later section.Review of Theoretical and Empirical Research
2.2. Measures of Accessibility and Travel Impedance
The simplest measure of accessibility is merely the distance or time separating two activities. However, even this simple concept can quickly become complex. For example, distances may be calculated as straight-line, network, or "block" distances. Barrett (1973) defines block distance, a proxy for network distance, as "the right angle distance of an equilateral triangle." Although the meaning of this definition is not completely clear, we can assume that block distance is straight-line distance times some factor, which would otherwise appear within the estimated parameter on straight-line distance. Different components of travel time (such as access time v. in-vehicle-time) are often weighted to reflect the relative comfort of each. Distance and time may be combined with other aspects of travel, such as cost or preference for a given mode, to develop a composite value called "generalized cost." If this composite value is expressed in time units rather than monetary units, it is generally called "impedance." The value may also be normalized for use in probabilistic discrete choice models, in which case it is generally called "disutility" and expressed in units called "utils" or simply
"utility units."
Ingram (1971) refers to accessibility measures which reflect the separation between only two activities as "relative accessibility." The corresponding concept - the separation between one point and all others in a region - is called "integral accessibility." Relative accessibility is a useful concept only
;UW;REZrOlZIILIl--·1P·IJmau·arWL
A Consumption-Based Accessibility Index ...
when considering an activity which is highly centralized (such as a City Hall); or which is carried out in homogenous facilities (an example might be post offices which offer the same services), and therefore only the nearest one is relevant. However, virtually all privately-operated activities and many public sector activities take place in several locations and have varying levels of quality and- types of products offered.
One way to use measures of relative accessibility to examine accessibility within a region is to construct "isochrones" which bound all the opportunities available within a certain travel time (or generalized cost) budget. The total number of opportunities within a given budget band can be expressed as
Accessibilityi= Aj N
where Aj = some measure of the opportunities at destination j (opportunity measures will be discussed later), Sij = 1 if tij < tN' and
0
otherwise, and tN* = atravel time budget for isochrone band N (an example is multiples of 10 minutes of impedance).
Ideally, one would want to construct one isochrone which corresponds to the relevant travel budget for a given person. However, travel budgets likely vary among individuals and it is difficult to collect sufficient information, so typically, isochrones are constructed for a series of travel budget bands, Page 22
Review of Theoretical and Empirical Research
resulting in much more data complexity. Several numbers are necessary to express the integral accessibility of an area whereas we would like to use a single index. (For an illustration of the isochrone approach, see the examination of accessibility within Toronto by Dewees, 1978)
Lerman (1975) reduces the data complexity of the isochrone approach by using the expected value of travel time (disutility, etc.) as a measure of
accessibility:
j
Acci tijPij (tij,A, ,Zi)
where Acci = the expected value of the travel disutility of a trip made from
origin i, Z = a vector of socioeconomic characteristics of trip maker at origin i, and Pij(*) = the probability that a resident of origin i will make a trip to destination j. The function Pij() is usually from a discrete choice model and can incorporate socioeconomic variables to reflect the relevance of opportunities to various trip makers. However, Lerman's model considers only travel time disutility, that is Pij(tii,A,Z) = Pii(tij). Also, one would prefer a measure of the opportunities, rather than the time to reach these opportunities, as a means of describing accessibility, so that accessibility would be directly proportional to the attractiveness of an area.
A Consumption-Based Accessibility Index ...
Another measure of accessibility, proposed by Hansen (1959), is based on declining attractiveness as activities become more distant:
Accessibilityi = Af(to ),
where Aj = a measure of the opportunities at destination j, typically area, population or jobs, tij = travel time and cost between origin i and destination
j, and f(tij) = a decreasing function in tij, such as 1/(a+tijO) or exp(-y ti). One of
the difficulties with this approach is that the parameters a, 1, and y have little theoretical meaning. Often an arbitrary form of f(o) is chosen so that when accessibility measures are incorporated into trip generation rates, a gravity trip distribution model emerges. (see Morris, Dumble and Wigan's review, 1979, of Niedercom and Bechdolt, 1969) Also, this formulation make no adjustment for the socioeconomic relevance of the opportunities at each destination.
2.3. Hedonic Price Estimation of Product Attributes
Instead of the approaches above, we will examine how the attractiveness of a destination might be expressed in similar units as travel times and costs. Borrowing utility theory from economists provides a means to make these comparisons. Economists often view heterogeneous products as an inseparable package of varying quantities of homogenous "attributes."
(Examples of attributes are blueness, sweetness, and absence of impurities.)
Review of Theoretical and Empirical Research
By recording customers' willingness to purchase related products, and measuring the attributes inherent in those products, the values that customers place on those attributes can be inferred. This procedure is known as hedonic price estimation. Ting (1971) gives guidelines for when an additive utility function is appropriate (that is, when preference for attributes are independent), and provides mathematical tools for manipulating choices among multiattributed products. Wallace and Sherret (1973) show how the value of qualitative attributes may be quantified by using surveys where respondents are asked to rank their satisfaction with the attributes of a product. Wallace and Sherret also argue that the demand and supply functions of a multiattributed product must be considered simultaneously in order to correctly identify the demand for individual attributes. Moorthy (1991) warns that the design of such a survey bias the estimated hedonic price of the product's attributes.
Within the urban transportation demand framework, we consider locations as a composite product of consumption goods which can be purchased there and of public goods, such as ambiance, noise, or crime, which are not consumed but remain as a characteristic of the area.
Butler (1977) uses hedonic prices to explain prices of rental and owner-occupied housing units within a metropolitan area and across 36 cities in the U.S. Unlike Wallace and Sherret, Butler argues that the hedonic price pertains only to demand and supply factors together. Therefore, including buyer (or seller) characteristics into the hedonic regression will introduce
A Consumption-Based Accessibility Index ...
simultaneous equation bias. Butler also examines the bias introduced by using only variables readily available from the census, rather than all applicable housing attributes, and concludes that the explanatory power of such a hedonic model is little affected by the omission of non-census variables. This result suggests cause for optimism that census data may be sufficient to examine the influence of accessibility on transportation and land use patters.
2.4. Residence and Commercial Location Models
Although accessibility has a large influence on people's behavior, it is not directly measurable in the same way that say the travel time between two points by a given mode can be measured. Instead, we must look at the outcomes of decisions known to be influenced by accessibility. For this project, we will examine how accessibility affects housing values as a means of estimating a useful accessibility measure. Economists such as Alonso (1964) and Wingo (1961) model interactions of the transportation and land use markets with other, more traditional markets. Alonso theorizes that different land uses (industries and residences of varying density) trade off purchases of accessibility to the CBD, land area, and a composite good. The land use which offers the greatest "bid rent" end up with control of a parcel of land, which explains why retail establishments and industries are located in the city centers, while residences prefer outlying areas. Wingo examines the labor market from the perspective that households trade off higher rents near the commercial center city with longer commutes from the suburbs.
Review of Theoretical and Empirical Research
"Economic rent theory" such as used by Alonso and Wingo often assume a city located on a flat, featureless plane which results in circular bands of different land use patterns. Experience shows that neither the assumption nor result is descriptive of real cities.
Two early- models which relate transportation to land use are the EMPIRIC and DRAM models. The EMPIRIC model (see Brand, Barber and Jacobs,
1967) examines changes in sub regional shares of residential and industrial activities (households and jobs) in terms of the existing levels of those activities, the propensity and capacity of an area to attract certain types of development, the level of utilities service, and automobile and transit accessibility. Both models (this discussion follows one in Dickey, 1983) use a Hansen-type (exponential gravity) accessibility measure. In the DRAM model, attractiveness is assumed to be estimable from a multivariate regression on areas of current land uses and the distribution of residents' income within quartiles.
Lerman (1975) formulates residential choice as a joint selection from a discrete set of residence, auto ownership, and mode to work choices. Accessibility is expressed as the reciprocal of expected generalized travel cost to shopping for separate transit and auto modes. Location and travel-related decisions are modeled by a generalized extreme value formulation where utility is derived from accessibility and other variables.
jlBRDILZ·X·r-aU··raa-rulll·-rr---
A Consumption-Based Accessibility Index ...
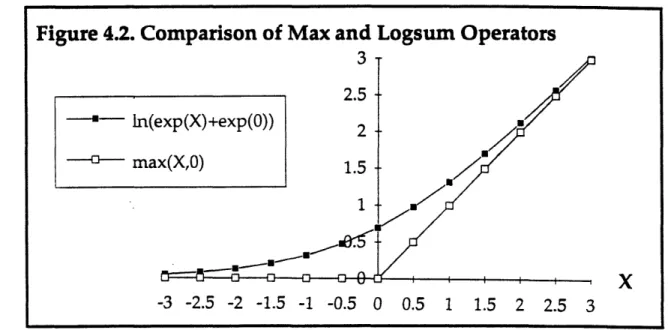
Similarly, Weisbrod (1978) models residential choice as a joint decision with auto ownership, neighborhood, tenure type, and physical structure (ex. a semidetached -unit) in a generalized extreme value formulation. Weisbrod also expresses accessibility in terms of expected generalized travel cost, but combines the measure over all modes by using the expected least generalized cost among all modes. (Ben-Akiva and Lerman (1985) show that when the stochastic disturbances of all modes' utilities are independent, the combined expected value reduces to the "logsum" of the modes' systematic utilities. This method will be discussed in more detail in chapter 4.)
Anas (1985) approaches the residential choice problem from an optimization standpoint by examining the simultaneous equilibria of transportation network congestion and the housing market. Since land owners attempt to minimize their generalized travel costs while maximizing their benefit from housing occupancy, accessibility is implicitly considered. Anas considers the case where only one mode, auto, is available, but his framework can be expanded to include multiple modes.
2.5. Empirical Results Suggesting the Importance of Accessibility
Researchers using models such as those described above and "Push-Pull" models of residence choice have found that accessibility is one of several important factors home buyers and renters consider. Butler et. al. (1969) examine opinions of householders who had contemplated changing or had recently changed residence to determine what factors (such as change in
Review of Theoretical and Empirical Research
family composition, change in income, or current housing falling into disrepair) influence people's decision to move. They conclude that the head of the household's place of employment is the most important activity that households seek to become closer to by moving. Accessibility to shopping centers, parks and playgrounds, and friends was also noted to be statistically significant in influencing the decision to move.
Barrett (1973) examines various aspects of the search and evaluation process that 380 households in the Toronto area encountered while finding a new house. Although Barrett notes that the sample average distance (when measured by straight-line and block distances) to both the primary and secondary work locations for the households decreased after moving, he is unable conclude if this occurred in general for individual households. A survey asked the recent movers what reasons influenced their selection of a residence (households were allowed more than one response). While the most common answer was "it was the best value for the money," a vague reply at best, accessibility was mentioned by several households. Fifty-two households (about 13 percent of the sample) said they chose the house for its "convenient location;" 21 households (about five percent) wanted to be "closer to work;" and 11 (about three percent) wanted to be "closer to family." Also, 32 households (about eight percent) cited "amenities of the neighborhood," although the specific nature of these amenities (ex. availability of cable TV or comer drug store) is unclear. This suggests that accessibility measures which incorporate many types of activities in which a
A Consumption-Based Accessibility Index ...
household would participate might have more explanatory power than a measure which relates accessibility to only one type of activity, such as work.
Butler (1977) shows that accessibility in terms of distance to the CBD - a suspect instrument for the true access to opportunities at best - is necessary as an explanatory variable to avoid bias in estimates of hedonic prices in rental markets. He found that the measure was not significant in determining the price of owner-occupied housing. However, a more realistic measure of accessibility might prove significant in explaining location choice in both rental and owner-occupied housing markets.
Page 31
Chapter 3
Theoretical and Analytical Issues
Before we further examine accessibility, and its relation to the transportation and land use systems, it will be useful to further clarify what we hope to measure as "accessibility," and how this choice affects our data needs and calculation methods. Some questions which must be answered include
whether or not accessibility should be determined in part by actual travel
patterns, to what levels we can aggregate individual trip decisions without destroying information from the variation among individuals, what determinants of accessibility are realistically available, and how the limited capacity of the transportation network constrains accessibility. Once we have decided on a reasonable framework for measuring accessibility, we should address how we expect urban dwellers to respond to changes in accessibility. Finally, it may also be useful to ask how accessibility can be used to compare the quality of life in different urban areas, or to explain how cities compete in
a regional and national context.
3.1. Actual or Potential Travel
Morris, Dumble and Wigan (1979) present both viewpoints on the issue of whether accessibility should reflect actual or potential travel. Part of this problem arises from the difficulty that traditional accessibility measures have in summing the attractiveness of various destinations. For example, the
A Consumption-Based Accessibility Index ...
Hansen-type measures based on the gravity model assume that accessibility decays exponentially with travel time if attractiveness is constant. Lerman's model (1975) uses a decay function based on a random utility model which considers only travel time. Calibrating such decay functions would require knowledge about current trip patterns, and might therefore prejudice accessibility measures by giving extra weight to existing travel patterns, and not being responsive to changes in the transportation or land use networks.
The argument for attempting to measure potential travel is based on the premise that choices have value, even if they aren't selected. As an analogy, consider the popularity of "super" grocery markets over locally owned neighborhood grocery stores. Obviously, a customer at a super store doesn't intend to purchase one of each product or brand. Rather, the increased product variety at a super store allows a customer to choose a brand which might yield more satisfaction than those brands available at the comer market. Likewise, that customer would have the opportunity to trade off cost with desirable product attributes, possibly taking advantage of weekly specials. A customer with a choice between two brands is better off than one who has no choice, even if that single "option" is the brand the customer would prefer if he or she had a choice. Similarly, trip makers who have choices of multiple destinations at which to conduct their activities are better off than those with more restricted choices. Proponents of measuring potential travel, including the author, argue that accessibility measures should attempt to reflect the value of these unselected alternatives.
Theoretical and Analytical Issues
By considering travel costs and destination attractiveness together, we can avoid some of the arbitrary criteria used in traditional accessibility measures which are based on either actual travel or potential travel. Travelers don't ask "at what rate do destinations look less attractive?" or "is the destination within X minutes?" but instead "is this particular trip worth it?" In other words, does the utility gained at a destination outweigh the disutility incurred in traveling to that destination? By summing the net utility possible
at all destinations, we have an idea of the accessibility of a given location.
A similar issue is how to address accessibility via different travel modes. Should separate accessibility measures be calculated for each mode, greatly increasing the complexity of the data processing involved? Or if mode-specific accessibility measures are to be combined, should they be weighted by observed mode shares, by mode shares predicted by a behavioral model,
or by some other method? Is there a way to reflect the added flexibility of choosing alternate travel modes without double-counting?
3.2. Appropriate Level of Aggregation
In the most general sense, accessibility measures are an aggregation of potential trips - over destinations, modes, people, and origins. This section has hinted at aggregation over destinations and modes. Aggregation over locations and trip-makers is discussed below.
A Consumption-Based Accessibility Index ...
3.2.1. Decision-making units. Ideally, we would like to consider the accessibility of each decision-maker individually. One obvious constraint to this approach is the sheer computational capacity required to model the behavior of say 4 million people in a metropolitan area, such as Boston. Another complication pointed out by Chapin (1974) is that individuals behave in a hierarchical fashion. For example, a family may make a single decision on where to live, and what types of trips are made by its members. In this instance, the family acts as the decision-making unit, although it considers the wants and needs of its members. Group living arrangements add even more complication. Should two people who met via the classified ads to rent an apartment be considered as two individuals or a single household? College dormitories, sororities, and fraternities, which often have various committees and circles of friends, would have more decision-making levels.
A similar difficulty occurs on the neighborhood level. Although a central neighborhood decision-making organization may not exist, one might expect the travel patterns of members of the same neighborhood to be similar. Transportation planners have traditionally grouped people in to geographical and political "Transportation Analysis Zones," and considered the average individual within each zone. However, there are several drawbacks to this approach. Residents form their own natural association of who and what constitutes their neighborhood, which may be completely unrelated to the lines transportation planners and the Census Bureau find convenient to draw on a map. Furthermore, individuals within a
Theoretical and Analytical Issues
neighborhood are different; not only is it useful to know the average value of a particular characteristic of a neighborhood, but we also want to know the variety of that characteristic throughout the neighborhood. The statistical concept of variance is especially useful with scalar attributes such as income, but harder to formalize with categorical variables such as race.
3.2.2. Decision time frames. The specific definition of an accessibility measure implicitly assumes a time frame within which trip decisions are being made. The more specific a measure, the shorter run decision being considered. If we define "short run" to mean individual trips, a useful accessibility measure would consider the specific purpose of the trip. Clearly, such an objective would change from trip to trip, creating a necessity for a multitude of accessibility indices. Since we are interested in more long run decisions involving the location of residences and firms, using a more general accessibility measure may be a better approach. Such a measure would incorporate all types of trips which an actor is likely to make, and the effect of limited information available when the location decision is made. However, we should realize that not all location decisions (or transportation investment decisions for that matter) are made all at once, so the intermediate run may be the most appropriate, since changes in location may be traded off with greater dedication of resources to transportation. Our choice of time frame will also be influenced by the time frame measured by the data we use to describe accessibility.
A Consumption-Based Accessibility Index ...
3.3. Data Limitations
Because the type and quality of data available affect how closely we can approximate our ideal accessibility measure, it is important to discuss what limitations we are likely to encounter, and the likely result of these limitations. We first examine some traditional biases in the transportation planning field - those of considering only mean values and of looking at a city only in plan view. The we question whether "more is better;" will extensive, detailed geographic information help us better explain location decisions in the context of accessibility?
3.3.1. Variety within population. The traditional four-step transportation planning process conducts analysis by assuming that all individuals in a "zone" are identical, or that little information is lost by considering only the average individual in a zone. The result is forecasts which appear to have a great deal of precision, but deceptively overlook inherent errors. (Four-step model which have errors of ten percent of less are considered "very good," and errors of forty percent are not unheard of.) Certainly some error is unavoidable, because travel surveys and censuses cannot be conducted continuously. However, by considering some measure of variance along with the mean, we may be able to significantly reduce some sources of error. (The mean and variance don't completely characterize the distribution of a variable, but the gain from additional statistics is usually small.) The census and other data sources sometimes report variance or a similar measure of Page 36
Theoretical and Analytical Issues
spread, except when the limited size of an area makes it impossible to preserve individuals' privacy.
3.3.2. "Horizontalness" of geographic information. The widespread use of geographic information systems (GIS) means that some very detailed information (such as street lengths) is available to transportation planners. However, this information is generally limited to a horizontal plane. In cities such as Chicago, mixed-use zoning permits apartments in buildings above stores at ground level. To a person in one of these apartments, the shop on the ground floor isn't as accessible as the TV remote control, even if the horizontal separation of both is zero. A similar phenomenon is office skyscrapers which have services such as banks or cafeterias located in their lobbies or lower floors. On the scale of a metropolitan area, vertical distances are negligible, but issues of development density and mixed-use zoning are often important to urban planners. Also, when horizontal aggregation areas are larger, this problem reduces to simply another part of the heterogeneity problem.
3.3.3. Desire for detailed economic variables. A naive approach to explaining accessibility and its affect on transportation and land use is to collect information about an inordinate number of explanatory variables. Clearly there is a point where. the information gained by adding variables does not justify the expense of data collection. Even if transportation planners could obtain data at minimal cost, it is unrealistic to assume that city residents would also be able to obtain as extensive a database, much less make location
· · 1___1____1_11_1_1·__-__
A Consumption-Based Accessibility Index ...
decisions based on that information. Wallace and Sherret (1973) remind us that objective engineering or financial data are only instruments for the perceptions of actors in a city, and such instruments should be used cautiously.
3.4. Capacity of the Transportation Network
Until now, we have considered only demands placed on the transportation network. In any economic model, including a model of accessibility, supply is as important a factor as demand. For transportation, supply is traditionally expressed in terms of capacity. Capacity constraints may be modeled as part of a simultaneous equilibrium (see Anas, 1985, for an example) or as part of an iterative feedback process. Complications arise because the capacity of a transportation network is not simply the sum or minimum of the capacities of the network's components or links. How capacity affects two classes of actors is examined below.
3.4.1. The household's perspective. Throughout this document, we have largely considered the household's ability to consume. This analysis has considered two important components of consumption: the benefits of activities at locations throughout a city, and the costs associated with traveling to those activities. Capacity therefore affects the transportation costs or disutility. Highway traffic modelers are familiar with congestion (the exhaustion of capacity) causing a degradation of travel times. The response of transit to use is more subtle. Increased ridership affects travel time since Page 38
Theoretical and Analytical Issues
longer dwell times at stops are necessary to allow passengers to board and alight. Perhaps more importantly, ridership directly affects the load factor of a transit vehicle, which impacts passenger perceptions of comfort.
An important consideration arises here. We have defined accessibility in terms of potential travel. Since travel disutility is a function of both capacity and use, we need to know actual travel as well. Predicting future actual travel with sufficient accuracy is indeed difficult. One way around this dilemma may be to check that the level of congestion is consistent with our estimates of accessibility. Another way of expressing this notion in our stochastic framework is to consider a simultaneous equilibrium of the expected values of travel and congestion.
3.4.2. The business's viewpoint. Firms are considered separately because their accessibility objectives are different from those of individuals. Firms "consume" labor as an input, and need to get their products to a market in order to make a profit. Since individuals are both suppliers of labor and purchasers of products, a firm will view its attractiveness (or accessibility to labor or customers) in terms of those individuals' travel disutility, which is affected by capacity. In addition, capacity represents an upper bound on a firm's potential markets.
_ ____
__
A Consumption-Based Accessibility Index ...
3.5. Affect of Improved Accessibility
Knowing the -level of accessibility of a single transportation and land use system is generally only useful for evaluating equity among groups of urban residents. However, a consumption-based accessibility measure holds much more promise to transportation planners - the ability to evaluate different urban investment programs. In order to conduct such an analysis, one must know how travelers respond to increases and decreases in accessibility. It is useful to consider traveler responses in the economic terms of income and substitution effects, which traditionally describe consumers' responses to changes in product prices. Since accessibility incorporates both price and quantity information, this division seems reasonable.
3.5.1. Income effect: more travel, greater opportunities. The income effect can be summarized as a fall in the price of one good allowing increased consumption of all goods. In the case of improved accessibility, fewer resources (time, money and effort) need to be dedicated to a fixed amount of travel, so residents will both travel more (in terms of number, and length or disutility of trips), but they will also participate in a greater amount of activities (that is, they will consume more). This is similar to a result of transportation investment argued by David Aschauer (1989) on a national level: increased transportation investment leads to greater productivity and improved competitiveness.
Theoretical and Analytical Issues
3.5.2. Substitution effect: competing neighborhoods. The substitution effect can sometimes be thought of as working counter to the income effect. When the price of one good falls, consumers will spend a greater proportion of their income on that good, and less on other goods. When access improves, residents may partake of activities in neighborhoods which are most accessible-to them at the expense of other neighborhoods. The substitution effect may lead to subdivisions of a metropolitan area needlessly fighting over geographically limited benefits. Therefore, it is important to know the relative sizes of the substitution and income effects, in order to know if increased accessibility would actually be healthy to a region as a whole.
3.6. Extrapolation to the Intercity Level
Since accessibility is a useful concept for comparing the distribution of transportation and activity within a city, it seems logical to ask if cities can be compared to each other.
3.6.1. Cross-city comparisons. If accessibility indices are easily calculated for neighborhoods within one metropolitan area, with similar information for another metropolitan area, it would seem to be easy to determine if one city is more accessible than another. However, planners must be very careful when attempting to borrow data from other cities. Residents of the two urban
areas may value travel and location attributes differently, which would in fact influence their decision of which city they prefer to live in. If the implied valuation of attributes is estimated for only one metropolitan area, using
A Consumption-Based Accessibility Index ...
those values to calculate accessibility outside of that area would be meaningless. Cross-city comparisons would require data from all cities to be compared and a more careful specification of the valuation of various attributes in order to avoid the self-selection bias.
3.6.2. Accessibility to productive resources. Another use of the accessibility framework is simply to consider economic decision makers at one level up: the relation of cities to each other. Cities don't exist in isolation, but trade with each other. Often, cities specialize in certain industries such as financial markets, electronics technology, or agriculture. Similarly, tourism in different cities are not perfect substitutes. In such a framework, the federal government might evaluate how a high-speed rail network (to use a current example) affects national productivity and competitiveness through cities' improved access to productive resources and goods markets.
Page 43
Chapter 4
Model Development
This model of accessibility takes a microeconomic consumption approach. Throughout this discussion, "consumption" will refer to purchases of every imaginable type of good, service, or opportunity. Some of these purchases might be quite necessary to life, such as buying groceries, health care, and clothing. Other more frivolous or hedonistic purchases, such as recreation or
status goods, may better fit the typical connotation of consumption. We are not interested in making value judgments on the type of goods and services
that people buy, but rather in how people's needs and desires influence their
use of the transportation network and the various establishments within acity.
Since accessibility represents potential travel and consumption, no budget constraints on income or time are imposed. However, we do impose a
"rationality" constraint that no trips are made unless the gains from consumption at the destination offset the difficulty of travel there. The reality of incomplete and imperfect information leads us to adopt a random utility model.
A Consumption-Based Accessibility Index ...
4.1. Simplifying Assumptions
Several assumptions have been made to simplify the analysis that follows. These are discussed below.
4.1.1. Additive utility of attributes. A standard assumption of economic models is a simple additive utility function describing consumers' preferences for goods and services. This leads to the result that as consumers' incomes increase, they purchase a greater quantity of the goods in the same proportion as they did before. Modeling utility in terms of attributes rather than products allows for slightly more realism since the availability of attributes is determined by their mix in products. Also, some of the income effect on consumption patterns will be captured by estimating different accessibility indices for different groups, based on income and other socioeconomic factors. However, in order to fully model satiation, as well as inferior and luxury goods, we would need a polynomial or piece-wise-linear
utility specification. The drawbacks of this latter approach are more parameters to estimate, and polynomial or piece-wise-linear combinations of right-hand-side variables would be highly correlated, causing an efficiency loss in parameter estimates. For each socioeconomic group considered, we model utility as a simple, linear combination of attributes, and neglect satiation.
4.1.2. Trip chaining. In the short run, a traveler might be aware of several needs that would have to be fulfilled within roughly the same time frame.
Model Development
The traveler might then combine several trips to satisfy these needs into a single trip chain or tour. However, since needs vary over time and in frequency, it is not possible to know beforehand what needs may occur simultaneously. We assume that travelers do not consider the possibility of chaining trips in the long run when decisions such as location choice are made.
4.1.3. Hedonic utility values consistent between short and long runs. Since our model is one of land use decisions, we are implicitly modeling a long run response. However, some of the proposed uses of this accessibility index, namely using accessibility as a better instrument than the change in user costs for the social benefits of a transportation program, assume benefits accruing from short run trip decisions. In order for accessibility to be used for this purpose, some stability between the long run and short run should exist.
4.1.4. Joint distributions of stochastic disturbances. Although this assumption is inessential, we assume that the stochastic disturbances or combinations of disturbances of utility components are independent and identically distributed Type 1 Extreme Value random variables in order to utilize nested logit theory. Ben-Akiva and Lerman (1985) provide a concise reference.
The i.i.d. assumption is restrictive for two reasons: (1) the variance of the disturbance is assumed to be constant for each mode - for example, that walking has as much inherent randomness as driving or riding a bus; and (2)
modes such as bicycles, buses, and autos travel on the same roadway, and Page 45
A Consumption-Based Accessibility Index ...
would all experience the same random disturbance related to the functioning of that roadway, so these modes' error terms might not be independent. However, dropping the i.i.d. assumption would require much more complex and computationally intensive estimation procedures, such as multinomial probit, so we retain the assumption for simplicity.
4.2. System Specification
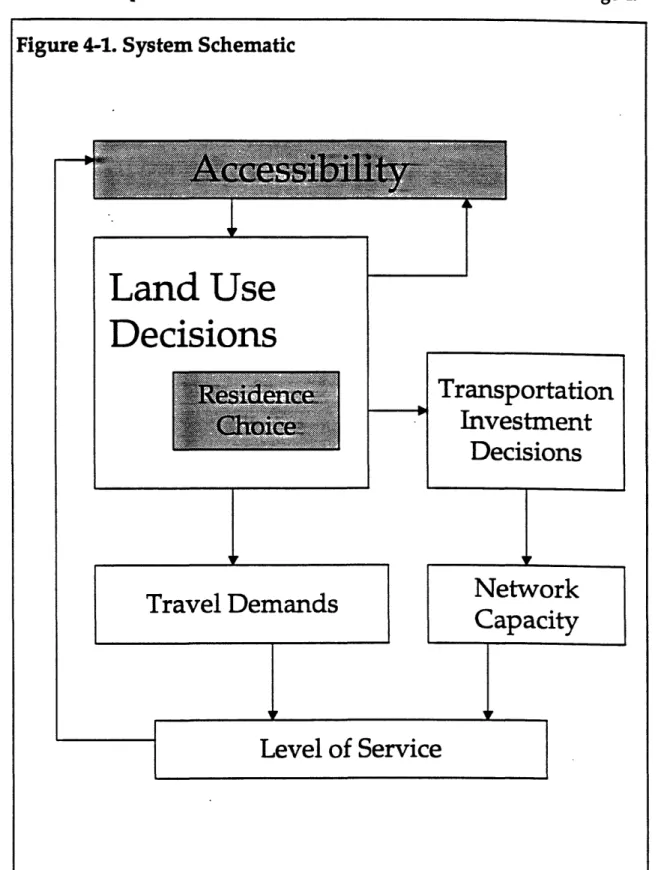
In making long run location decisions, residents and firms consider accessibility along with characteristics of the areas where they might locate. The distribution of activities throughout an urban area affects the day-to-day
and minute-to-minute travel demands. However, over time, a pattern of travel demand should develop. Travel demands are constrained by the capacity of the transportation network, and thus affect the level of service available from the network. Political decision makers will consider both existing land use patterns and the service levels of the transportation network when considering investments that improve the functioning of transportation and other infrastructure. The relations among these decisions and their results are shown schematically in Figure 4-1. Transportation investment decisions are treated exogenously due to the highly political nature of these decisions. This research intends to make a contribution in improving the accessibility model. Other modules in the system represent the current use in practice and are described for completeness only. (For example, planners wishing to make forecasts of residence choice might wish to use a model Page 46
Model Development