B. Mosera)and K. Wasmer
EMPA Thun, Swiss Federal Institute for Materials Testing and Research, Laboratory for Materials Technology, 3602 Thun, Switzerland
L. Barbieri
Advanced Photonics Laboratory, Swiss Federal Institute of Technology EPFL, 1015 Lausanne, Switzerland
J. Michler
EMPA Thun, Swiss Federal Institute for Materials Testing and Research, Laboratory for Materials Technology, 3602 Thun, Switzerland
(Received 14 March 2006; accepted 18 December 2006)
A novel method for in situ scanning electron microscope (SEM) micro-compression tests is presented. The direct SEM observation during the instrumented compression testing allows for very efficient positioning and assessment of the failure mechanism. Compression tests on micromachined Si pillars with volumes down to 2m3are performed inside the SEM, and the results demonstrate the potential of the method. In situ observation shows that small diameter pillars tend to buckle while larger ones tend to crack before failure. Compressive strength increases with decreasing pillar diameter and reaches almost 9 GPa for submicrometer diameter pillars. This result is in
agreement with earlier bending experiments on Si. Difficulties associated with precise strain measurements are discussed.
I. INTRODUCTION
With the ongoing miniaturization of electronic com-ponents and also, increasingly, mechanical comcom-ponents, the investigation of size effects in physical and mechani-cal properties becomes more important. Generally, size effects are expected as soon as dimensional or micro-structural length scales of the microcomponent or mate-rial investigated become comparable with the length scale of the deformation or failure mechanism. This length scale may be in the range of micrometers for plasticity mechanisms, millimeters for fracture mecha-nisms, or below a nanometer for elastic properties.1 We can generally distinguish between the microstructural length scale (e.g., grain size) and the dimensional length scale (e.g., wire diameter).2 Here we limit ourselves to the study of dimensional constraints.
The mechanical properties of single-crystalline silicon as a function of specimen size have been investigated by a number of researchers. Many experiments have been performed on sub-millimeter-sized specimens.3–7Only a few experiments have reported on size effects in the micrometer and submicrometer regimes.8 With brittle failure dominating the behavior of single-crystalline sili-con, statistical means are often necessary to describe
ma-terial strength. Weibull statistics are most commonly used in such cases.9
Thus, a suitable testing method needs to have a sufficiently high throughput that allows the testing of a large number of specimens for statistical analysis.
All of the articles mentioned so far have used either bending or tensile tests for the determination of the me-chanical properties. No results on the compressive be-havior of submicrometer and micrometer-sized silicon specimens are available in literature. This is in contrast to the development in metallic materials, for which the compression testing of micromachined pillars is cur-rently an area of very active research (see, for example, Ref. 10). Many materials behave significantly different in compression than they do in tension or bending.11This is partly related to the failure behavior of the materials, particularly if tensile failure is defect dominated. In many cases, however, the observation is related to the particu-lar stress state in compression tests, which is usually not entirely uniaxial. The specimen geometry for a compres-sion test is a compromise between a rather high aspect ratio (length/diameter) that results in a more uniaxial stress state but is prone to buckling and a low aspect ratio that avoids buckling but has a more triaxial stress state. An aspect ratio of 3 is often used for ductile materials, whereas 1.5–2 may be used for brittle materials that ex-hibit only small deformations.11
Buckling conditions for different end constraints can be found in engineering textbooks such as Ref. 12.
a)
Address all correspondence to this author. e-mail: [email protected] DOI: 10.1557/JMR.2007.0140
The importance of lubrication of the platens contacting the compression specimen, particularly for small-aspect ratios, has been pointed out in several studies.13–15
Fric-tion leads to a deformaFric-tion constraint at the ends and increases stress triaxiality. Shear failure in compression tests is often a result of such end confinement and the accompanying triaxial stress state. For brittle materials, proper lubrication often results in failure by axial split-ting. The understanding of the formation of a crack par-allel to the applied load is still very basic. Concepts bor-rowed from linear elastic fracture mechanics (LEFM) and from bifurcation theories explain why distributed microcracks tend to align with the far field compressive stress.16
With friction and confinement at the end platens, the determination of strain from the displacement of the end platens and the original specimen height, in analogy to the tensile test, becomes approximate as axial strain along the loading axis is not uniform in the specimen. This is, of course, particularly critical if elastic properties such as Young’s modulus and Poisson’s ratio are to be calculated from a compression test.
The statistical behavior of the strength of single-crystalline silicon, together with the effect of end con-straints and aspect ratio on the failure behavior, compli-cates the investigation of size effects on strength. Namazu et al. have performed a large number of bending experiments on microfabricated silicon beams of differ-ent size and evaluated the size effect by statistical means.8,17
A clear size effect on characteristic strength as well as on Weibull modulus was found. Their study clearly shows that it is necessary to perform a large num-ber of experiments to correctly describe the material properties.
Fracture toughness tests are generally bound to a cer-tain specimen size to fulfill the requirements of LEFM and avoid large-scale yielding. These size requirements might be in contradiction with the requirement of testing small-scale specimens. Nevertheless, some researchers have estimated fracture toughness on micromachined single-crystalline and polycrystalline silicon speci-mens.18,19All of these methods are invariably time con-suming, and so it is difficult to generate significant data for statistical purposes. Apart from the difficulties in measuring valid fracture toughness values, their applica-tion as design criteria for microparts is not evident, ei-ther.
We present here a novel micro-compression test method that allows for the efficient testing of a large number of specimens. The method consists of perform-ing instrumented compression tests on pillars inside the scanning electron microscope (SEM). Performing these tests inside the SEM facilitates positioning greatly and allows the direct observation of the deformation of the pillars during the experiment. This gives access to
infor-mation concerning the deforinfor-mation and failure mode such as buckling and/or cracking. In this study, the method was used to investigate the mechanical behavior of micromachined silicon pillars of diameters ranging from 16 m down to 800 nm.
II. MATERIALS AND EXPERIMENTS
Cylindrical single-crystalline silicon pillars have been fabricated with diameters ranging from 800 nanometers to 16 micrometers. Silicon wafers (4 in. diameter,〈100〉 orientation, P/B-doped, 525m thick) were microstruc-tured by standard photolithography techniques. A Heidelberg DWL200 (Heidelberg Instruments GmbH, Heidelberg, Germany) direct laser writer was used to transfer the computer predefined design (with square dis-tribution of 2-, 3-, 10-, and 20-m-diameter circles) on the photo-resist (Shipley Microposit S1800 series, Shipley Europe Ltd., Conventry, UK) coated wafer.
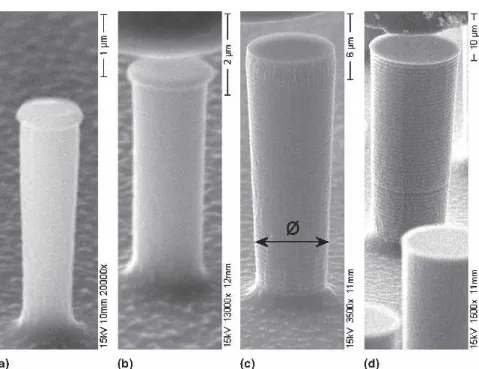
The samples studied in this work are referred to as Sq2, Sq3, Sq10, and Sq20, respectively, depending on the specific feature size of the corresponding original design. Substrate preparation and processing were dif-ferent depending on the desired typical feature size. In particular, samples Sq2 and Sq3 were obtained from silicon substrates where a 200-nm layer of SiO2 was previously grown by thermal oxidation in wet conditions. This layer [still visible as a little cap in Figs. 1(a) and 1(b)] worked as mask for the silicon anisotropic etching performed after the irradiation, the resist development, and the SiO2anisotropic etching steps. The silicon etch-ing method consisted of a simultaneous etchetch-ing and pas-sivation room-temperature process, performed in a plasma Alcatel 601 etcher (Alcatel Vacuum Technology, Annecy, France), using a mixture of fluorinated gases (i.e., SF6for etching and C4F8for side wall passivation). Samples Sq10 and Sq20 were obtained from silicon wafers coated with only a photoresist layer. After irra-diation and resist development, the wafers were aniso-tropically etched by applying a pulsed room-temperature process (so-called Bosch process20) in which a Si etching step (by SF6) lasting a few seconds was alternated with a sidewall protection step (by C4F8), also lasting a few seconds, in the same plasma Alcatel 601 etcher. For both etching processes, different durations were imposed de-pending on the desired height of the structures. When the etching process was complete, the residual photoresist was removed by a specific wet remover (Microposit Re-mover 1165) (Shipley Europe Ltd., Conventry, UK) and further cleaned by oxygen plasma in a Branson IPC 2000 Plasma System.
In addition to the little SiO2 cap visible on sam-ples Sq2 and Sq3, their sidewalls are flat compared to the sidewalls of sample Sq10 and Sq20 (see Fig. 1). This difference can be ascribed to the differences in the B. Moser et al.: Strength and fracture of Si micropillars: A new scanning electron microscopy-based micro-compression test
preparation process. Some of the pillars are not entirely cylindrical and have a variation of diameter along the axis. The most cylindrical pillars were chosen for the mechanical tests. The geometry of the pillars was assessed by SEM. The pillars are shown in Fig. 1, and their geometry is summarized in Table I. The diameter was measured from the SEM micrographs before defor-mation. For pillars with diameter variations along the axis, the diameter has been measured, somewhat arbi-trarily, near the lower end at about 20% of the height of the pillar (indicated in Fig. 1). The length of the pillars in one array is very uniform, and therefore no variation is indicated. Figure 2 shows an overview of an array of Sq10-pillars as an example of all other arrays used in this study.
The compression tests were performed using a cus-tom-built instrumented micro-indentation device that can be used inside the SEM. The instrument, the details of which are described elsewhere,21is based on a load cell fixed on a piezo-actuated positioning stage. In contrast to what is described in Ref. 21, the setup was extended by a second, smaller stick slip positioning stage fixed
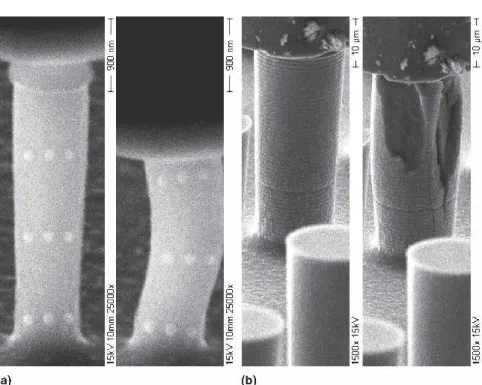
be-tween the load cell and the specimen, to allow full Car-tesian positioning of the specimen with respect to the indenter tip with several millimeters of positioning range. The compression tests were carried out using a dia-mond flat punch of a diameter larger that of the tested pillar. The tip was positioned, under the visual control of the SEM, over the pillar. The compression was per-formed under open loop control, prescribing a rate of voltage increase on the stack piezo. Load on the sample and displacement of the stack piezo were recorded. The SEM images were recorded in a video file during the experiment. On some of the specimens of sample Sq2 and Sq3, a grid of 9 small dots was applied on the pillar surface by e-beam contamination deposition [see Fig. 4(a)]. These dots allow quantitative evaluation of the deformation to be done from the video frames at a later time. This technique has proven to be a very simple and effective way of structuring smooth surfaces to make quantitative image analysis possible. On the larger pillars (Sq10 and Sq20), the surface roughness is large enough that no grid needs to be applied for the purpose of de-formation measurements.
FIG. 1. SEM micrographs of the four pillars used for compression testing: (a) Sq2, (b) Sq3, (c) Sq10, and (d) Sq20. The arrow indicates the approximate position for the diameter measurement.
TABLE I. Pillar geometry, compressive strength, and deformation mode (based on SEM observations) for the four samples tested. The values represent average values of 24–30 specimens tested, and the standard deviation is included.
Sample designation Number of specimens tested Mean strength (GPa) Length (m) Diameter (m) Aspect ratio (length/diameter) Percent of specimens buckling (%) Percent of specimens cracking (%) Sq2 24 8.8 ± 1.0 3.2 0.8 ± 0.08 3.9 63 0 Sq3 27 8.1 ± 0.8 4.8 1.7 ± 0.1 2.8 7 4 Sq10 27 7.0 ± 0.3 21.6 6.6 ± 0.06 3.3 0 15 Sq20 30 3.5 ± 0.4 38.3 16.2 ± 0.11 2.4 0 90
III. RESULTS
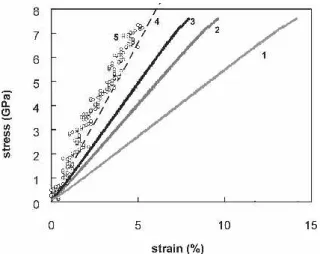
Mean compressive strength and geometrical data for all four different pillar sizes are listed in Table I, together with their respective main geometry parameters. Be-tween 24 and 30 specimens were tested from each diam-eter. Figure 3(a) shows a representative compressive stress–strain curve for each of the four samples. Strain was calculated from the displacement measurement of the instrumented stack piezo using an instrument com-pliance of 0.0038m/mN and corrected for pillar sink-in (see discussion below). Figure 3(b) shows compressive stress–strain curves from the identical four specimens shown in Fig. 3(a) with strain calculated from the relative displacement of marker points on the pillars corrected for 20° tilt of the indentation axis relative to the observation plane.
The deformation and failure behavior of the pillars were assessed by the direct SEM observation during the experiment. Buckling and cracking were observed as dis-tinct deformation and failure modes. The percentages of pillars buckling or cracking are indicated in Table I. It becomes obvious that the smallest pillars (Sq2) tend to buckle before breaking while for the largest pillars (Sq20), cracks are often formed before failure. For the two samples in between (Sq3 and Sq10), indications of buckling or crack formation were found only rarely in the video recordings, and they generally failed without warn-ing. The fracture mode of these pillars could therefore not be determined. Figure 4 shows the first and the last video frame before failure of a typical in situ compres-sion test of the smallest (Sq2) and largest (Sq20) pillar. Significant buckling is found in many of the smallest diameter pillars (Sq2). When a buckled pillar was un-loaded before final failure, the deformation seemed to be mostly reversible, although some damage was visible on
the pillar (Fig. 5). Axial cracking dominated the failure behavior of the thickest pillars (Sq20). Video sequences of the deformation and failure of the Sq2 and Sq20 pil-lars can be found at http://materialsscience.beaconstreet. ch/jmr_videos/Sq2.avi and http://materialsscience. beaconstreet.ch/jmr_videos/Sq20.avi, respectively.
IV. DISCUSSION
The method used to perform the presented compres-sion tests proved to be very efficient and allowed for a large number of tests (>30) to be carried out in a normal working day. This is a great advantage compared to other positioning techniques that are scanning based and is due to the high-resolution visual control of positioning inside the SEM. The method is not only more efficient than other methods, but it is also compatible with a large range of sizes from millimeters down to submicrometer
FIG. 2. Overview of an array of micromachined silicon pillars with a diameter of roughly 7m (Sq10) and a pitch (pillar to pillar distance) of around 40m.
FIG. 3. Representative compressive stress–strain curves of all four samples: (a) strain calculated from displacement information from the piezo using a compliance of 0.0038m/mN and corrected for pillar sink-in (see Sec. IV) and (b) strain calculated from the relative dis-placement of marker points (or other features on the pillars) in the SEM video recording corrected for 20° tilt.
pillars, where optical positioning using light microscopy becomes more difficult. Additionally, the method pro-vides not only mechanical data but also additional insight in the deformation and failure behavior of these pillars, as they can be observed during the test with the SEM. This real-time observation of the specimen also allows the validity of a test to be assessed; problems such as the tip touching other specimens are easily recognized, and erroneous data can be avoided.
Engineering stress s was calculated by dividing the load P by the initial cross-section A, determined from the diameter measured in the SEM (s⳱ P/A). The smallest tested pillars with submicrometer diameter achieved rela-tively high compressive strengths of almost 9 GPa. This is about 7% of the Young’s modulus in the〈100〉 direc-tion and goes along with high strains (determined in the video sequence from the relative distance of the e-beam written dots on the pillar) of up to 8%. The strain determination in the video was complicated by potential out-of-plane buckling (as discussed in more detail be-low). Still, an estimation of the curvature of the buckled
pillars just before failure also clearly indicated that strains of more than 10% can be sustained by the pillars before final failure. We can therefore conclude with con-fidence that the smallest pillars sustain high strains and stresses of up to 10% and 9 GPa, respectively.
The strain measurement from the extension of the z-axis piezo may be influenced by a number of effects. Compliance of the microindenter arises mostly from the load cell. A value of 0.0038m/mN was determined by comparison of indentation curves with a commercial nanoindenter (NanoXP from MTS, MTS Systems Cor-poration, Eden Prairie, MN). In addition to the compli-ance of the indenter, the sink-in of the pillar into the substrate material22 must be accounted for. This can be done using Sneddon’s equation for the indentation of a flat punch into an infinite half space, as in Ref. 22. If correction factors for root radius and contact radius are neglected, the following equation can be determined from Eq. (3) in Ref. 22 [D⳱ P(1 − )/2Gd]:
x D = 1 共1 − 2 兲⭈⭈
冉
h d冊
+ 1 ≈ 1.43⭈冉
h d冊
+ 1 共for = 0.33兲 ,where x is the compliance corrected displacement from the piezo, D is the amount of pillar sink-in, is Poisson’s ratio, and h and d the height and diameter of the pillar, respectively. For an aspect ratio of 3, the correction for pillar sink-in in the current experiments is close to 20% in strain and therefore significant. Instrument compliance and pillar sink-in are visible during SEM observation. As
FIG. 4. Frames extracted from the SEM video sequence recorded during the compression testing of the silicon pillars showing the first (left) and the last frame (right) just before failure of specimen: (a) Sq2 and (b) Sq20.
FIG. 5. Pillar after it has buckled and was unloaded again; while the deformation is mostly reversible and the pillar is straight, damage is clearly visible (see arrows).
most of the instrument compliance is related to the load cell, which is below the specimen, both instrument com-pliance and pillar sink-in result in pillar root displace-ment toward the substrate. The two effects cannot be separated in the SEM observation, and quantification is difficult because part of the instrument compliance (for example compliance of the piezo) is not visible. A rough comparison of pillar root displacement with pillar length change on a few pillars showed, however, that instrument compliance and pillar sink-in can be responsible for more than 50% of the measured strain. Figure 6 illustrates the influence of strain measurement using different methods. The residual discrepancy between the corrected strain measurement from the piezo recordings (curve 3) and the SEM-based strain measurement (curve 5) is most likely related to errors in compliance and simple assumptions made in the calculation of pillar sink-in.
It can be seen from Fig. 6 that the influences of com-pliance and pillar sink-in are significant in our setup and that strain measurement from the piezo displace-ment is not suitable for the measuredisplace-ment of elastic prop-erties. Strain can, however, be measured directly from the relative displacement of marker points or other fea-tures on the pillars in the recorded SEM video sequence. This has been done for a number of pillars of all diam-eters, and stress versus strain data were constructed [see Fig. 3(b)]. This method of measuring strain suffers, how-ever, from the fact that it cannot a priori be said that the pillars deform purely uniaxially. Buckling out of the ob-servation plane cannot be detected in the SEM micro-graph but will influence the strain measurement. Special care has been taken to ensure perfect alignment of all components of the load train. However, some residual
misalignment cannot be excluded. End constraints, as mentioned above, are additional influences on the defor-mation of the pillar. In our case the pillars are, in a first approximation and if substrate compliance is neglected, fully constrained at their base, and a finite amount of friction is present between the tip and the pillar top. From the axial cracking of the large pillars, it can be concluded that friction is not too high. High friction would inhibit axial splitting.15A friction coefficient around 0.1 is often assumed between diamond and any contact partner. However, without the precise knowledge of the friction value it cannot be said which part of the pillar deforms in a purely uniaxial way. Therefore, the calculated strain depends on the position of the reference points on the pillar and is only approximate. Nevertheless, the results show that the slope of these stress–strain curves does closely follow the theoretical prediction. This is true for samples Sq2, Sq3, and Sq10. Interestingly, Sq20-pillars have generally very low Young’s modulus values from both piezo and video measurements. The reason for this behavior is not entirely clear. Some residual misalign-ment could be at its origin. In summary, it can be said that strain can be determined by video analysis, but the effects of misalignment and buckling cannot be ex-cluded. The resulting data are noisy but still give a better estimation of the Young’s modulus than strain from the piezo measurement.
The mean fracture strength increases clearly with de-creasing diameter. This is in line with what was found by Namazu et al.17
. In Fig. 7, our compression strength data are compared with Namazu’s bending strength data as a function of the specimen volume. It is seen that our measurements are on average slightly below the values by Namazu et al. This is not surprising because Nama-zu’s values were measured in bending, where the stressed materials volume is, of course, smaller than in uniaxial compression testing. Nevertheless, our data agree rea-sonably well with Namazu’s data. Figure 8 shows a
FIG. 6. Influence of different strain calculation methods on the result-ing stress–strain curves: (1) strain calculated from raw displacement of the piezo, (2) strain calculated from compliance corrected piezo dis-placement, (3) strain calculated from compliance and pillar sink-in corrected piezo displacement, (4) theoretical elastic deformation of a Si(100) single crystal, and (5) strain calculated from the SEM video recording and corrected for 20° tilt.
FIG. 7. Strength as a function of specimen volume for the presented data from compression testing in comparison with the bending strength data presented by Namazu et al.17
2-parameter Weibull plot for all four samples tested. It is clearly seen that the data do not entirely follow a straight line. Still, when the data are evaluated according to the simple 2-parameter Weibull distribution,9 a fairly low Weibull modulus (also called shape parameter) around 10 is found for the smallest sample (Sq2). The two larger samples (Sq3 and Sq10) exhibit a higher Weibull modu-lus of around 20. The value for the largest sample (Sq20) cannot be determined with sufficient precision but is probably smaller than that for Sq3 and Sq10. While the higher values are comparable with the values presented by Namazu et al., the lower values are surprising, and the trend is not expected. Two reasons can be invoked to explain this result: (i) Some strength values of the small-est sample (Sq2) are clearly affected by buckling, and the variation is artificially increased by this, lowering the Weibull modulus. (ii) The strength of some of the largest specimens (Sq20) is certainly affected by stress concen-trations between the flat punch and the pillar surface (caused by roughness and misalignment), causing crack-ing and increascrack-ing the variation of the measured values. The distinct failure mechanism of the Sq2- and Sq20-pillars is probably at the origin of their lower Weibull modulus.
Because the compression tests were performed under continuous observation in the SEM, additional informa-tion on the failure behavior of the material tested is also available. It is clearly seen in Fig. 4 and Table I that the smallest diameter specimens (Sq2) primarily fail by buckling [see Fig. 4(a)], while some of the largest diam-eter specimens (Sq20) form various cracks before failure [see Fig. 4(b)]. Most specimens of the sample Sq3 and Sq10 did not exhibit visible buckling and/or cracking but mostly failed without prior notice. Buckling of pillars observed in the SEM is accompanied with a load reversal
(decreasing load after peak load) in the load– displacement curve whereas cracking is often accompa-nied by small load drops.
Cracking in the Sq20 specimen is mostly axial. It is not intuitively clear why cracks should develop along the loading axis. According to a model developed by Hoek,16 shearing along pre-existing microcracks results in stress conditions at the crack tips that favors their growth along the loading axis. It is, however, unlikely that microcracks exist in the silicon wafer. Cracks are most likely initiated at the pillar surface due to surface roughness or at the interface between diamond tip and pillar surface due to tip roughness. Stress concentrations may also arise from misalignment between the pillar surface and the tip.
It is interesting to ask at this point why no cracks are visible in the smaller pillars despite significantly higher applied stresses. Surface quality for samples Sq2 and Sq3 are clearly better than that for samples Sq10 and Sq20 (see Fig. 1). Because of smaller bending stiffness, the smaller diameter pillars can accommodate slight mis-alignment between the pillar surface and the tip so high stress concentrations at the contact can be avoided. This is not possible in the case of the largest diameter pillar Sq20. Also Sq20 has the smallest aspect ratio, causing the stress to be less uniaxial compared to the other pillars. With a homogeneous high uniaxial stress, no stable cracks can develop as they would immediately propagate catastrophically. Therefore, only a pillar with a small aspect ratio and inhomogeneous stresses (stress gradi-ents) is able to sustain stable and therefore visible cracks. Buckling would not necessarily be expected according to simple buckling conditions for sample Sq2 with a length-to-diameter ratio of 3.9. Boundary conditions are, however, not entirely clear. The free length of column is different depending on these boundary conditions. Be-cause of the compliance of the load cell and the relatively long load train, compliance in the lateral direction cannot be neglected. It is therefore not valid to assume both ends fixed with a pure axial load (resulting in a free length of column of 0.5 times the pillar length). A tip fully free to move laterally would result in a free length of column of 2 times the pillar length. These two extreme cases with the assumption of a Young’s modulus of 132 GPa result in a buckling stress between 22 and 1.4 GPa. Buckling at 8.8 GPa results from a free length of column roughly 0.79 times the pillar length and corresponds to one end fixed and the other end free to move axially and rotate. The same conditions, used to calculate buckling stresses for the other three samples (Sq3, Sq10, and Sq20), show that no buckling is expected. This is consistent with the experimental observation. This estimation of the Euler buckling condition assumes elastic buckling. The limited results available from tests unloading a buckled pillar suggest, however, that damage might be involved and the buckling process is not entirely elastic (see Fig. 5). The
FIG. 8. Weibull plot for the four samples Sq2, Sq3, Sq10, and Sq20 tested in this study (PoF stands for probability of failure).
nature of this damage is not known at the present stage. Other than the slenderness of the Sq2-pillars, possible misalignment might be at the origin of buckling. It was interesting to see that most of the pillars that buckled did so toward the same direction (right) as in the example in Fig. 4(a). Although special care was taken to have all the parts precisely machined and mounted, some small mis-alignment might still be present. In a summary, it cannot be said to what extent the observed buckling is related to material properties and specimen geometry and to what extent it is a testing artifact (misalignment and lateral compliance).
V. CONCLUSIONS
A new method of in situ SEM compression testing of micromachined Si micropillars has been presented. The ease of positioning in the SEM allows the testing of a large number of specimens in a short time. This allows for the statistical assessment of materials properties.
Strain measurement using the SEM video capture is possible; however, misalignment and out-of-plane buck-ling limits the usefulness of the result.
The compression strength of micron and submicron-sized Si pillars is size dependent and in good agreement with earlier results from bending tests.
The fracture behavior can be investigated from SEM videos. Small-diameter pillars tend to buckle while large diameter wires crack before failure.
ACKNOWLEDGMENTS
We thank the JMR reviewers for very helpful com-ments that have helped to improve our manuscript con-siderably. Financial support by the Swiss State Secre-tariat for Education and Research in the frame of the European Project FP6-NMP MASMICRO is gratefully acknowledged.
REFERENCES
1. O. Kraft and C.A. Volkert: Mechanical testing of thin films and small structures. Adv. Eng. Mater. 3, 99 (2001).
2. E. Arzt: Overview No. 130—Size effects in materials due to mi-crostructural and dimensional contraints: A comparative review. Acta Mater. 46, 5611 (1998).
3. F. Ericson and J.A. Schweitz: Micromechanical fracture strength of silicon. J. Appl. Phys. 68, 5840 (1990).
4. T. Tsuchiya, O. Tabata, J. Sakata, and Y. Taga: Specimen size effect on tensile strength of surface micromachined polycrystal-line silicon thin films. J. Microeletromech. S 7, 106–113 (1998).
5. W.N. Sharpe, Jr., B. Yuan, R. Vaidyanathan, and R.L. Edwards: Measurements of Young’s modulus, Poisson’s ratio, and tensile strength of polysilicon, in Tenth Annual International Workshop on Micro Electro Mechanical Systems (MEMS ’97 Proc., IEEE, 1997), pp. 424–429.
6. O.M. Jadaan, N.N. Nemeth, J. Bagdahn, and W.N. Sharpe: Proba-bilistic Weibull behavior and mechanical properties of MEMS brittle materials. J. Mater. Sci. 38, 4087 (2003).
7. S. Greek, F. Ericson, S. Johansson, and J.A. Schweitz: In situ tensile strength measurement and Weibull analysis of thick film and thin film micromachined polysilicon structures. Thin Solid Films 292, 247 (1997).
8. T. Namazu, Y. Isono, and T. Tanaka: Evaluation of size effect on mechanical properties of single crystal silicon by nanoscale bend-ing test usbend-ing AFM. J. Microelectromech. Syst. 9, 450 (2000). 9. W. Weibull: A Statistical Theory of the Strength of Materials, Vol.
151 (Generalstabens Litografiska Anstalts Fo¨rlag, Stockholm, 1939), pp. 1–45.
10. M.D. Uchic, D.M. Dimiduk, J.N. Florando, and W.D. Nix: Sample dimensions influence strength and crystal plasticity. Sci-ence 305, 986 (2004).
11. N.E. Dowling: Mechanical Behavior of Materials Engineering Methods for Deformation, Fracture, and Fatigue, 2nd ed. (Pren-tice Hall, Upper Saddle River, NJ, 1999).
12. E.J. Hearn: Mechanics of Materials an Introduction to the Me-chanics of Elastic and Plastic Deformation of Solids and Struc-tural Materials, 3rd ed. (Butterworth-Heinemann, Oxford, UK, 1999).
13. H.E. Read and G.A. Hegemier: Strain softening of rock, soil, and concrete—A review article. Mech. Mater. 3, 271 (1984). 14. A. Drescher and I. Vardoulakis: Geometric softening in triaxial
tests on granular material. Geotechnique 32, 291 (1982). 15. I. Vardoulakis, J.F. Labuz, E. Papamichos, and J. Tronvoll:
Con-tinuum fracture mechanics of uniaxial compression on brittle ma-terials. Int. J. Solids Struct. 35, 4313 (1998).
16. E. Hoek: Brittle failure of rock, in Rock Mechanics in Engineering Practice, edited by K.G. Stagg and O.C. Zienkiewicz (Wiley, London, UK, 1968), pp. 99–124.
17. T. Namazu, Y. Isono, and T. Tanaka: Nano-scale bending test of Si beam for MEMS, in Proceedings of the IEEE Thirteenth An-nual International Conference on Micro Electro Mechanical Sys-tems (IEEE, Miyazaki, Japan, 2000), pp. 205–210.
18. A.M. Fitzgerald, R.H. Dauskardt, and T.W. Kenny: Fracture toughness and crack growth phenomena of plasma-etched single crystal silicon. Sens. Actuators A Phys. 83, 194 (2000). 19. R. Ballarini, R.L. Muller, Y. Yin, H. Kahn, S. Stemmer, and
A.H. Heuer: Fracture toughness of polysilicon microdevices: A first report. J. Mater. Res. 12, 915 (1997).
20. J.K. Bhardwaj and H. Ashraf: Advanced silicon etching using high density plasmas, in Micromachining and Microfabrication Process Technology edited by K.W. Markus (Proc. SPIE—Int. Soc. Opt. Eng., Austin, TX, 1995), pp. 224–233.
21. R. Rabe, J-M. Breguet, P. Schwaller, S. Stauss, F-J. Haug, J. Patscheider, and J. Michler: Observation of fracture and plastic deformation during indentation and scratching inside the scanning electron microscope. Thin Solid Films 469–470, 206 (2004). 22. H. Zhang, B.E. Schuster, Q. Wei, and K.T. Ramesh: The design of
accurate micro-compression experiments. Scripta Mater. 54, 181 (2006).