© The Author 2014. Published by Oxford University Press on behalf of the British Occupational Hygiene Society.
846 •
Airborne Exposures to Monoethanolamine,
Glycol Ethers, and Benzyl Alcohol During
Professional Cleaning: A Pilot Study
Fabian Melchior Gerster
1,†, Nancy Brenna Hopf
1*,†, Pascal Pierre Wild
1,2and David Vernez
11.IST, Institute for Work and Health, Route de la Corniche 2, 1066 Epalinges, University of Lausanne and University of Geneva, Switzerland 2.INRS, National Institute for Research and Security, Institut national de recherche et de sécurité, Scientific Management,
Rue du Morvan CS 60027, 54519 Vandoeuvre-lès-Nancy, France *Author to whom correspondence should be addressed. Tel: 0041-(0)213-14-95-58;
fax: 0041-(0)213-14-74-20; e-mail: nancy.hopf@hospvd.ch
†These authors contributed equally to this work.
Submitted 16 October 2013; revised 24 February 2014; revised version accepted 27 March 2014.
Abstr Act
A growing body of epidemiologic evidence suggests an association between exposure to cleaning prod-ucts and respiratory dysfunction. Due to the lack of quantitative assessments of respiratory exposures to airborne irritants and sensitizers among professional cleaners, the culpable substances have yet to be identified.
Purpose: Focusing on previously identified irritants, our aims were to determine (i) airborne
con-centrations of monoethanolamine (MEA), glycol ethers, and benzyl alcohol (BA) during different cleaning tasks performed by professional cleaning workers and assess their determinants; and (ii) air concentrations of formaldehyde, a known indoor air contaminant.
Methods: Personal air samples were collected in 12 cleaning companies, and analyzed by conventional
methods.
Results: Nearly all air concentrations [MEA (n = 68), glycol ethers (n = 79), BA (n = 15), and
for-maldehyde (n = 45)] were far below (<1/10) of the corresponding Swiss occupational exposure limits
(OEL), except for ethylene glycol mono-n-butyl ether (EGBE). For butoxypropanol and BA, no OELs
exist. Although only detected once, EGBE air concentrations (n = 4) were high (49.48–58.72 mg m−3), and close to the Swiss OEL (49 mg m−3). When substances were not noted as present in safety data sheets of cleaning products used but were measured, air concentrations showed no presence of MEA, while the glycol ethers were often present, and formaldehyde was universally detected. Exposure to MEA was affected by its amount used (P = 0.036), and spraying (P = 0.000) and exposure to
butoxy-propanol was affected by spraying (P = 0.007) and cross-ventilation (P = 0.000).
Conclusions: Professional cleaners were found to be exposed to multiple airborne irritants at low
con-centrations, thus these substances should be considered in investigations of respiratory dysfunctions in the cleaning industry; especially in specialized cleaning tasks such as intensive floor cleaning.
KeywoRds: asthma; cleaning products; cleaning workers; exposure assessment; irritants; respiratory;
sensitizers
In troductIon
Several studies have identified cleaners as a group at risk for asthma (Bernstein et al., 1994; Ng et al., 1994; Karjalainen et al., 2001; Reinisch et al., 2001; Zock
et al., 2001, 2002, 2010; Karjalainen et al., 2002; Arif
et al., 2003; Medina-Ramón et al., 2003, 2005; Le Moual et al., 2004; Siracusa et al., 2013; Folletti et al.,
2014). Elevated risk of asthma is a wide-spread occu-pational and public health concern as it comprises a large workforce (3–4% of the working population) in industrialized countries (Karjalainen et al., 2001). Risk factors for respiratory health problems observed are not well understood due to lack of detailed exposure data.
Asthma symptoms have been associated with cleaning tasks such as cleaning furniture, using pol-ishes or sprays (Zock et al., 2001), and frequent use of bleach (Medina-Ramón et al., 2005). In a study of 31 occupational groups, janitors and cleaners were identified as having the highest incidence rate of work-related asthma (Jaakkola and Jaakkola, 2006).
Cleaning products (Bello et al., 2009) include chemical ingredients with ‘irritant’ or ‘sensitization’ properties. These chemicals have been associated with work-related asthma. Chemicals typically found in cleaning products include bleach, acids, bases, oxidizers, disinfectants, carpet cleaners, floor strip-per/waxer, ammonia, and glutaraldehyde (Zock, 2005; Bello et al., 2009; Obadia et al., 2009). New substances are continuously being added to this list. (Quirce and Barranco, 2010); amine compounds (Savonius et al., 1994) [e.g. monoethanolamine (MEA)], disinfectants (Purohit et al., 2000) (e.g. ben-zalkonium chloride), chlorine (bleach) (Sastre et al.,
2011), chloramine T (Sartorelli et al., 2010), glycol ethers (Zissu, 1995; Christine, 2011), scents contain-ing terpenes (e.g. pinene, d-limonene), eugenol, iso-thiazolinones, formaldehyde (preservatives), natural rubber latex (Quirce and Barranco, 2010), ammo-nia, hydrochloric acid, mixing bleach, and acid or ammonia (chloramines), reaction products between terpenes and ozone (Nazaroff and Weschler, 2004; Destaillats et al., 2006; Singer et al., 2006b) sodium hydroxide (caustic soda). Many of these chemicals are low molecular weight (MW) molecules such as volatile organic solvents (VOC) (e.g. butoxyethanol MW = 118.2), and some are suspected asthmatogens.
Low MW molecules can become airborne during cleaning tasks, and readily inhaled by the cleaning workers.
In a previous study (Gerster et al., 2014), we iden-tified cleaning products used by professional cleaning companies in Switzerland. Several of the companies responded positively to participating in a sampling campaign, and companies residing in the French-speaking cantons of Switzerland were included in this present study.
To accurately assess workers’ exposures in the cleaning industry it is necessary to understand type of cleaning products used in different cleaning tasks that give rise to airborne chemical exposures, in other words perform detailed exposure assessments. The list of suspected chemicals is long; we narrowed our choices to include:
(1) Chemicals from the low MW VOC family commonly found in cleaning products; glycol ethers (Zissu, 1995; Christine, 2011). The following glycol ethers were chosen based on results from previous studies (Bello et al.,
2009, 2010): ethylene glycol
mono-n-butyl ether (EGBE), diethylene
glycol monoethyl ether (DEGEE), diethylene glycol mono-n-butyl ether
(DEGBE), and butoxypropanol (2PG1BE), while others were included as they were listed in the safety data sheets of cleaning products used: dipropylene glycol monomethyl ether (DPGME), and phenoxyethanol (EGPhE) (Gerster et al., 2014). One exception was ethylene glycol monoe-thyl ether (EGEE), a glycol ether, that was never listed in safety data sheets of cleaning products.
(2) A known respiratory irritant, MEA, which is also a suspected sensitizer. (3) A third substance was added during
the study as we realized that the vola-tile benzyl alcohol (BA) was almost always present in the cleaning prod-ucts encountered. BA is used as a pre-servative and can lead to slight allergic reactions (British Pharmacopoeia
2013 Benzyl Alcohol http://www. pharmacopoeia.co.uk/pdf/BP_2014_ Index.pdf).
Formaldehyde (FA) is a common indoor pollut-ant that does not necessarily originate from clean-ing products (Quirce and Barranco, 2010), and a known respiratory irritant. It is therefore of inter-est to know the amount present in the air during cleaning.
Our aims in this pilot study were to determine: (1) Air concentrations of MEA, glycol
ethers, and BA during different cleaning tasks performed by professional cleaning workers in different companies, and (2) Background air concentrations of
formal-dehyde, a known indoor air pollutant. (3) Using the obtained results from aims 1
and 2 to model exposures. M ethods Company recruitment
Cleaning companies were identified from the Swiss Federal Office of Statistics using the code for cleaning companies [‘Nomenclature Générale des Activités économiques’ (NOGA code) (year: 2008)]. Of the 450 companies we contacted in the French-speaking cantons of Switzerland, 88 responded, and of these 52 were willing to participate in the sampling cam-paign. Companies in the French-speaking cantons that were willing to participate in the sampling campaign, were contacted again and interviewed with respect to cleaning activities performed, clean-ing sites and cleanclean-ing products used. ‘Substance of interest’ was defined as a chemical compound belonging to the selection of substances chosen to be analyzed for this study (see Introduction). If the company used cleaning products with at least one substance of interest, verified in the ingredients list-ing in the safety data sheets of the cleanlist-ing products, they were invited to participate. Safety data sheets were obtained from the cleaning products produc-ers. Finally, 12 cleaning companies were recruited. Cleaning companies were either privately (n = 6)
owned or state operated (n = 6) and the number of
employees ranged from 20 to >900. Privately owned
cleaning companies were always contracted by third parties such as particulars, hospitals and divers com-panies (industrial as well as administrative). State-operating companies worked for cities or communes and were active in public buildings such as schools and administrative offices.
Sampling strategy
Cleaning tasks of interest for our study were dis-cussed with each company to understand frequency and duration of the task specific to the company. The air samples were collected either after an initial visit or without a previous site visit which was decided between the cleaning company and the contracting company. The contracting company was informed about the sample collection day by the cleaning com-panies participating in our study.
A backpack containing the air-sampling pumps was used when all three (MEA, glycol ethers, and BA, and FA) sampling trains were needed. Main criterion for a sampling site and task was the use of at least one cleaning product containing at least one substance of interest. Between two and four workers were recruited from each worksite. The workers were asked to abstain from smoking during sampling.
Due to the complexity of cleaning products used and the multitude of tasks performed by a worker, a task-based sampling approach was used to better understand the type of exposures and when exposures occurred ‘Cleaning tasks of interest’ was defined as when the worker used cleaning products containing the substances of interest.
After identifying the workers performing the clean-ing tasks of interest, the workers were recruited and asked to wear the backpack with the sampling gear. The sample collections started when the workers started the cleaning task of interest, paused during the workers’ break, and stopped when the cleaning tasks ended. The sample collection was performed during the day shift.
Similar exposure groups were retrospectively iden-tified as similar in building type, cleaning tasks, other possible exposure sources, and persons present. These exposure groups are referred to as cleaning activities and described in Table 1. The cleaning activities apart-ment cleaning and public space cleaning, consisted of surface cleaning of multiple materials including glass, woods, stones, plastics, and metals. Different cleaning
products were applied during apartment cleaning and public space cleaning, whereas mainly professional cleaning products (e.g. general purpose cleaner, floor cleaner, glass cleaner) were used. However, for toilet and kitchen cleaning also commercial cleaning prod-ucts (e.g. scale removing prodprod-ucts) were used and no safety data sheets were available for these products. The industrial cleaning took place in a workshop hall and in new constructed buildings. In both cases one professional cleaning product was used. In the construction hall only the floor was cleaned. In the new constructed buildings mainly the floor but also other surfaces (windows, walls) were cleaned. The presence of other sources for chemical substances of interest was very likely during industrial cleaning, as other workers at the sampling sites used products such as joint adhesives. The patient room cleaning took place in a hospital and was similar to the clean-ing performed durclean-ing apartment and public space cleaning. In contrast, the use of cleaning products (professional type) was well defined and varied from
3 to 4 products, depending on the day in the week. Also for patient room cleaning the presence of other sources containing substances of interest was possi-ble (e.g. disinfection products used by medical staff). Intensive floor cleaning was a special cleaning activity where the top layer of the polyvinyl chloride or simi-lar plastics floors was removed by scrubbing using a scrubber, and a new layer was manually spread. For intensive floor cleaning it was sampled only during the removal of the old top floor layer, as this was the only task for which a substance of interest was identified to be present in the cleaning products used. Therefore a floor stripper, a specific product for removing the first floor layer, was used. The products used by the differ-ent companies contained always MEA. In contrast to the other cleaning activities it was possible to obtain information about the quantity of the work solution used, containing a known amount of the cleaning product.
Exposure determinants collected and considered for the statistical analysis and modeling were: spraying Table 1. Cleaning activities and their characteristics
Cleaning activity Characteristics
Intensive floor cleaning • Emptied rooms and corridors
• The top floor layer was removed and replaced by a new one • Only one cleaning product used
• No other persons present during cleaning
Apartment cleaning • Apartments
• Bathroom, kitchen, floor, window, and general surface—cleaning • Large number of cleaning products used
• No other persons present during cleaning Industrial cleaning • Construction sites and workshop halls
• Floor and general surface cleaning
• Other chemical substances than cleaning products likely present • Other persons present during cleaning
Public space cleaning • Any kind of public corridors, rooms, and bathrooms • Bathroom, floor, window, and general surface—cleaning • Other chemical substances than cleaning products likely present • Other persons present during cleaning
Patient room cleaning • Hospital
• Bathroom, kitchen, floor, window, and general surface—cleaning • Other chemical substances than cleaning products likely present • Other persons present during cleaning
(Yes/No), concentration of the respective substances in the cleaning products (mg ml−1) as recorded in the
Safety Data Sheets of the products used, estimated maximum amount of substance (MEA) used (ml) (estimated based on the amount of working solution used, the concentration of MEA in the cleaning prod-uct and the observed dilution of the cleaning prodprod-uct in the working solution), cross-ventilation (Yes: two openings to the outside/No: all other situations), gen-eral ventilation (Yes: present/No: absent), room size categories (very small: 10–50 m3, small: 50–300 m3,
medium: 300–500 m3, large: 500–1000 m3, very large:
>1000 m3).
Sampling and chemical analysis
In total, MEA, seven glycol ethers (DEGEE, DEGBE, DPGME, EGBE, EGEE, 2PG1BE, EGPhE), BA, and FA were sampled and analyzed (total analyses:
n = 486).
Glycol ethers and BA were collected and ana-lyzed systematically [even if not mentioned in the Material Safety Data Sheets (MSDS)] according to the Manual of Analytical Methods of the National Institute for Occupational Safety and Health num-ber 2555 (NIOSH 2554; Atlanta, GA, USA) using a solid sorbent tube (Anasorb® 747, 140 mg/70 mg; SKC Inc., Eighty Four, PA, USA) attached to an air sampling pump (Pocket Pump; SKC Inc.) oper-ating at 0.18 l min−1. Samples were desorbed in
dichloromethane:methanol (85:15, 1 ml) in an ultra-sonic bath (30 min). Gas chromatography (GC) (Agilent 6890, Santa Clara, CA, USA) equipped with a flame ionization detector was used for quantifica-tion. The limits of detection (LOD) were 0.5 μg sam-ple−1 for 2PG1BE, EGBE, DEGEE, DEGBE, EGPhE,
BA and 1 μg sample−1 for DPGME.
Collection and analysis of MEA has been described previously (Gerster et al., 2012). Briefly, impregnated (H2SO4) glass fiber filters inserted in
the filter holder and attached to an air sampling pump (Air Check XR5000; SKC Inc.) operating at 1 l min−1
was used for collecting airborne MEA. Desorption [sonication in basic solution; NaOH (4 mg ml−1) in
MeOH], was followed by capillary GC (Varian 3800, Palo Alto, CA, USA) (15 × 0.25 mm id, film thick-ness 0.5 μm, RTX-35 Amine; Restek, Bellefonte, PA, USA) analysis and nitrogen phosphorous selective detection. Separation was achieved using a specific
column for MEA (35% diphenyl and 65% dimethyl polysiloxane). The LOD was 1 µg sample−1.
FA sampling and analysis were performed accord-ing to previously described methods (Huynh, 1998; Huynh and Vu-Duc, 2002). Cartridges (LpDNPH S10 cartridge; Supelco, Bellefonte, PA, USA) was used for sampling and the air sampling pump (Air Check XR5000; SKC Inc.) operated at a flow rate of 1.5 l min−1. Desorption (3 ml acetonitrile) was
fol-lowed by High Performance Liquid Chromatography (HPLC) (Varian, Palo Alto, CA, USA, Prostar, pump model 230, UV Diode Array Detector model 335, wavelength: 365 nm) with a packed (3 μm) col-umn (Spherisorb; Waters, Milford, MA, USA) and equipped with ultraviolet (UV) detection. The LOD was 40 ng sample−1.
Statistical analysis
For descriptive purposes, geometric mean and geo-metric standard deviations (GSD) were computed. If the source of the sampled substances was known, the air concentrations were included in the statisti-cal models; otherwise they were regarded as ‘back-ground’. These background air concentrations were detected in the sample analysis (e.g. systematically all selected glycol ethers), but not known to be pre-sent in the cleaning products used (not mentioned in the MSDS of the cleaning product). When values below LOD were observed, maximum likelihood methods assuming log-normal distributions (stata command intreg) were used. As the task-specific measurements did vary in their duration, so did the corresponding sampling times and the LODs were adjusted to these sampling times by dividing the analytical LOD per sample by the sampling time. We further modeled the log-transformed measurements as a function of exposure determinants (spraying, concentration of MEA in the cleaning products, estimated maximum amount of MEA in the work-ing solutions, cross-ventilation, general ventilation, and room size categories) using an extension to the mixed linear regression accounting for meas-urements below LOD (stata command xtintreg). In these models, the companies were included as a random effect, whereas all other potential expo-sure determinants were included as fixed effects. The number of measurements precluded the use of backward selection, so that each determinant was
assessed in term and kept in the model when statisti-cally significant (P < 0.05).
r esults
Personal air samples were collected for MEA (n = 68),
glycol ethers (n = 79), BA (n = 15), and FA (n = 45)
during different cleaning tasks (Supplementary Table 1). One of the cleaning sites was sampled multiple times with repeated measurements for some worker (MEA: n = 17 on 5 workers, glycol ethers: n = 24 on
21 workers, FA: n = 21 on 17 workers). When
account-ing for the day sampled, no difference between intra- or interworker effects were detected (results not shown). All, but EGBE, air concentrations were far below (<1/10) the Swiss occupational exposure limits (OEL), except for 2PG1BE and BA, where no time weighted average (TWA) OELs are avail-able (Table 2). Of the seven glycol ethers measured, only four (EGBE, DEGEE, DEGBE, 2PG1BE) were listed in the safety data sheets of cleaning products used during sampling. GSD were high (>4) for DEGEE, DEGBE, and 2PG1BE (Table 2). EGBE was measured only once, during an intensive floor cleaning activity and the air concentrations were at the Swiss TWA OEL during the observed sampling time.
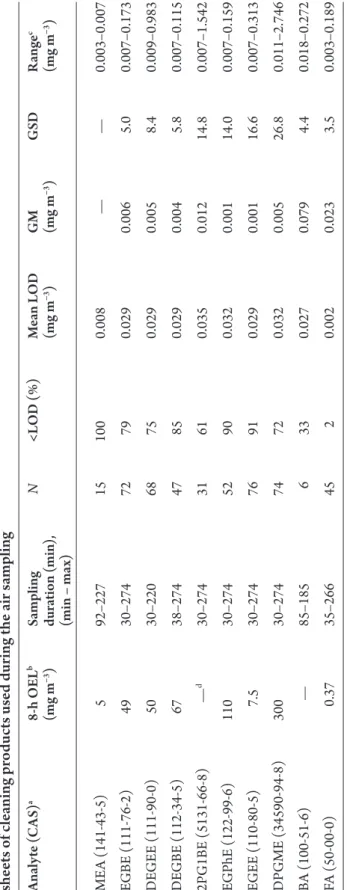
Even though 2PG1BE was not listed as an ingre-dient in the cleaning product, it was often detected in air (background). Background air concentrations (Table 3) showed no presence of MEA, while the glycol ethers were often present. FA was universally detected, albeit low (geometric mean (GM) 0.023 mg·m−3) compared to the TWA OEL (0.37 mg·m−3).
All of the targeted substances except for EGPhE were measured for intensive floor cleaning (Table 4). 2PG1BE was measured in all cleaning activities. DEGEE was in addition measured in apartment clean-ing, and DEGBE in patient room cleaning. EGPhE was only measured during patient room cleaning. BA was only sampled during intensive floor cleaning.
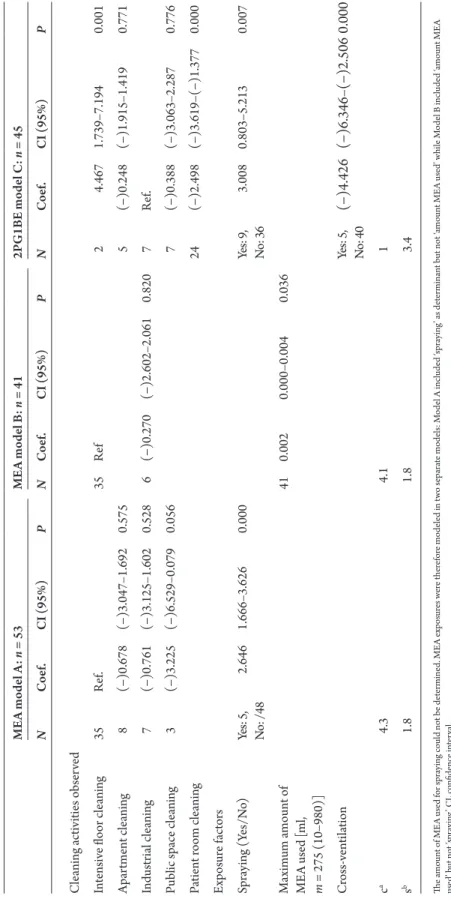
Sufficient numbers of measurements for modeling purposes were only collected for MEA and 2PG1BE (Table 5). The amount of MEA used for spraying could not be determined. MEA exposures were therefore modeled in two separate models: Model A included ‘spraying’ as determinant but not ‘amount MEA used’ while Model B included ‘amount MEA used’ but not ‘spraying’. None of the following exposure
determinants; cleaning activity, concentration in product used, cross-ventilation, and technical ven-tilation were significant for MEA air concentrations. Only spraying was significant in Model A. Maximum amount of MEA used was the only significant inde-pendent variable in Model B. Between companies variability was large (GSD ~ 4) and within companies variability low (GSD = 1, Table 5).
For 2PG1BE (Model C), only spraying and cross-ventilation were significant independent variables. Between companies variability was low (GSD = 1) and within companies’ variability was large (GSD = 3.4).
dIscussIon
Cleaners were exposed to mostly low concentrations of several irritants; MEA, mixtures of glycol ethers, and BA found in the cleaning product, in addition to low background FA concentrations. MEA exposure levels increased with the amount used and during spraying. PG1BE levels decreased with cross-ventila-tion and increased while spraying.
The measured airborne exposures to individual chemical substances were very low compared to their corresponding OEL (Table 2). Only once, the meas-ured air concentrations (EGBE) were at the OEL. Exposure to low concentrations of an irritant can result in asthma that deteriorates with low-level expo-sure and develops similarly to sensitization-induced asthma (Burge, 2010; Burge et al., 2012). This mecha-nism could potentially help explain the association between asthma in cleaning workers and their low exposures. No peak exposures were observed during the short sampling times (e.g. 30 min). However, also low exposures (e.g. to MEA) were associated to the development of asthma (Savonius et al., 1994)
Measured background concentrations suggest that cleaners have exposures to other glycol ethers and FA not present in the cleaning products used. Background concentrations were never detected for MEA (n = 15). The background sources for the
gly-col ethers (GEs) are unknown but it is possible that the cleaning products contained substances that were not listed in the MSDS or on the label, either by omis-sion or because labeling was not mandatory due to the small concentrations used (<1%). In industrial cleaning, construction workers worked side-by-side to the cleaning workers, using building material and products that could have contained our targeted
Ta ble 2. A ir c on ce ntr ations m eas ur ed for a ll cle anin g a ctiv itie s o bs er ve d, w he n s ubs ta nc es w er e n ot ed as pr es en t in th e sa fe ty d at a s he ets of cle anin g pr oducts us ed dur in g th e air sa mp lin g A na ly te ( C A S) a 8-h OEL b (m g m −3) 15-min OEL c (m g m −3) Sa mp lin g dur ation ( min ), (min – m ax ) N <L OD (%) M ea n L OD (m g m −3) G M (m g m −3) GSD R an ge d (m g m −3) ME A (141-43-5) 5 10 30–281 53 18 0.014 0.038 3.8 0.005–0.559 EGBE (111-76-2) 49 98 85–185 4 0 0.027 54.532 1.1 49.479–58.723 DE GEE (111-90-0) 50 100 38–274 9 22 0.034 0.053 7.0 0.011–0.877 DE GBE (112-34-5) 67 101 30–184 29 14 0.029 0.053 4.8 0.015–1.751 2PG1BE (5131-66-8) — e — f 36–197 45 40 0.025 0.049 13.3 0.011–5.344 EGP hE (122-99-6) 110 220 100–184 24 38 0.024 0.026 1.8 0.018–0.095 DPGME (34590-94-8) 300 300 106–108 2 100 0.026 — — 0.017–0.019 BA (100-51-6) — — 30–186 9 0 0.049 2.561 2.1 0.864–5.446 aC A S r efe rs t o ‘ C he mical A bs tra ct S er vic e’ r eg istr y n umbe r.. bEi gh t hour s t ime-w ei gh te d a ve ra ge oc cu pa tion al ex pos ur e le ve ls ( Sw iss OEL v alue s 2014). c 15-min shor t t ime oc cu pa tion al ex pos ur e le ve ls ( Sw iss OEL v alue s 2014). dThe lo w er l imit of the r an ge w as calc ul at ed w ith L OD/√(2), w he n c onc en tra tion s w er e <L OD . eN o 8-h OEL a vai la ble in S w itz erl and . fN o 15-min OEL a vai la ble in S w itz erl and .
Ta ble 3. A ir c on ce ntr ations m eas ur ed for a ll cle anin g a ctiv itie s o bs er ve d, w he n s ubs ta nc es w er e n ot de cl ar ed pr es en t in th e sa fe ty d at a sh ee ts of cle anin g pr oducts us ed dur in g th e air sa mp lin g A na ly te ( C A S) a 8-h OEL b (m g m −3) Sa mp lin g dur ation ( min ), (min – m ax ) N <L OD (%) M ea n L OD (m g m −3) G M (m g m −3) GSD R an ge c (m g m −3) ME A (141-43-5) 5 92–227 15 100 0.008 — — 0.003–0.007 EGBE (111-76-2) 49 30–274 72 79 0.029 0.006 5.0 0.007–0.173 DE GEE (111-90-0) 50 30–220 68 75 0.029 0.005 8.4 0.009–0.983 DE GBE (112-34-5) 67 38–274 47 85 0.029 0.004 5.8 0.007–0.115 2PG1BE (5131-66-8) — d 30–274 31 61 0.035 0.012 14.8 0.007–1.542 EGP hE (122-99-6) 110 30–274 52 90 0.032 0.001 14.0 0.007–0.159 EGEE (110-80-5) 7.5 30–274 76 91 0.029 0.001 16.6 0.007–0.313 DPGME (34590-94-8) 300 30–274 74 72 0.032 0.005 26.8 0.011–2.746 BA (100-51-6) — 85–185 6 33 0.027 0.079 4.4 0.018–0.272 FA (50-00-0) 0.37 35–266 45 2 0.002 0.023 3.5 0.003–0.189 aCA S r efe rs t o ‘ C he mical A bs tra ct S er vic e’ r eg istr y n umbe r. bEi gh t hour s t ime-w ei gh te d a ve ra ge oc cu pa tion al ex pos ur e le ve ls ( Sw iss OEL v alue s 2014). cThe lo w er l imit of the r an ge w as calc ul at ed w ith L OD/√(2), w he n c onc en tra tion s w er e <L OD . dN o 8-h OEL a vai la ble in S w itz erl and .
Ta ble 4. A ir c on ce ntr ations b y cle anin g a ctiv itie s, w he n s ubs ta nc es w er e n ot ed as pr es en t in th e sa fe ty d at a s he ets of cle anin g pr oducts us ed dur in g th e air sa mp lin g Su bst an ce #D a In te nsiv e floor cle anin g #D A pa rtm en t cle anin g #D In dus tr ia l cle anin g #D Pub lic sp ac e cle anin g #D Pa tie nt r oom cle anin g 16 b N [<L OD (%)] G M (m g m −3), (GSD ) 2 b N [<LOD (%)] G M (m g m −3), (GSD ) 4 b N [<L OD (%)] G M | (m g m −3), (GSD ) 4 b N [<LOD (%)] G M (m g m −3), (GSD ) 10 b N [<L OD (%)] G M (m g m −3), (GSD ) ME A 16 35 (30) 0.055 (3.6) 2 8 (0) 0.031 (4.0) 3 7 (0) 0.014 (1.5) 1 3 (0) 0.017 (1.4) EGBE 1 4 (0) 54.532 (1.1) DE GEE 3 6 (33) 0.083 (10.1) 1 3 (0) 0.019 (1.4) DE GBE 3 5 (0) 1.201 (1.3) 10 24 (17) 0.031 (1.6) 2PG1BE 1 2 (0) 0.206 (1.0) 1 5 (0) 0.513 (4.5) 3 7 (0) 0.198 (1.6) 2 7 (14) 0.394 (10.6) 10 24 (71) 0.005 (15.1) EGP hE 10 24 (38) 0.026 (1.8) DPGME 1 2 (0) — BA 5 c 9 (0) 2.561 (2.1) aN umbe r of s amp lin g d ays (#D ) w he n the s ubs ta nc e w as pr es en t in the cle anin g pr oduct( s) us ed . bTot al #D s for cle anin g a ct iv itie s. cBA w as c on side re d for only si x s amp lin g d ay .
Ta ble 5. M ulti ple r egr es sion r es ults on log -tr ans for m ed c on ce ntr ations a cc oun tin g for v alue s be lo w L OD M EA m ode l A : n = 53 M EA m ode l B : n = 41 2PG1B E m ode l C: n = 45 N C oef. C I (95%) P N C oef. C I (95%) P N C oef. C I (95%) P C le anin g a ct iv itie s o bs er ve d In te nsiv e floor cle anin g 35 R ef. 35 R ef 2 4.467 1.739–7.194 0.001 A pa rtme nt cle anin g 8 (−)0.678 (−)3.047–1.692 0.575 5 (−)0.248 (−)1.915–1.419 0.771 Indus tr ial cle anin g 7 (−)0.761 (−)3.125–1.602 0.528 6 (−)0.270 (−)2.602–2.061 0.820 7 R ef. Pub lic sp ac e cle anin g 3 (−)3.225 (−)6.529–0.079 0.056 7 (−)0.388 (−)3.063–2.287 0.776 Pa tie nt r oom cle anin g 24 (−)2.498 (−)3.619–(−)1.377 0.000 Ex pos ur e fa ct or s Spr ay in g (Y es/N o) Ye s: 5, N o: /48 2.646 1.666–3.626 0.000 Ye s: 9, N o: 36 3.008 0.803–5.213 0.007 M ax im um a moun t of ME A us ed [ ml , m = 275 (10–980)] 41 0.002 0.000–0.004 0.036 C ros s-ve nt ila tion Ye s: 5, N o: 40 (−)4.426 (−)6.346–(−)2.506 0.000 c a 4.3 4.1 1 s b 1.8 1.8 3.4 The a moun t of ME A us ed for spr ay in g c ould not be de te rmine d. ME A ex pos ur es w er e the refor e mode le d in t w o s ep ar at e mode ls: M ode l A include d ‘ spr ay in g’ as de te rmin an t but not ‘ amoun t ME A us ed ’ w hi le M ode l B include d ‘ amoun t ME A us ed ’ but not ‘ spr ay in g’. C I, c onfide nc e in te rv al . aGS D for be tw ee n-comp an y v ar ia bi lit y. bGS D for w ithin-comp an y v ar ia bi lit y.
substances. Air fresheners, perfumes, and disinfec-tion products were often present during public space cleaning, and can have contributed to the concentra-tions measured. Similar condiconcentra-tions were observed for patient room cleaning, whereas in hospitals additional sources are possible.
Mean FA air concentrations were lower than air concentrations reported in literature for public build-ings, schools, and private houses in Europe (max: 57.2 μg m−3) (Geiss et al., 2011). Increased FA
concen-trations observed have been attributed to a reaction between terpenes present in the cleaning products and ozone (Singer et al., 2006a). In the present study, the FA concentrations differed greatly between sam-pling dates. We did not sample on days where cleaning was not performed; therefore, the FA sources remain unknown.
Although only detected once, EGBE concentra-tions were high, hovering at the Swiss 8-h TWA OEL (49 mg m−3). It has to be considered that the sampling
time was <8 h and the air sampling was stopped when the solution containing EGBE was not used any more. Assuming that there was no exposure to EGBE after and before sampling, the exposure of the cleaning workers was elevated but not at the 8-h TWA OEL. If the detected concentrations are corrected with an air volume that would correspond to an 8-h work shift (air flow of 1 l min−1), the EGBE air
concentra-tions would be above 20–45% of the 8-h TWA OEL of Switzerland. Considering a worst case scenario, with an 8-h work shift of nonstop work under the same conditions as observed during the sampling time, the exposures of the cleaning workers would be at the 8-h TWA OEL.
A recent study modeled EGBE concentrations in a cleaning scenario with 5% and 0.1% EGBE in clean-ing product and a ventilation rate of 4 l h−1, and
con-cluded that concentrations would be below levels of concern (1.2 mg m−3) (Koontz et al., 2006). Moreover,
a test chamber (50 m3) experiment measured EGBE
concentration during common cleaning tasks such as scrubbing, rinsing, spraying, wiping, and floor mopping using cleaning products containing EGBE (6–62 mg ml−1), and concluded that average EGBE
emissions in the air ranged from 0.3 to 2.3 mg m−3
(Singer et al., 2006b). Using laboratory emission data, the daily intake of EGBE by inhalation if an all-pur-pose spray cleaner and a spray glass cleaner were used,
has been estimated and varied from 0.004 to 0.186 [mg (kg body weight)−1 day−1] (Zhu et al., 2001).
More recent studies reported higher EGBE con-centrations. In a quasi-experimental study, with simulated cleaning tasks but controlled factors that potentially impact exposures, bathroom cleaning was investigated (Bello et al., 2013). Three cleaning products containing EGBE in 25–40% (glass cleaner and bathroom cleaner) and 35–45% (general pur-pose cleaner) were sprayed and then wiped. Average EGBE air concentrations estimated were 3.77 ppm (18 mg m−3, SD = 2.24), whereas highest estimates
were around 8.7 ppm (42 mg m−3) for mirror
clean-ing when a general purpose cleaner was used (Bello
et al., 2013). The same authors concluded in a pre-ceding simulation study, that EGBE air concentra-tions could approach OEL during cleaning activity (Bello et al., 2010). Another recent study investi-gating EGBE air concentrations during cleaning using a cleaning product with 7.5% EGBE, reported air concentration ranging from 4.5 to 13.5 mg m−3
(mean = 7.5 mg m−3, SD = 3.5 mg m−3) (Fromme
et al., 2013).
In our study, the cleaners used the EGBE contain-ing cleancontain-ing product in more concentrated form (25– 100% of cleaning product in working solution) than instructed in the technical data sheet and more clean-ing product (up to 20 l for ~55 m2 instead of maximal 3
l observed during other intensive floor cleanings). The reason therefore was that the old floor layer was very difficult to remove. This increase in both, concentra-tion and amount used, could potentially explain the high EGBE air concentrations found. Unfortunately during the entire sampling campaign, there was no other sampling date with a cleaning product contain-ing EGBE. Therefore, there is no information about air concentrations of EGBE when the cleaning product is used under different conditions with less concentra-tion and quantity.
An increased exposure due to spraying is not sur-prising because volatile compounds may evaporate faster and also aerosols are produced. Aerosols may contain both, volatile and nonvolatile substances (Magorzata and Jolanta, 2010). A study investigat-ing the nonoccupational use of common household cleaning products (3503 participants), observed an increased incidence of asthma if cleaning sprays were used at least 4 days per week (Zock et al., 2007).
Spraying was expected as a significant independent variable in our model. Recommendation in mini-mizing exposures to cleaning products is to not use sprays.
Our model results also confirmed that the amount of substance in the product is an important exposure determinant for the air concentration of the substance. It is not unusual for these products to be used in higher concentrations or larger amounts than neces-sary. This may be related to the deep rooted, though unfounded belief that cleaning is done better and/or quicker this way (Zock, 2005). This was also observed in our study, where high EGBE exposures were found when product guidelines (technical data sheets) were not followed. Prevention measures should consider all these conditions in order to be effective in reducing exposures to irritants and sensitizers among cleaners.
For 2PG1BE, the absence of cross-ventilation increased the air concentrations. Therefore, cross-ventilation could be a prevention measure. However, cross-ventilation might be difficult to obtain in new buildings that have not the possibility to open windows.
Prevention strategies must also consider the great variability between companies observed in our study, as one strategy might work in one company while not in another. For example, the same cleaning task may be performed differently during patient room and public space cleaning where on-lookers are present compared to industrial cleaning where nobody watches and in addition where risk is perceived differently.
There are large GSDs (Table 4) within cleaning activities (intensive floor cleaning: 10.1 for DEGEE, public space cleaning: 10.6 for 2PG1BE, and patient room cleaning: 15.1 for 2PG1BE). The measurements that were <LOD (14–41%) contributed eventu-ally to the high GSDs. There was in addition a vari-ability of environmental and task-related conditions within cleaning activities. Cleaning activities or simi-lar exposure groups do not necessarily belong to the same homogenous groups. For example, in the case of intensive floor cleaning, the high concentrations of EGEE during one sampling date might be explained by the use of several different cleaning products by other cleaning workers that were cleaning on the same floor in a training center for professional cleaners. For public space cleaning, the large differences of 2PG1BE air concentrations measured could be explained by
the exposure determinants ‘spraying’ and/or ‘cross ventilation’, different types of rooms that were cleaned (bathroom, corridor, offices) and other persons that were present at the sampling site and that used chemi-cal products (e.g. perfumes). It is good possible that during patient room cleaning in hospitals, other sources for glycol ethers and chemical substances were present. In addition, during patient room cleaning, cleaning workers had a choice of products and it was not always possible to assess if the product containing 2PG1BE was used.
In this pilot study, we show that cleaners’ task expo-sures depend on amount of cleaning product used, concentration of the chemical ingredient(s), cross-ventilation, and application method (especially spray-ing). This information is relevant for the improvement of exposure assessment in epidemiological studies. For example, it would be better to treat cleaners as het-erogenous exposure group, and rather classify them based upon their chemical exposures (e.g. exposed or not exposed to MEA).
One major challenge with assessing exposures to cleaning mixtures is the complexity of products used and tasks performed each day. Therefore, the main criterion for conducting an air sampling was the pres-ence of a substance of interest in the cleaning products during the cleaning activities observed. This resulted in a task-specific sampling campaign with very vary-ing samplvary-ing durations (30–281 min). For example, general surface cleaning products were used in apart-ment cleaning activities including bathroom, kitchen, floor window, and general surface cleaning. Cleaning an apartment was considered a task and the sampling time was longer. MEA was used in specialty cleaning (removing the first floor layer) and was performed by specially trained workers. These sampling times varied depending on the surface area that was resurfaced, and lasted from 30 min to up to 280 min.
Cleaners’ exposures are complex, especially regard-ing exposure to mixtures of irritants and sensitizers. A major limitation of our study, as with most pilot studies, is that we could not include more of the rel-evant irritants currently known as this would require a larger study budget. Although exposures were low for each of our targeted compounds, the mixture effect between BA together with MEA and glycol ethers might provoke other respiratory health effects than if exposure to just one. Currently, no satisfactory
method exists for taking into account exposures to several irritants simultaneously. Interestingly, low-level exposures to irritants were recently identified to be potentially involved in asthma development (Burge, 2010; Burge et al., 2012). This mechanism might be relevant for cleaning workers, as professional cleaning products contain many irritants (Bello et al.,
2009, 2010).
Conclusion
Professional cleaners were found to be exposed to multiple airborne irritants and sensitizers at low con-centrations, thus these substances should be consid-ered in investigations of respiratory dysfunctions in the cleaning industry; especially in specialized clean-ing tasks such as intensive floor cleanclean-ing. In addition, exposures depended on the amount of substance pre-sent in the products, cross-ventilation, and spraying of the cleaning product.
supple M en tAry dAtA
Supplementary data can be found at http://annhyg. oxfordjournals.org/
FundIng
Swiss Federal Office of Public Health (10.000.478). Acknowled ge M en ts
We thank the hospital occupational hygienists, Ms Sylvie Praplan and Mr Olivier Favre and the head of the cleaning department, Ms Hanhart, for their par-ticipation in initial assessment of the study param-eters, recruiting cleaners, and general understanding of the cleaning tasks. We also thank our colleagues Ms Christine Arnoux and Mr Philippe Boiteux for the analysis of glycol ethers and aldehydes, respectively, and Ms Nicole Charriere for performing the air sam-pling. In addition, we thank all participating cleaning workers and participating companies.
r eFer ences
Arif AA, Delclos GL, Whitehead LW et al. (2003) Occupational
exposures associated with related asthma and work-related wheezing among U.S. workers. Am J Ind Med; 44:
368–76.
Bello A, Quinn MM, Perry MJ et al. (2009) Characterization
of occupational exposures to cleaning products used for
common cleaning tasks–a pilot study of hospital cleaners.
Environ Health; 8: 11.
Bello A, Quinn MM, Perry MJ et al. (2010) Quantitative
assessment of airborne exposures generated during com-mon cleaning tasks: a pilot study. Environ Health; 9: 76.
Bello A, Quinn MM, Milton DK et al. (2013) Determinants of
exposure to 2-butoxyethanol from cleaning tasks: a quasi-experimental study. Ann Occup Hyg; 57: 125–35.
Bernstein JA, Stauder T, Bernstein DI et al. (1994) A
com-bined respiratory and cutaneous hypersensitivity syndrome induced by work exposure to quaternary amines. J Allergy Clin Immunol; 94(2 Pt 1): 257–9.
Burge PS. (2010) Recent developments in occupational asthma. Swiss Med Wkly; 140: 128–32.
Burge PS, Moore VC, Robertson AS. (2012) Sensitization and irritant-induced occupational asthma with latency are clini-cally indistinguishable. Occup Med (Lond); 62: 129–33.
Christine B. (2011) Les éthers de glycol (Vol. 2 ième
edi-tion). Institut national de recherche et de sécurité pour la prévention des accidents du tavail et des maladies pro-fessionelles (INRS), Departement expertise et conseil technique.
Destaillats H, Lunden MM, Singer BC et al. (2006) Indoor
sec-ondary pollutants from household product emissions in the presence of ozone: a bench-scale chamber study. Environ Sci Technol; 40: 4421–8.
Fromme H, Nitschke L, Boehmer S et al.; HBMnet. (2013)
Exposure of German residents to ethylene and propyl-ene glycol ethers in gpropyl-eneral and after cleaning scenarios.
Chemosphere; 90: 2714–21.
Folletti I, Zock JP, Moscato G et al. (2014) Asthma and rhinitis
in cleaning workers: a systematic review of epidemiological studies. J Asthma; 51: 18–28.
Geiss O, Giannopoulos G, Tirendi S et al. (2011) The AIRMEX
study - VOC measurements in public buildings and schools/kindergartens in eleven European cities: statistical analysis of the data. Atmos Environ; 45: 3676–84.
Gerster FM, Hopf NB, Huynh CK et al. (2012) A simple gas
chromatography method for the analysis of monoethanola-mine in air. J Sep Sci; 35: 2249–55.
Gerster FM, Vernez D, Wild PP et al. (2014) Hazardous
sub-stances in frequently used professional cleaning products.
Int J Occup Environ Health; 20: 46–60.
Huynh C-K. (1998) Aldehyde active sampling by various tech-niques during the European sampling project. Occup Hyg, Int Occup Hyg Assoc; 4: 267–80.
Huynh CK, Vu-Duc T. (2002) Intermethod comparisons of active sampling procedures and analysis of aldehydes at environmental levels. Anal Bioanal Chem; 372: 654–7.
Jaakkola JJ, Jaakkola MS. (2006) Professional cleaning and asthma. Curr Opin Allergy Clin Immunol; 6: 85–90.
Karjalainen A, Kurppa K, Martikainen R et al. (2002)
analysis of an incidence study of the Finnish population.
Scand J Work Environ Health; 28: 49–57.
Karjalainen A, Kurppa K, Martikainen R et al. (2001) Work is
related to a substantial portion of adult-onset asthma inci-dence in the Finnish population. Am J Respir Crit Care Med;
164: 565–8.
Koontz M, Price P, Hamilton J et al. (2006) Modeling
aggre-gate exposures to glycol ethers from use of commercial floor products. Int J Toxicol; 25: 95–107.
Le Moual N, Kennedy SM, Kauffmann F. (2004) Occupational exposures and asthma in 14,000 adults from the general population. Am J Epidemiol; 160: 1108–16.
Magorzata Pn, Jolanta S. (2010) Harmful chemical agents in the work environment. In Koradecka D, editor. Handbook of occupational safety and health. Boca Ratan, FL: CRC Press.
pp. 103–137.
Medina-Ramón M, Zock JP, Kogevinas M et al. (2003) Asthma
symptoms in women employed in domestic cleaning: a community based study. Thorax; 58: 950–4.
Medina-Ramón M, Zock JP, Kogevinas M et al. (2005) Asthma,
chronic bronchitis, and exposure to irritant agents in occu-pational domestic cleaning: a nested case-control study.
Occup Environ Med; 62: 598–606.
Nazaroff WW, Weschler CJ. (2004) Cleaning products and air fresheners: exposure to primary and secondary air pollut-ants. Atmos Environ; 38: 2841–65.
Ng TP, Hong CY, Goh LG et al. (1994) Risks of asthma
associ-ated with occupations in a community-based case-control study. Am J Ind Med; 25: 709–18.
Obadia M, Liss GM, Lou W et al. (2009) Relationships between
asthma and work exposures among non-domestic cleaners in Ontario. Am J Ind Med; 52: 716–23.
Purohit A, Kopferschmitt-Kubler MC, Moreau C et al. (2000)
Quaternary ammonium compounds and occupational asthma. Int Arch Occup Environ Health; 73: 423–7.
Quirce S, Barranco P. (2010) Cleaning agents and asthma. J Investig Allergol Clin Immunol; 20: 542–50; quiz 2p following 550.
Reinisch F, Harrison RJ, Cussler S et al. (2001) Physician
reports of work-related asthma in California, 1993-1996.
Am J Ind Med; 39: 72–83.
Sartorelli P, Paolucci V, Rendo S et al. (2010) [Asthma induced
by chloramine T in nurses: case report]. Med Lav; 101:
134–8.
Sastre J, Madero MF, Fernández-Nieto M et al. (2011) Airway
response to chlorine inhalation (bleach) among cleaning workers with and without bronchial hyperresponsiveness.
Am J Ind Med; 54: 293–9.
Savonius B, Keskinen H, Tuppurainen M et al. (1994)
Occupational asthma caused by ethanolamines. Allergy; 49:
877–81.
Singer BC, Coleman BK, Destaillats H et al. (2006a) Indoor
secondary pollutants from cleaning product and air fresh-ener use in the presence of ozone. Atmos Environ; 40:
6696–710.
Singer BC, Destaillats H, Hodgson AT et al. (2006b) Cleaning
products and air fresheners: emissions and resulting con-centrations of glycol ethers and terpenoids. Indoor Air; 16:
179–91.
Siracusa A, De Blay F, Folletti I et al. (2013) Asthma and
expo-sure to cleaning products - a European Academy of Allergy and Clinical Immunology task force consensus statement.
Allergy; 68: 1532–45.
Zhu J, Cao XL, Beauchamp R. (2001) Determination of 2-butoxyethanol emissions from selected consumer products and its application in assessment of inhalation exposure associated with cleaning tasks. Environ Int; 26:
589–97.
Zissu D. (1995) Experimental study of cutaneous tolerance to glycol ethers. Contact Dermatitis; 32: 74–7.
Zock JP. (2005) World at work: cleaners. Occup Environ Med;
62: 581–4.
Zock JP, Kogevinas M, Sunyer J et al.; Spanish working group
of the European Community Respiratory Health Survey. (2001) Asthma risk, cleaning activities and use of specific cleaning products among Spanish indoor cleaners. Scand J Work Environ Health; 27: 76–81.
Zock JP, Kogevinas M, Sunyer J et al.; European Community
Respiratory Health Survey. (2002) Asthma characteristics in cleaning workers, workers in other risk jobs and office workers. Eur Respir J; 20: 679–85.
Zock JP, Plana E, Jarvis D et al. (2007) The use of
house-hold cleaning sprays and adult asthma: an international longitudinal study. Am J Respir Crit Care Med; 176:
735–41.
Zock JP, Vizcaya D, Le Moual N. (2010) Update on asthma and cleaners. Curr Opin Allergy Clin Immunol; 10: 114–20.