Balancing a Cline by Influx of Migrants:
A Genetic Transition in Water Frogs of
Eastern Greece
Hansjürg Hotz, Peter Beerli, tHomas Uzzell, gaston-Denis gUex, nicolas B. m. PrUvost,
roBert scHreiBer, anD jörg Plötner
Institut für Evolutionsbiologie und Umweltwissenschaften, Universität Zürich-Irchel, Winterthurerstrasse 190, 8057 Zurich, Switzerland (Hotz, Guex, and Pruvost); Museum für Naturkunde, Leibniz-Institut für Evolutions- und
Biodiversitätsforschung an der Humboldt-Universität zu Berlin, Invalidenstraße 43, 10115 Berlin, Germany (Hotz, Schreiber, and Plötner); Department of Scientific Computing, Florida State University, Tallahassee, FL 32306–4120 (Beerli); and Laboratory for Molecular Systematics and Ecology, Academy of Natural Sciences, 1900 B. F. Parkway, Philadelphia, PA 19103, USA (Uzzell).
Address correspondence to Peter Beerli at the address above, or e-mail: [email protected].
Abstract
Variation patterns of allozymes and of ND3 haplotypes of mitochondrial DNA reveal a zone of genetic transition among western Palearctic water frogs extending across northeastern Greece and European Turkey. At the western end of the zone, allozymes characteristic of Central European frogs known as Pelophylax ridibundus predominate, whereas at the eastern end, alleles characteristic of western Anatolian water frogs (P. cf. bedriagae) prevail. The ND3 haplotypes reveal 2 major clades, 1 characteristic of Anatolian frogs, the other of European; the European clade itself has distinct eastern and western subclades. Both the 2 major clades and the 2 subclades overlap within the transition zone. Using Bayesian model selection methods, allozyme data suggest considerable immigration into the Nestos River area from eastern and western populations. In contrast, the ND3 data suggest that migration rates are so high among all locations that they form a single panmictic unit; the best model for allozymes is second best for mitochondrial DNA (mtDNA). Nuclear markers (allozymes), which have roughly 4 times as deep a coalescent history as mtDNA data and thus may reflect patterns over a longer time, indicate that eastern and western refugial populations have expanded since deglaciation (in the last 10 000 years) and have met near the Nestos River, whereas the mtDNA with its smaller effective population size has already lost the signal of partitioning into refugia.
Key words: allozymes, Bayes factors, gene flow, hybridization, migration, mitochondrial DNA, model selection, Pelophylax, sympatry, water frogs
Secondary contact zones between previously isolated, genet-ically diverged groups of closely related organisms provide opportunities for examining a variety of evolutionary pro-cesses, including amounts of genetic exchange between pop-ulations, selection against hybrids, and speciation. In most studies, however, hybrid zones have been investigated after a certain degree of reproductive isolation, such as reduced fitness or fertility of F1 hybrids, has developed (reviewed by Howard et al. 2003). Analysis of hybrid zones between well-diverged yet more or less interfertile lineages is neces-sary to explore the mechanisms and diversity of speciation, especially the amount of genetic incompatibility of distinct lineages and species.
A genetic transition zone in northeastern Greece and European Turkey among water frogs of the genus Pelophylax
(Beerli 1994; Sinsch and Eblenkamp 1994; Sofianidou et al. 1994) was first revealed by west–east differences in male advertisement calls (Schneider and Sinsch 1992; Schneider et al. 1993; personal observation). Based on their bioacoustic and electrophoretic data, Schneider et al. (1993) and Sinsch and Eblenkamp (1994) concluded that the transition zone occurs between 2 reproductively isolated species and that the 2 species are sympatric at the Nestos River, near the center of the transition zone.
We here report protein electrophoretic data and mito-chondrial DNA (mtDNA) sequence data for samples along this transition zone. We looked for coincidental distributions of differences in allele frequencies, which would confirm the presence of 2 species. We examined patterns of migration across the transition zone, looking for evidence of stability. Advance Access publication November 1, 2012
Low migration rates in the contact zone and other parts of the transect and increased numbers of homozygosities would indicate the presence of 2 distinct species. Simple neutral differentiation, in contrast, might result in either high or low rates of migration, depending on geography and local isolation.
Material and Methods
We use the name Pelophylax ridibundus (Pallas 1771) [TSN 775195; Integrated Taxonomic Information System on-line database, http://www.itis.gov] for most of the lake frogs in eastern Greece, even though bioacoustic data reported for Rana balcan-ica Schneider and Sinsch 1993 [TSN 776493], a junior synonym of Pelophylax kurtmuelleri (Gayda 1940) [TSN 775188], suggest that many of these frogs are P. kurtmuelleri. For Anatolian frogs of the P. ridibundus group, we use the name Pelophylax cf. bedria-gae; this includes frogs called Rana ridibunda by Schneider et al. (1993) or Rana bedriagae (Camerano 1882) [TSN 775178] by Schneider and Sinsch (2001).
Frogs for electrophoresis (283 individuals) were collected at 25 localities (Figure 1; Table 1); mtDNA sequence data are available for subsamples from 18 of these 112 individu-als. Frogs were collected over many years for different stud-ies; not all allozyme loci have been scored for all frogs. The samples chosen for mtDNA analysis were those that seemed most pertinent to the present study.
Protein electrophoresis used standard procedures (Hotz and Uzzell 1982; Beerli et al. 1996; Hotz et al. 1997). We examined products of 23 loci: aspartate aminotransferase (sAAT and mAAT, Enzyme Commission 2.6.1.1); aconitate hydratase (sACO and mACO, EC 4.2.1.3); adenosine deami-nase (ADA, EC 3.5.4.4); adenylate kideami-nase (AK-2, EC 2.7.4.3); albumin (ALB); creatine kinase (CK-A, EC 2.7.3.2); fruc-tose-1,6-diphosphatase (FDP-1 and FDP-2, EC 3.1.3.11); glyceraldehyde-3-phosphate dehydrogenase (GAPDH, EC 1.2.1.12); α-glycerophosphate dehydrogenase (αGDH, EC 1.1.1.8); glucose-6-phosphate isomerase (GPI, EC 5.3.1.9); isocitrate dehydrogenase (mIDH and sIDH, EC 1.1.1.42); l-lactate dehydrogenase (LDH-A and LDH-B, EC 1.1.1.27); malate dehydrogenase (mMDH and sMDH, EC 1.1.1.37); mannose-6-phosphate isomerase (MPI, EC 5.3.1.8); 6-phogluconate dehydrogenase (PGDH, EC 1.1.1.44); phos-phoglucomutase (PGM-2, EC 5.4.2.2, formerly 2.7.5.1); and superoxide dismutase (sSOD, EC 1.15.1.1). Alleles are named by lowercase letters in an established system (cf. Hotz and Uzzell 1982, Beerli 1994, Hotz et al. 1997 for designations).
Nucleotide sequences were determined for the mitochon-drial gene NADH dehydrogenase subunit 3 (ND3; 340 bp), using methods specified by Plötner et al. 2008. Sequences are stored in the EMBL database under accession numbers HE855736–HE855847. Relations among the sequences were examined with RAxML (Stamatakis et al. 2005).
Both allozyme and mtDNA data were analyzed using the program MIGRATE 3.1.7 (Beerli 2006; Beerli and Palczewski 2010). Eleven localities (5–10, 12–14, 16, 21) at which at least 3 ND3 sequences were available and the allozyme data were
judged sufficiently complete were chosen to look for poten-tial gene flow across the transect zone. Other localities were omitted for a variety of reasons: too little sequence data, too little allozyme data (too few individuals or too few loci for the available individuals), too far from the zone of genetic change. Localities 9 and 10, which are very close to each other in the same river drainage, were pooled into 1 population, as were localities 13 and 14. The geographic distances between the 9 resulting populations (localities 5, 6, 7, 8, pooled 9 and 10, 12, pooled 13 and 14, 16, and 21) were used to set the mutation-scaled migration rates to a consistent distance unit. To reduce the number of parameters, these 9 populations were analyzed using modified stepping stone migration mod-els (Figure 2). This resulted in a maximum of 17 parameters (1 population size parameter and 16 interpopulation migra-tion parameters).
MIGRATE was run using the Bayesian mode with a Metropolis-coupled heating scheme using 1 cold and 3 heated chains; each of 4 chains was run, after burn-in of 100 000 steps, for a total of 100 million steps per locus, dis-tributed on a 98-CPU computer cluster in 100 replicates, to estimate parameters. During the course of the run, roughly 50 million genealogies for each locus were visited, resulting in 1.15 billion genealogies for the allozyme data set and 50 million for the mtDNA data set. In contrast to the standard Metropolis–Hastings method applied to the genealogies, the parameters were estimated using slice sampling (Neal 2003), which typically delivers parameters that are less autocorre-lated than standard Metropolis–Hastings proposals.
Preliminary analyses revealed that our data sets do not have enough power to resolve the parameter values for all 72 possible migration connections and all 9 effective population sizes.
Multilocus allozyme data and mtDNA sequence data often yield multimodal posterior distributions with complex migration models resulting in parameter estimates that are inconsistent from run to run regardless of run-lengths; we have used these as indicators of failure to resolve parameters for complex models.
Nine different migration models that enforce particular biogeographic patterns were analyzed (Figure 2): I) individuals move randomly west or east through the transect; II) individuals move only to the west; III) individuals move only to the east; IV) individuals move to the center of the transect (towards localities 9 and 10) from both west and east; models V to VIII pool localities to the west of the transect center (6, 5, 7, 8, and 9) and localities to the east of the transect center (12, pooled 13 and 14, 16, 21); V) a stepping stone model with bidirectional migration; VI) migration only to the west; VII) migration only to the east; VIII) migration only to the central population (pooled 9 and 10); and IX) all localities form a single panmictic population.
These models were then compared using Bayes factors (Jeffreys 1961, Kass and Raftery 1995), which allow compar-ing and ordercompar-ing of nonnested models, such as ours, takcompar-ing into account the information content of the data and the complexity of the model. In addition, model probabilities (Bayes factor model weights; Kass and Raftery 1995) were
also calculated. These model probabilities are equivalent to Akaike weights (Burnham and Anderson 2002). Bayes factors and marginal likelihoods, in contrast to Akaike’s information criterion or Bayesian information criterion, depend on the distribution of the likelihoods and not only on the maximum likelihood.
Bayes factors are dependent on the accurate calculation of marginal likelihoods. In fact, we can consider the marginal likelihood as a relative Bayes factor. The calculation of mar-ginal likelihoods is difficult in standard Markov chain Monte Carlo (MCMC) programs. Currently, the best approaches depend on running multiple Markov chains at different tem-peratures and use “Thermodynamic integration” (or path sampling) to calculate an estimate of the marginal likelihood. This method was introduced by Gelman and Meng (1998). Thermodynamic integration has proved to be an accurate estimator of the marginal likelihood overcoming the poor performance of the widely used harmonic mean estima-tor. Lartillot and Philippe (2006) introduced the thermo-dynamic integration in phylogeny. Beerli and Palczewski (2010), Fan et al. (2011), and Xie et al. (2011) showed that the
thermodynamic integration estimator is delivering accurate estimates of the marginal likelihood that overcome the prob-lems of the harmonic mean estimator. Beerli and Palczewski (2010) implemented thermodynamic integration for com-parison of population genetics models in MIGRATE.
To look for the presence of 2 sympatric water frog species near the Nestos River, we examined the individual multilocus genotypes for 7 polymorphic loci for 33 frogs from 4 localities (Keramoti [8], Toxotai [9], Paradisos [10], Mangana [11]) in this region. For comparison, we also examined the individual multilocus genotypes for 6 polymorphic loci for 31 water frogs of 2 species from near Igoumenitsa in western Greece.
In addition, we also used the program Structurama 2.0 (Huelsenbeck and Andolfatto 2007) to assign individuals from the presumptive center of the cline (the locations Paradisos and Toxotai on the Nestos River). The prior distribution for the population numbers used was an exponential with mean of 1.0 (in the program this is equivalent to a gamma distribution with parameters a and b of 1.0 and 1.0). We ran the program for 10 000 000 steps. Multiple runs consistently delivered similar
Figure 1. Map of the collecting localities; numbers correspond to localities in Materials and Methods. At least partial allozyme data are available from each locality. Distribution of Pelophylax ridibundus and P. cf. bedriagae mtDNA in our samples is indicated.
results. Changing the parameters of the prior distribution (e.g., changing to a mean of 2.0) did not change the inferred assign-ment or inferred number of populations.
Results
Allele Frequency Analyses
Allele frequencies for 15 variable loci are presented in Table 2 and Appendix 1. Numbers of loci examined for each local-ity, together with the fraction polymorphic and the mean het-erozygosity, are included in Appendix 1. Four alleles are here newly designated. ADA a: This is the predominant allele in European frogs related to P. ridibundus. FDP-1 e: A rare allele
in P. ridibundus stock frogs from NE Greece. The mobility of its product on continuous tris–citrate gels is anodal of that of the predominant allele a. sIDH h: A widespread but rare allele in Anatolian frogs. The mobility of its product on continuous tris–citrate gels is anodal of that of the predominant allele b. LDH-B k: A rare allele in frogs of the P. ridibundus group in NW Anatolia. The mobility of its product on continuous tris–citrate gels is intermediate between that of the common alleles a and c of European frogs of the P. ridibundus group.
An overall west–east transition in allele frequencies is clearly evident, but there is considerable fluctuation, and not all loci show the same geographic location of major allele fre-quency changes (Appendix 1). Patterns for 4 loci with more complete data (αGDH, LDH-B, PGM-2, PGDH) are shown
Table 1 Origin and number (N) of individuals for which allozymes and mtDNA were investigated
No. Population Coordinates Location
N
Allozymes mtDNA Macedonia
01 Skopje-2 41.75°N/21.1°E Stream 15 km SE Skopje, SW of road 1 Skopje-Thessaloniki 41 0 02 Skopje-1 41.9°N/21.5°E Stream 10 km SE Skopje, at road 1 Skopje-Thessaloniki 25 0 03 Skopje-3 41.75°N/21.7°E Stream near Rzanicani, ca. 25 km S Skopje, at road to
Titov Veles 20 0
Greece
04 Gallikos 41.0°N/22.6°E Ponds near river Gallikos, plain N of Thessaloniki 24 0 05 Kymina 40.55°N/22.7°E Ditch near Kymina, N of highway Thessaloniki-Athinai
(W of intersection to Gevgelija) 7 5
06 Aliartos 38.37°N/23.10°E E Greece mainland N of Athinai. Channels in plain of river Kifisos (between Lamia and Athinai), near road E92, ca. 5 km NNE Aliartos
13 3
07 Ivira 40.9°N/23.6°E Stream near river Strymon, N of Ivira, ca. 70 km W of Kavala 7 5 08 Keramoti 40.9°N/24.4°E Stream near Keramoti, W of river Nestos delta 9 9 09 Toxotai 41.08°N/24.78°E Ditch ca. 1 km SW Toxotai, E of Nestos River 4 4 10 Paradisos 41.1°N/24.8°E River Nestos at road E55, ca. 14 km WSW Xanthi, 1 km E
Paradisos 13 12
11 Mangana 40.92°N/24.84°E Pond 2.8 km SW of Mangana, coastal plain E of river Nestos
delta 7 7
12 Pagouria 40.9°N/25.3°E Stream near Pagouria, between Alexandroupolis and Komotini 10 8
13 Lefkes 40.9°N/25.8°E Near Lefkes, WNW of Alexandroupolis 10 8
14 Monastiraki 40.85°N/26.10°E Stream near road E55 near Monastiraki, ca. 22 km ESE
Alexandroupolis 13 12
15 Dadia 41.14°N/26.28°E Ditch few km E of Dadia, 0.65 km W of road
Alexandroupolis-Orestias 9 9
Turkey
16 Ipsala 40.7°N/26.4°E Streams near Ipsala, near border between Turkey and Greece 11 9 17 Gelibolu 40.3°N/26.3°E Stream 1–2 km N Gelibolu, European side of Dardanelles 14 0 18 Umurbey 40.0°N/26.45°E River Umurbey:, Anatolian side of Dardanelles 16 0 19 Bayramdere 40.2°N/26.5°E Stream near Bayramdere, Anatolian side of Dardanelles 8 6 20 Igneada 41.88°N/27.94°E Stream at road 565, 3.3 km W Igneada, Black Sea coast 1 1 21 Kiyiköy 41.7°N/28.05°E Pool at road between Vize and Kıyiköy, near Black Sea coast 5 4 22 Bü Çekmece 41.0°N/28.6°E East shore of the lake Bü Çekmece Gölü, ca. 1 km N of Bü
Çekmece, 30 km W Istanbul 2 2
23 Ömerli 41.1°N/29.4°E Stream at road 20 near Ömerli, 35 km SW Sile, 34 km E
Istanbul 4 2
Bulgaria
24 Kazanlâk 42.4°N/25.3°E Pools in Tundza River plain S of Kazanlâk, ca. 30 km NW Stara
Zagora 6 6
25 Kamcija 43.2°N/27.9°E River Kamcija, region of Staro Orjachovo, ca. 30 km S Varna 4 0
in Figure 3. A 3-point moving average of the data reveals steep changes in allele frequencies for αGDH, LDH-B, and PGM-2 between Keramoti and Pagouria (Figure 1, localities 8–12), but the cline for PGDH is shifted to the west. There is no evidence of a gradient in number of polymorphic loci or mean heterozygosity across the transition zone, nor is a region of increased variability detectable (Appendix 1).
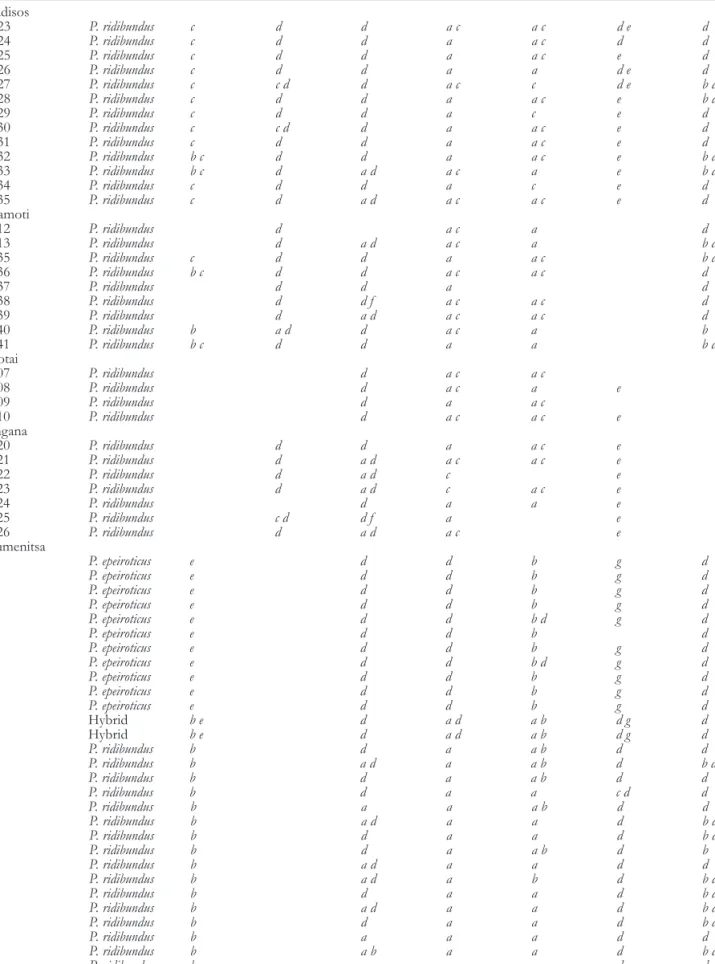
At the 4 localities near the Nestos River, there is no evi-dence of a significant association of alleles of the various loci in individuals (Table 2). In strong contrast, there is marked nonrandom association of alleles at the various loci in indi-viduals from Igoumenitsa, where sympatry of 2 distinct spe-cies is known. For example, each individual homozygous for the allele ALB e was also homozygous for the alleles GPI d, LDH-B d, PGDH g, and PGM-2 d and had the MPI alleles b or d. This group of individuals represents the species P. epei-roticus [TSN 775185]; the majority of the others are P. kurtmu-elleri. Two individuals were highly heterozygous and at each locus had 1 allele each of P. epeiroticus and of P. kurtmuelleri. These are interpreted as F1 hybrids between these 2 species.
An additional analysis of the multilocus data set of the population Paradisos/Toxotai using the program Structurama
2.0 (Huelsenbeck and Andolfatto 2007) assigned all individu-als to a single population. The most probable number of populations was also 1 (with probability 0.67); the probability of 2 populations was 0.27. These probabilities are dependent on the prior distribution and also depend on the size and variability of the data set. In contrast to sequence or micro-satellite data, allozyme data are not very variable, allowing considerable uncertainty in a population assignment.
mtDNA Haplotype Analysis
ND3 sequences for 112 individuals examined from 18 local-ities across the transect form 2 quite distinct, well-supported groups (Figure 4, bootstrap support 100%). One corres-ponds to European P. ridibundus/kurtmuelleri mtDNA group (Plötner et al. 2001, 2008); it was observed in almost all sam-ples from Greece and Bulgaria. The other group resembles ND3 sequences seen in the P. cf. bedriagae lineage from north-western Anatolia. In our samples, the 2 types differ by at least 16 bp (4.7%). The Anatolian type alone was found at 3 local-ities in European Turkey: Igneada (locality 20: 1 individual), Kiyiköy (21: 5), and Bü Çekmece (22: 2). The 2 types coexist
Figure 2. Comparison of migration models for allozyme and mtDNA data. Numbers by locality names correspond to those on the map (Figure 1); Paradisos and Toxotai (localities 9 and 10) are close to the Nestos River and the center of the transition zone. The models are described in Material and Methods. The numbers in the box represent model ranks based on Bayes factors calculated with MIGRATE (Beerli and Palczewski 2010); the log marginal likelihood values are tabulated in Supplementary Table 1.
at 3 localities in eastern Greece (Keramoti, Pagouria, and Monastiraki: localities 8, 12, and 14), the Anatolian type in lower frequencies (Monastiraki: 2 individuals, 17%; Pagouria: 1, 13%; Keramoti: 1, 11%). All other European localities contained only European P. ridibundus-type mtDNA. Only P. cf. bedriagae mtDNA was found at the Anatolian localities Ömerli (locality 23: 2 individuals) and Bayramdere (19: 6).
The 2 mtDNA types (European and Anatolian) are not associated with allozyme genotypes. For example, for the loci αGDH (with “western” allele a and “eastern” allele b) and LDH-B (with “western” allele a and “eastern” allele c; Appendix 1), the 2 individuals with Anatolian mtDNA from Monastiraki (locality 14) had, respectively, the genotypes a/b and a/a and c/c and a/c; the individual from Pagouria (12) had a/a and c/c; and the individual from Keramoti (8) had a/a and a/a. Likewise, at the localities in European Turkey where we found only Anatolian mtDNA (Igneada, Kiyiköy, Bü Çekmece; localities 20, 21, 22) both “eastern” and “west-ern” allozyme alleles occurred (Appendix 1).
There is minor variation within both P. ridibundus and P. cf. bedriagae mtDNA. No geographic pattern is obvious for the P. cf. bedriagae sequences, within which sequence divergences of 0–4 bp (0–1.2%) occur. There is, however, a west–east
gradient in the P. ridibundus sequences (cf., Figure 4): all individuals from 6 eastern localities (Pagouria, Lefkes, Monastiraki, Dadia, Ipsala, and Kazanlâk; localities 12–16, 24) and excepting the 2 frogs from Monastiraki (14) and 1 each from Keramoti (8) and from Pagouria (12) with P. cf. bedriagae mtDNA have ND3 sequence differences of 0–2 bp. (0–0.58%) from each other; frogs from the far west (Kymina and Aliartos; localities 5–6) have sequence differences of 0–4 bp (0–1.8%) from each other. ND3 sequences for these eastern and western localities differ by 3–7 bp (0.88–2.06%). Frogs from geographically intermediate localities, mostly near the Nestos River (Ivira, Keramoti, Toxotai, Paradisos, and Mangana; localities 7–11), fall into both groups. Three frogs from Mangana (locality 11), for example, have sequence dif-ferences of 0–1 bp (0–0.29%) from sequences from Kymina (5) and 1–3 bp (0.29–0.88%) from sequences from Aliartos (6), but differences of 2–4 bp (0.59–1.18%) from the eastern sequences. Three other frogs from Mangana have sequences that differ by 0–1 bp (0–0.29%) from sequences from the 6 eastern localities, but by 3–4 bp (0.89–1.18%) from sequences from Kymina and by 2–6 bp (0.59–1.76%) from sequences from Aliartos. Results for frogs from Toxotai, Keramoti, Paradisos, and Ivira are similar.
Figure 3. Frequency of alleles more common in western Greece at 5 allozyme loci along a transect from west to east in northeastern Greece and northwestern Turkey. Frequencies of 2 subtypes of P. ridibundus ND3 are also indicted. The lines are based on 3-point running averages.
Table 2 Individual genotypes at variable protein loci in water frogs from 4 localities of the Nestos River area and from a locality near Igoumenitsa (western Greece) where 2 water frog species are sympatric. Alleles are named with lowercase letters. To facilitate overview, homozygotes are indicated by single letters. Missing data are blank
Field number Taxon ALB GAPDH GPI LDH-B MPI PGDH PGM-2
Paradisos 12923 P. ridibundus c d d a c a c d e d 12924 P. ridibundus c d d a a c d d 12925 P. ridibundus c d d a a c e d 12926 P. ridibundus c d d a a d e d 12927 P. ridibundus c c d d a c c d e b d 12928 P. ridibundus c d d a a c e b d 12929 P. ridibundus c d d a c e d 12930 P. ridibundus c c d d a a c e d 12931 P. ridibundus c d d a a c e d 12932 P. ridibundus b c d d a a c e b d 12933 P. ridibundus b c d a d a c a e b d 12934 P. ridibundus c d d a c e d 12935 P. ridibundus c d a d a c a c e d Keramoti 17412 P. ridibundus d a c a d 17413 P. ridibundus d a d a c a b d 17435 P. ridibundus c d d a a c b d 17436 P. ridibundus b c d d a c a c d 17437 P. ridibundus d d a d 17438 P. ridibundus d d f a c a c d 17439 P. ridibundus d a d a c a c d 17440 P. ridibundus b a d d a c a b 17441 P. ridibundus b c d d a a b d Toxotai 22707 P. ridibundus d a c a c 22708 P. ridibundus d a c a e 22709 P. ridibundus d a a c 22710 P. ridibundus d a c a c e Mangana 22720 P. ridibundus d d a a c e 22721 P. ridibundus d a d a c a c e 22722 P. ridibundus d a d c e 22723 P. ridibundus d a d c a c e 22724 P. ridibundus d a a e 22725 P. ridibundus c d d f a e 22726 P. ridibundus d a d a c e Igoumenitsa 623 P. epeiroticus e d d b g d 632 P. epeiroticus e d d b g d 636 P. epeiroticus e d d b g d 638 P. epeiroticus e d d b g d 642 P. epeiroticus e d d b d g d 645 P. epeiroticus e d d b d 646 P. epeiroticus e d d b g d 649 P. epeiroticus e d d b d g d 650 P. epeiroticus e d d b g d 651 P. epeiroticus e d d b g d 652 P. epeiroticus e d d b g d 626 Hybrid b e d a d a b d g d 641 Hybrid b e d a d a b d g d 624 P. ridibundus b d a a b d d 625 P. ridibundus b a d a a b d b d 627 P. ridibundus b d a a b d d 628 P. ridibundus b d a a c d d 629 P. ridibundus b a a a b d d 630 P. ridibundus b a d a a d b d 631 P. ridibundus b d a a d b d 633 P. ridibundus b d a a b d b 634 P. ridibundus b a d a a d d 635 P. ridibundus b a d a b d b d 637 P. ridibundus b d a a d b d 639 P. ridibundus b a d a a d b d 640 P. ridibundus b d a a d b d 643 P. ridibundus b a a a d d 644 P. ridibundus b a b a a d b d 647 P. ridibundus b a a a d d 648 P. ridibundus b b d a a d d 653 P. ridibundus b a b a a b d d
There are thus “eastern” and “western” ridibundus-like ND3 sequences in the transect area, but just as for the European and Anatolian mtDNA groups, there is no significant asso-ciation of “eastern” ridibundus-like ND3 sequences with “east-ern” allozyme alleles, nor is there any association of “west“east-ern” ridibundus-like ND3 sequences with “western” allozyme alleles. Population Model Comparison
For the mtDNA data, the estimated mutation-scaled effect-ive population size is 0.002, and the magnitude of the muta-tion-scaled migration rates is high, when using a modified
stepping stone model (Figure 2). Multiplying the mutation-scaled effective population size with the mutation-mutation-scaled immigration results in high number of effective immigrants per generation, suggesting that the number of immigrants for each of the populations is much larger than 1 per gen-eration and that the transect localities form a panmictic unit. Indeed, the model comparison (Figure 2; see Supplementary Table 1 online) favors model IX (all localities form a pan-mictic population) over the other models tested. Using Bayes factor weights (Kass and Raftery 1995) to calculate the model probability, models I–VIII have near zero probability, whereas IX has a probability of 1.0.
Figure 4. RAxML tree based on unique mitochondrial ND3 sequences of water frogs across a genetic transition in northern Greece and European Turkey. Tree rooted at midpoint. Sequences are identified by numbers corresponding to the 18 localities with mtDNA data; these are given in Materials and Methods and correspond to those of Figure 1. Number of individuals with a given sequence provided in parentheses if greater than 1.
For the allozyme data, the 9 migration models tested (Figure 2) had very different log marginal likelihoods. These allow an unequivocal ordering of the models and choice of the best model among those tested (Figure 2; see Supplementary Table 1 online). Model VIII, in which migrants move toward the Nestos River from both east and west, has much greater support than any other model tested. Models VII and IX have probabilities close to zero, whereas model VIII has a probability of 1.0.
The best model (VIII) treats locations to the east and to the west of the Nestos River as single panmictic popula-tions, and so does not allow us to investigate potential isola-tions among western and among eastern locaisola-tions. The best 9-population model (IV), which might allow investigation of more local isolation, estimated the mutation-scaled migration rates between all neighboring locations to be of the same magnitude (between 200 and 450), thus indicating no geo-graphic barrier between any of the sampling locations.
Discussion
Geographic Patterns of Molecular Markers
Our allozyme data reveal an overall east–west transition in allele frequencies, generally with change most rapid near the Nestos River in the central part of the transition zone. There is, however, considerable variability in regions of maximal change (Figure 3; Appendix 1), and alternative alleles for many of these loci are observed both to the west and to the east of the Nestos River (Appendix 1). There is no apparent association of particular alleles in multilocus genotypes for individuals from near the Nestos River (Table 2). Frequencies of polymorphic alleles, obtained from 3 of our samples (localities 6, 10, and 14; the last 2 near the Nestos River), could not be shown to depart from Hardy–Weinberg equilib-rium; there is no significant association of alleles at individual loci within individuals (Beerli 1994). These findings of ran-dom association of alleles into genotypes in the Nestos River region are corroborated by Structurama’s assignment of all individuals from Paradisos and Toxotai to a single rather than 2 populations. This also suggests that they are members of a randomly mating, panmictic population.
There is extensive variation in ND3 sequences along the transect zone and we observed 2 major groups of sequences, 1 characteristic of northwest Anatolian P. cf. bedriagae, the other characteristic of Central European P. ridibundus. Sympatry of these 2 mitochondrial haplotypes occurs in the eastern part of the transect (Figure 1) although the Anatolian type is apparently scarce and spotty in the transition zone. It also occurs at Edirne in western European Turkey (Akın et al. 2010), where 1 individual among 5 had the Anatolian haplo-type. Lymberakis et al. (2007), utilizing partial cytochrome b and 16S rRNA mtDNA sequences, reported 2 quite differ-ent sequence types from Dadia in eastern Greece, a single individual of each. One of these sequences is nested deeply within their P. ridibundus–P. kurtmuelleri group, whereas the sequence from the other individual is nested deeply within their P. bedriagae group. We detected only the ridibundus type
in our sample of 9 individuals from near Dadia. This broad geographic overlap of the Anatolian and European ND3 haplotypes does not support the existence of 2 biological species of Pelophylax, sympatric in the Nestos River region, especially because there is no marked association of these 2 mitochondrial types with allozyme alleles, either across the area of sympatry or near the Nestos River.
The frequency of the 2 different subgroups of P. ridibun-dus ND3 sequences also changes along the transect between western and eastern ends, with the center of change near the Nestos River, where both subgroups occur in nearly equal frequencies. This pattern resembles that for several allozyme loci (Figure 3; Appendix 1). Again, however, there is no noticeable association of these subgroup sequences with allozyme alleles. ND3 sequences corresponding to these 2 subgroups also occur in northern and Central Europe, where they are intermixed with no geographic patterning (Plötner et al. 2008).
One Species or Two?
Bioacoustic data collected by Schneider and Sinsch (1992) and Schneider et al. (1993) and allozyme data collected by Sofianidou et al. (1994) and Sinsch and Eblenkamp (1994) were interpreted as demonstrating that 2 largely allopat-ric species are present in a transition zone in northeastern Greece, with an area of sympatry in the Nestos River region. Male advertisement calls of frogs from the western end of the transition zone were ascribed to R. balcanica (a junior synonym of P. kurtmuelleri), whereas calls from frogs from the eastern end were ascribed to P. ridibundus (Schneider and Sinsch 1992; Schneider et al. 1993). An area of sympatry in the Nestos River region was identified based on analysis of 18 mating call series recorded at Toxotes and Neo Erasmio. These calls collectively did not match calls recorded either west or east of the Nestos area; but a discriminant analysis assigned calls of 10 series to R. balcanica (=P. kurtmuelleri) and calls of 8 series to R. ridibunda (=P. cf. bedriagae). Probably this, more than their allozyme data, convinced them that there are 2 sympatric species in the Nestos River region. Regardless, the ways in which parameters of advertisement calls of frogs from the eastern end of the zone deviate from parameters of calls of western frogs make the eastern frog calls more like calls characterizing western Anatolian frogs, P. cf. bedriagae (Joermann et al. 1988; Haefeli 2005).
Two allozyme loci that were reportedly diagnostic of the 2 taxa in the transition zone (ADA, Sofianidou et al. 1994; GPI, Sinsch and Eblenkamp 1994) clearly are not so in our data set. In our data, ADA is monomorphic for all of the 98 frogs scored from 14 localities (19 frogs from 3 localities in the Nestos River region, 17 from 3 localities west of it, 62 from 8 localities east of it). ADA, thus, cannot be used to distinguish 2 species. GPI is, in contrast, polymorphic in our data set (Appendix 1). One allele (b) is very rare, occurring as a heterozygote in 1 individual from near Skopje; another (f) is uncommon. Of the 2 more common alleles, a (which prob-ably corresponds to allele 33 of Sinsch and Eblenkamp 1994) occurs, although often infrequently, in many of the western
populations, whereas d (which probably corresponds to Sinsch and Eblenkamp’s allele 100) is more common in east-ern populations. In our data, however (Appendix 1), these 2 alleles do not distinguish 2 species. Similar variability was in fact observed in “GPI-1” by Sinsch and Eblenkamp (1994). Only their allele 100 occurred in P. ridibundus from Valtos and from the Nestos River (Neo Erasmio), but their R. balcanica (=P. kurtmuelleri) sample from near the Axios River (Gefyra) had both alleles 100 (60%) and 33 (40%).
It is clear that our allozyme data and ND3 sequence data do not support the idea of 2 reproductively isolated species of Pelophylax across the transect zone, with sympatry near the Nestos River; our evidence that there is random asso-ciation of allozyme alleles with each other or with ND3 haplotypes suggests that interbreeding among the water frogs in this region is random. This is also suggested by the Structurama results. Schneider et al.’s (1993) analysis of calls of frogs recorded near the Nestos River possibly suggests that the change between voice types in the transition zone is more abrupt than it is for ND3 sequences and allozyme allele frequencies and possibly convinced them that there are 2 sympatric species in the Nestos River region. It is difficult, however, to see how such a situation could persist, given the random mating among frogs near the Nestos River.
Patterns of Migration across the Transect
MIGRATE analysis of the allozyme data indicates an influx of genetic material into the center of the transition zone from both east and west. The estimated magnitudes of gene flow into the center of the zone are similar, suggesting that the cline is either fixed at its current location or only moving slowly. The migration rates among sample locations are high, but, in contrast to the mtDNA data set, a panmictic single-population model is not favored. The best model among those tested pools all locations east and all locations west of the center of the cline (Nestos River) so that only 3 popula-tions are considered in the MIGRATE analysis. Among these 3-population models (Figure 2, models V–VIII), the model with migration rates toward the center of the cline (Model VIII) is strongly favored with a probability of 1.0, again using all 9 tested models as a basis.
Analysis of the ND3 sequences strongly suggests that mitochondrial transmission is not reduced across the transect and that there is little or no difference between the localities from the east or the west in this respect. Comparison of sev-eral models reveals that a model that treats all localities in the MIGRATE transect mtDNA data set as a single panmictic population has by far the highest marginal likelihood and its model probability is 1.0 using all the 9 tested models as a basis for comparison.
The migration patterns of mtDNA and nuclear markers are contradictory: the former indicates either different disper-sal rates of females or else a selective sweep of a particular mtDNA variant (Smith and Haigh 1974), whereas the pattern of the nuclear markers may suggest that selection in the hybrid zone is acting to enforce the cline. We do not have data to show that the cline is fixed by reduced fitness of individuals in the
hybrid zone; that our samples from localities 6, 10, and 14 do not depart from Hardy–Weinberg equilibrium indicates that there is little selection on particular allelic combinations and little reduction in fitness. For a moving cline we would expect that the gene flow pattern would indicate migration from 1 end toward the center in the direction of cline movement, but on the other side of the cline we would expect migration pat-terns in all directions or at least a pattern that does not show increased migration toward the center of the cline.
The most recent common ancestor (MRCA) of a sin-gle population for nuclear genes occurred roughly 4 times the effective population size (4Ne) generations in the past, whereas the time of the MRCA for mitochondria occurred about Ne generations in the past (Palumbi et al. 2001). The frogs that we observe today probably are descendents of frog populations that were separated during the last glacial period but could potentially have remixed during the last 10 000 years. With a generation time of about 2 to 3 years (Günther 1990; Plötner 2001), this represents about 5000 gen-erations. Effective frog populations sizes (Ne) of a few thou-sand individuals are not unreasonable. For nuclear markers, an Ne larger than 1250 might allow the MRCA to have occurred more than 10 000 years ago, thus allowing the isolation signa-ture to persist; whereas for the mtDNA marker, an Ne larger than 5000 would be required for the signature of isolation to persist. Additional mtDNA and multilocus nuclear DNA data may shed light on the contradiction among the population models, but ultimately evaluation of fitness parameters along the transect will be required to resolve the puzzle.
A potential separation into a western (southern Greece) and an eastern refugium (Black Sea coast or Anatolia) during the last glaciation perhaps allowed changes of allele frequen-cies in these refugia. After the cold period, the populations expanded east and west and met in the region of the Nestos River where we see the admixed populations. The separation obviously did not lead to reproductive isolation as the dif-ferent refugial types seem to mix without problems. These expansion routes probably are reflected in the model rank-ing for the allozyme data, which suggest that a model with movement toward the Nestos River should be preferred over all other models.
The transition zone in eastern Greece discussed here dif-fers from the transition zone detected in Italian water frogs in Calabria (Santucci et al. 1996) in having greater breadth and a lower geographic concordance of allele frequencies among the various loci. The transition in Calabria more resembles classical tension zones such as that between Bombina bombina and Bombina variegata (Szymura 1983; Szymura et al. 1985; Szymura and Barton 1986, 1991; Fijarczyk et al. 2011). The transition zone in eastern Greece, in contrast, is more simi-lar to the transition zone along the Adriatic coast of Italy, which is also long (from coastal central Italy to the south-ern Po valley) and differs across loci in the location of allele frequency changes (Uzzell and Hotz 1979; Hotz 1983, unpublished data).
In summary, our data on both allozymes and mtDNA sequences demonstrate that, rather than there being 2 repro-ductively isolated species of water frogs sympatric near the
Nestos River, there is a broad zone of hybridization across Greece and Turkey north of the Aegean Sea between 2 genetically distinct stocks. Our data also show that there is widespread introgression of previously diverged northwest-ern Anatolian mtDNA lineages into water frog populations of European Turkey and easternmost Greece. This intro-gression is consistent with the broad east–west trends in both allozyme allele frequencies and ND3 haplotypes across northeastern Greece, with a region of more rapid change near the Nestos River.
Supplementary Material
Supplementary material can be found at http://www.jhered. oxfordjournals.org/.
Funding
U.S. National Science Foundation (BSR 86-14881, DEB 0822626, DEB 1145999); Swiss National Fund (37579.93, 31-59144.99, 31-103903/1); Deutsche Forschungsgemeinschaft (213/3-1, 3-2, 3-3); National Institutes of Health through the joint National Science/National Institutes of General Medical Studies’ Mathematical Biology program (R01 GM 078985).
Acknowledgments
We thank Pasqualina Kyriakopoulou-Sklavounou and Markus Wyss for providing us with frogs they collected. Çiğdem Akın (Ankara) provided sequences for two frogs from Edirne, Turkey. Kai-Joachim Schultze (Berlin) provided technical assistance. We acknowledge the use of Florida State University shared High-Performance Computing facility for calculating the Bayes factor analyses.
N o. Locality N sAA T sA CO mA CO ALB FDP-1 FDP-2 n c e f l n b c n a b n b c d n a b d e n a b 1 Sk opje-2 41 41 0.04 0.94 0.02 — 0 0 23 0.67 0.30 0.02 0 — 0 2 Sk opje-1 25 25 0.02 0.98 — — 0 0 6 0.42 0.58 — 0 — 0 3 Sk opje-3 20 20 — 1.00 — — 0 0 20 0.58 0.43 — 0 — 0 4 Gallik os 24 24 — 0.94 — 0.06 0 0 11 0.05 0.59 0.36 0 — 0 5 K ymina 7 0 0 0 4 0.75 0.25 — 1 1.00 — — — 0 6 Aliar tos 13 13 — 0.96 0.04 — 13 0.96 0.04 13 — 1.00 11 — 1.00 — 13 0.88 0.08 0.04 — 13 0.04 0.96 7 Ivira 7 0 0 0 6 0.50 0.42 0.08 0 — 0 8 K eramoti 9 7 — 1.00 — — 5 1.00 — 5 — 1.00 4 0.50 0.50 — 3 1.00 — — — 2 — 1.00 9 To xotai 4 0 0 0 0 4 1.00 — — — 0 10 Paradisos 13 11 — 1.00 — — 13 1.00 — 6 0.17 0.83 13 0.08 0.92 — 10 1.00 — — — 13 — 1.00 11 Mang ana 7 0 0 0 0 7 0.93 — — 0.07 0 12 Pag ouria 10 10 — 1.00 — — 10 1.00 — 5 — 1.00 6 0.83 0.17 — 9 0.94 0.06 — — 0 13 Lef kes 10 2 — 1.00 — — 10 1.00 — 0 1 1.00 — — 9 1.00 — — — 0 14 Monastiraki 13 11 — 0.95 0.05 — 13 0.96 0.04 13 0.88 0.12 12 0.13 0.88 — 5 1.00 — — — 13 — 1.00 15 Dadia 9 0 0 0 0 9 1.00 — — — 0 16 Ipsala 11 6 — 1.00 — — 11 1.00 — 1 1.00 — 0 7 1.00 — — — 0 17 Gelibolu 14 2 — 1.00 — — 0 0 0 3 1.00 — — — 0 18 Um urbey 16 1 — 1.00 — — 0 0 0 0 — 0 19 Ba yramdere 8 0 8 1.00 — 1 — 1.00 0 4 1.00 — — — 0 — 1.00 20 Igneada 1 0 0 0 0 0 — 0 21 Kiyik öy 5 0 0 0 5 — 1.00 — 0 — 0 22 Bü Çekmece 2 0 0 0 1 0.50 0.50 — 0 — 0 23 Ömerli 4 0 0 0 0 0 — 4 — 1.00 24 K azanlâk 6 0 0 0 6 — 1.00 — 6 1.00 — — — 0 25 K amcija 4 0 2 1.00 — 2 1.00 — 2 — 1.00 — 3 1.00 — — — 0 Appendix 1
Allele frequencies for 15 v
ariable protein-coding loci in the g
enetic tran
sition zone
. T
he localities are basically listed from w
est to east.
N
: total sample size;
n: n
umber of
indi
viduals scored per locus
. Alleles are named with lo
w
ercase letters
. Eight additional loci w
ere in
variant in these samples (mAA
T b, AD A a, AK-2 a, CK-A b, mIDH b, sMDH b, mMDH a, sSOD
a); they are omitted from the table but are included in fraction of
polymor
phic loci and mean heterozyg
osity
. T
he localities are k
eyed to the map (
Figure
1
) b
y n
N o. Locality N GAPDH α GDH GPI sIDH LDH-A LDH-B n c d n a b n a b d f n b h n a b n a c k 1 Sk opje-2 41 0 41 1.00 — 41 0.43 0.01 0.55 0.01 41 1.00 — 41 1.00 — 41 0.99 0.01 — 2 Sk opje-1 25 0 25 1.00 — 25 0.38 — 0.60 0.02 25 1.00 — 25 0.98 0.02 25 1.00 — — 3 Sk opje-3 20 0 20 1.00 — 20 0.43 — 0.53 0.05 0 0 20 1.00 — — 4 Gallik os 24 0 24 1.00 — 24 0.13 — 0.88 — 19 1.00 — 24 1.00 — 23 0.98 0.02 — 5 K ymina 7 6 — 1.00 7 1.00 — 7 0.14 — 0.86 — 7 1.00 — 7 1.00 — 7 1.00 — — 6 Aliar tos 13 8 — 1.00 13 1.00 — 13 0.08 — 0.92 — 13 1.00 — 5 0.90 0.10 13 1.00 — — 7 Ivira 7 5 — 1.00 7 1.00 — 5 0.10 — 0.90 — 7 1.00 — 6 1.00 — 7 1.00 — — 8 K eramoti 9 9 0.06 0.94 7 1.00 — 8 0.13 — 0.81 0.06 8 1.00 — 8 1.00 — 9 0.67 0.33 — 9 To xotai 4 1 — 1.00 4 1.00 — 4 — — 1.00 — 4 1.00 — 4 1.00 — 4 0.63 0.38 — 10 Paradisos 13 13 0.08 0.92 13 1.00 — 13 0.08 — 0.92 — 13 1.00 — 13 1.00 — 13 0.85 0.15 — 11 Mang ana 7 6 0.08 0.92 6 1.00 — 6 0.33 — 0.67 7 1.00 — 7 1.00 — 7 0.57 0.43 — 12 Pag ouria 10 7 0.21 0.79 10 0.70 0.30 7 0.07 — 0.93 — 10 1.00 — 10 1.00 — 10 0.20 0.80 — 13 Lef kes 10 7 0.07 0.93 10 0.70 0.30 7 0.07 — 0.93 — 10 1.00 — 10 1.00 — 10 0.25 0.75 — 14 Monastiraki 13 9 0.28 0.72 13 0.85 0.15 13 — — 1.00 — 13 1.00 — 13 1.00 — 13 0.31 0.69 — 15 Dadia 9 9 0.06 0.94 9 0.94 0.06 6 — — 0.92 0.08 9 1.00 — 9 1.00 — 6 0.25 0.75 — 16 Ipsala 11 3 — 1.00 11 0.68 0.32 9 — — 1.00 — 11 1.00 — 11 1.00 — 11 0.14 0.86 — 17 Gelibolu 14 0 3 0.17 0.83 12 0.04 — 0.92 0.04 2 1.00 — 2 1.00 — 14 0.21 0.79 — 18 Um urbey 16 0 1 1.00 — 15 — — 1.00 — 1 1.00 — 1 1.00 — 16 0.22 0.72 0.06 19 Ba yramdere 8 8 0.31 0.69 8 0.56 0.44 5 — — 1.00 — 8 0.94 0.06 8 1.00 — 8 0.06 0.94 — 20 Igneada 1 0 0 1 — — 1.00 — 0 1 1.00 — 1 — 1.00 — 21 Kiyik öy 5 0 5 0.50 0.50 4 — — 1.00 — 5 1.00 — 5 1.00 — 5 0.20 0.80 — 22 Bü Çekmece 2 0 2 0.25 0.75 0 0 2 1.00 — 2 — 1.00 — 23 Ömerli 4 3 — 1.00 2 0.50 0.50 1 0.50 — 0.50 — 0 4 1.00 — 4 — 1.00 — 24 K azanlâk 6 6 0.08 0.92 6 0.75 0.25 6 0.25 — 0.75 — 6 1.00 — 6 1.00 — 6 0.58 0.42 — 25 K amcija 4 1 1.00 — 4 0.38 0.63 2 — — 1.00 — 4 1.00 — 4 1.00 — 4 0.38 0.63 — Appendix 1 (Contin ued)
N o. Locality N MPI PGDH PGM-2 N Loci Fraction pol ymorphic Mean obser ved heter ozyg osity n a b c n c d e n a b d g 1 Sk opje-2 41 41 0.77 — 0.23 41 0.02 0.93 0.05 41 — 0.15 0.85 — 17 0.412 0.108 2 Sk opje-1 25 25 0.84 0.04 0.12 25 0.04 0.92 0.04 25 — 0.14 0.86 — 17 0.412 0.101 3 Sk opje-3 20 0 0 20 — 0.08 0.93 — 9 0.333 0.139 4 Gallik os 24 24 0.85 — 0.15 0 24 — 0.08 0.90 0.02 15 0.400 0.087 5 K ymina 7 6 0.83 — 0.17 7 — 1.00 — 7 — — 1.00 — 17 0.176 0.053 6 Aliar tos 13 13 1.00 — — 11 — 1.00 — 13 — — 1.00 — 22 0.273 0.039 7 Ivira 7 7 0.71 — 0.29 7 — 0.14 0.86 7 — 0.07 0.93 — 17 0.235 0.114 8 K eramoti 9 8 0.75 — 0.25 0 9 — 0.28 0.72 — 22 0.273 0.129 9 To xotai 4 4 0.63 — 0.38 2 — — 1.00 0 13 0.154 0.128 10 Paradisos 13 13 0.50 — 0.50 13 — 0.19 0.81 13 — 0.15 0.85 — 21 0.381 0.102 11 Mang ana 7 4 0.63 — 0.38 7 — — 1.00 0 13 0.385 0.128 12 Pag ouria 10 10 0.55 — 0.45 10 — 0.20 0.80 10 — 0.60 0.40 — 22 0.409 0.140 13 Lef kes 10 10 0.45 — 0.55 10 — — 1.00 10 — 0.75 0.25 — 21 0.286 0.108 14 Monastiraki 13 13 0.69 — 0.31 12 — 0.08 0.92 13 — 0.77 0.23 — 20 0.500 0.133 15 Dadia 9 9 0.67 — 0.33 9 — — 1.00 0 13 0.385 0.109 16 Ipsala 11 11 0.68 0.05 0.27 11 — — 1.00 11 — 0.64 0.36 — 21 0.190 0.098 17 Gelibolu 14 14 0.93 — 0.07 2 — — 1.00 14 0.04 0.89 0.07 — 19 0.263 0.140 18 Um urbey 16 16 0.88 — 0.13 1 — — 1.00 16 — 0.81 0.19 — 15 0.200 0.243 19 Ba yramdere 8 7 0.93 — 0.07 8 — — 1.00 8 — 1.00 — — 20 0.250 0.076 20 Igneada 1 1 1.00 — — 0 0 6 0 0 21 Kiyik öy 5 5 0.50 — 0.50 5 — — 1.00 5 0.10 0.70 0.20 — 16 0.250 0.127 22 Bü Çekmece 2 2 1.00 — — 0 2 — 0.50 0.50 — 10 0.300 0.211 23 Ömerli 4 4 0.88 — 0.12 0 4 — 0.63 0.38 — 12 0.333 0.119 24 K azanlâk 6 6 0.25 — 0.75 6 — — 1.00 6 — 0.58 0.42 — 18 0.250 0.139 25 K amcija 4 4 0.50 — 0.50 4 — — 1.00 4 — 0.75 0.25 — 20 0.167 0.121 Appendix 1 (Contin ued)
References
Akın C, Bilgin CC, Beerli P, Westaway R, Ohst T, Litvinchuk SN, Uzzell T, Bilgin M, Hotz H, Guex GD, et al. 2010. Phylogeographic patterns of
gen-etic diversity in eastern Mediterranean water frogs have been determined by geological processes and climate change in the Late Cenozoic. J Biogeogr. 37:2111–2124.
Beerli P. 1994. Genetic isolation and calibration of an average protein clock in western Palearctic water frogs of the Aegean region. PhD Dissertation Universität Zürich, 91pp.
Beerli P. 2006. Comparison of Bayesian and maximum-likelihood inference of population genetic parameters. Bioinformatics. 22:341–345.
Beerli P, Palczewski M. 2010. Unified framework to evaluate panmixia and migration direction among multiple sampling locations. Genetics. 185:313–326.
Beerli P, Hotz H, Uzzell T. 1996. Geologically dated sea barriers calibrate a protein clock for Aegean water frogs. Evolution. 50:1676–1687.
Burnham KP, Anderson DR. 2002. Model selection and multimodel inference: a practical information-theoretic approach. 2nd ed. New York: Springer.
Fan Y, Wu R, Chen MH, Kuo L, Lewis PO. 2011. Choosing among partition models in Bayesian phylogenetics. Mol Biol Evol. 28:523–532.
Fijarczyk A, Nadachowska K, Hofman S, Litvinchuk SN, Babik W, Stuglik M, Gollmann G, Choleva L, Cogălniceanu D, Vukov T, et al. 2011. Nuclear
and mitochondrial phylogeography of the European fire-bellied toads
Bombina bombina and Bombina variegata supports their independent histories.
Mol Ecol. 20:3381–3398.
Gelman A, Meng X-L. 1998. Simulating normalizing constants: from import-ance sampling to bridge sampling to path sampling. Stat Sci 13:163–185. Günther R. 1990. Die wasserfrösche Europas. Wittenberg Lutherstadt (Germany): Die Neue Brehm Bücherei, A. Ziemsen Verlag.
Haefeli C. 2005. Variation in advertisement calls among geographically iso-lated water frogs. Diploma Thesis Universität Zürich.
Hotz H. 1983. Genetic diversity among water frog genomes inherited with and without recombination. PhD Dissertation Universität Zürich, 136 p. Hotz H, Uzzell T. 1982. Biochemically detected sympatry of two water frog species: two different cases in the Adriatic Balkans (Amphibia, Ranidae). Proc Acad Nat Sci Philadelphia. 134:50–79.
Hotz H, Uzzell T, Berger L. 1997. Linkage groups of protein-coding genes in western palearctic water frogs reveal extensive evolutionary conservation. Genetics. 147:255–270.
Howard DJ, Britch SC, Braswell WE, Marshall JL. 2003. Evolution in hybrid zones. In: Singh RK, Uyenoyama MK, editors. The evolution of population biology. Cambridge (UK): Cambridge University Press. p. 297–314. Huelsenbeck JP, Andolfatto P. 2007. Inference of population structure under a Dirichlet process model. Genetics. 175:1787–1802.
Jeffreys H. 1961. The theory of probability, 3rd ed. New York: Oxford University Press.
Joermann G, Baran I, Schneider H. 1988. The mating call of Rana ridibunda
(Amphibia: Anura) in western Turkey: bioacoustic analysis and taxonomic consequences. Zool Anz. 220:225–232.
Kass RE, Raftery AE. 1995. Bayes factors. J Am Stat Assoc. 90:773–795. Lartillot N, Philippe H. 2006. Computing Bayes factors using thermo-dynamic integration. Syst Biol. 55:195–207.
Lymberakis P, Poulakakis N, Manthalou G, Tsigenopoulos CS, Magoulas A, Mylonas M. 2007. Mitochondrial phylogeography of Rana (Pelophylax) popu-lations in the Eastern Mediterranean region. Mol Phylogenet Evol. 44:115–125.
Neal R. 2003. Slice sampling. Ann Stat. 3:705–767.
Palumbi SR, Cipriano F, Hare MP. 2001. Predicting nuclear gene coalescence from mitochondrial data: the three-times rule. Evolution. 55:859–868. Plötner J. 2001. Struktur und dynamik einer seefrosch/teichfrosch-männchen-population (Rana ridibunda, Rana esculenta) in der Oderaue bei
Frankfurt/Oder. Zeitschrift für Feldherpetologie. 8:253–264.
Plötner J, Ohst T, Böhme W, Schreiber R. 2001. Divergence in mitochondrial DNA of Near Eastern water frogs with special reference to the systematic status of Cypriote and Anatolian populations (Anura, Ranidae). Amphibia-Reptilia. 22:397–412.
Plötner J, Uzzell T, Beerli P, Spolsky C, Ohst T, Litvinchuk SN, Guex GD, Reyer HU, Hotz H. 2008. Widespread unidirectional transfer of mitochon-drial DNA: a case in western Palaearctic water frogs. J Evol Biol. 21:668–681. Santucci F, Nascetti G, Bullini L. 1996. Hybrid zones between two genetic-ally differentiated forms of the pond frog Rana lessonae in southern Italy. J
Evol Biol. 9:429–450.
Schneider H, Sinsch U. 1992. Mating call variation in lake frogs referred to as Rana ridibunda Pallas, 1771. Taxonomic implications. Z Zool Syst Evol
Forsch. 30:297–315.
Schneider H, Sinsch U. 2001. New bioacustic records of Rana bedriagae
Camerano, 1882 (Anura: Ranidae) from Turkey. Bonn Zool Beitr. 50:35–48. Schneider H, Sinsch U, Sofianidou TS. 1993. The water frogs of Greece. Bioacoustic evidence for a new species. Z Zool Syst Evol Forsch. 31:47–63.. Sinsch U, Eblenkamp B. 1994. Allozyme variation among Rana balcanica, R. levan-tina, and R. ridibunda (Amphibia: Anura). Z Zool Syst Evol Forsch. 32:35–43.
Smith JM, Haigh J. 1974. The hitch-hiking effect of a favourable gene. Genet Res. 23:23–35.
Sofianidou TS, Schneider H, Sinsch U. 1994. Comparative electrophoretic investigation on Rana balcanica and Rana ridibunda from northern Greece.
Alytes 12:93–108.
Stamatakis A, Ludwig T, Meier H. 2005. RAxML-III: a fast program for max-imum likelihood-based inference of large phylogenetic trees. Bioinformatics. 21:456–463.
Szymura JM. 1983. Genetic differentiation between hybridizing species
Bombina bombina and Bombina variegata (Salientia, Discoglossidae) in Poland.
Amphibia-Reptilia. 4:137–145.
Szymura JM, Barton NH. 1986. Genetic analysis of a hybrid zone between the fire-bellied toads, Bombina bombina and B. variegata, near Cracow in
south-ern Poland. Evolution. 40:1141–1159.
Szymura JM, Barton NH. 1991. The genetic structure of the hybrid zone between the fire-bellied toads Bombina bombina and B. variegata: comparisons
between transects and between loci. Evolution. 45:237–261.
Szymura JM, Spolsky C, Uzzell T. 1985. Concordant change in mitochon-drial and nuclear genes in a hybrid zone between two frog species (genus
Bombina). Experientia. 41:1469–1470.
Uzzell T, Hotz H. 1979. Electrophoretic and morphological evidence for two forms of green frogs (Rana esculenta complex) in peninsular Italy
(Amphibia, Salientia). Mitt Zool Mus Berlin. 55:13–27.
Xie W, Lewis PO, Fan Y, Kuo L, Chen MH. 2011. Improving marginal likelihood estimation for Bayesian phylogenetic model selection. Syst Biol. 60:150–160.
Received February 26, 2012; Revised July 8, 2012; Accepted August 15, 2012