Adequacy of child anthropometric indicators for measuring
nutritional stress at population level: a study from
Niakhar, Senegal
Michel Garenne
1, Bernard Maire
2, Olivier Fontaine
3and Andre´ Briend
4,*
1IRD, UMI Re´siliences and Institut Pasteur, Epide´miologie des Maladies Emergentes, Paris, France:2IRD, UMR
Nutripass, Montpellier, France:3IRD and World Health Organization, Geneva, Switzerland:4Department of International Health, University of Tampere Medical School, FIN-33014, Tampere, Finland
Submitted 22 February 2012: Final revision received 23 August 2012: Accepted 3 September 2012: First published online 9 October 2012 Abstract
Objective: To compare the responsiveness of different anthropometric indicators for measuring nutritional stress among children in developing countries. Design: Growth was studied within 6-month intervals in a rural Senegalese community during one dry and two rainy (hungry) seasons. Responsiveness was defined as the change divided by the standard deviation of each anthropometric indicator. Contrast was defined as the difference in responsiveness between dry and rainy seasons.
Setting: The study was conducted in Niakhar, a rural area of Senegal under demographic surveillance, with contrasted food and morbidity situations between rainy and dry seasons.
Subjects: Some 5000 children under 5 years of age were monitored at 6-month intervals in 1983–1984. The present analysis was carried out on a sub-sample of children aged 6–23 months with complete measures, totalling 2803 children-intervals.
Results: In both univariate and multivariate analysis, mid-upper arm circumference was found to be more responsive to nutritional stress than the commonly used weight-for-height Z-score (contrast 5 20?64 for mid-upper arm circumference v. 20?53 for weight-for-height Z-score). Other discriminant indicators were: muscle circumference, weight-for-height, BMI and triceps skinfold. Height, head circumference and subscapular skinfold had no discriminating power for mea-suring the net effect of nutritional stress during the rainy season.
Conclusions: The use of mid-upper arm circumference for assessing nutritional stress in community surveys should be considered and preferred to other nutritional indicators. Strict standardization procedures for measuring mid-upper arm circumference are required for optimal use.
Keywords Child growth Nutritional status Anthropometry Mid-upper arm circumference Seasonality Responsiveness Niakhar Senegal
In well-fed populations, child growth is expected to be regular and consistent with anthropometric standards. Abnormal patterns of growth, whether undernutrition or obesity, are assessed by specific indicators such as weight-for-age, weight-for-height, BMI, head circumference, mid-upper arm circumference (MUAC), triceps skinfold and subscapular skinfold.
These indicators can be used to monitor the nutritional status of an individual or to assess the nutritional status of a group of children. At the individual level, extensive research has documented that MUAC provides a good assessment of the risk of death and is more and more frequently used in therapeutic feeding programmes to select children in need of treatment(1,2). In contrast, little research has been conducted on the behaviour of these indicators in situations of nutritional stress, i.e. short-term
food shortage or higher demand due to severe morbidity. Which anthropometric indicator is the most responsive for assessment of the nutritional status of populations of children remains an open question. This has multiple implications for anthropometric assessment in developing countries.
In emergency situations, the nutritional situation is usually evaluated based on anthropometric surveys carried out in children under 5 years of age. In a WHO document published in 2000, the situation is said to be acceptable, poor, serious or critical when the proportion of wasted children, i.e. with a weight-for-height Z-score (WHZ) less than 22, is below 5 %, between 5 % and 10 %, between 10 % and 15 % or above 15 %, respectively(3). This classi-fication later evolved, in particular to include food security indicators, but the prevalence of wasting remains
a key element in population nutritional assessment and alert thresholds used in UN documents remain the same(4), although the introduction of WHO growth stan-dards in 2006 led to major changes in wasting prevalence since the publication of the 2000 report(5).
Using WHZ for population assessment has several limitations, however. First, the standard procedure involves weighing and measuring a total of typically more than 600 children in thirty different clusters(3), which is time-consuming and requires mobilization of large resources. Weight and height measurement requires a team of two trained people and heavy equipment that is not easy to carry around(6). Second, WHZ is influenced by body proportion, and in particular leg length, which varies between different populations(7). This is potentially a concern, as children with long legs, who usually are in better health(8), are more easily classified as malnourished with WHZ. Third, these WHZ-based thresholds are used for making decisions about implementing large-scale programmes of management of severe acute malnutrition, but these programmes often identify children in need of treatment by MUAC(2). MUAC often does not classify as malnourished the same children as those defined by WHZ(1), which leads to difficulties when planning a response. As a result, some guidelines also recommend reporting the number of children with low MUAC (,115 mm) as part of nutritional surveillance(9). Beyond all the limitations of the WHZ surveys, their basic assumption, namely that WHZ is the most appropriate anthropometric indicator for measuring nutritional stress, has never been adequately tested. Adaptation to food shortage involves fat and muscle tissue mobilization to provide fuel for body metabolism(10), with a special stress on muscle when food shortage is associated with infec-tion(11). Fat and muscle represent less than 30 % of body weight in children(12)and the relevance of weight-based indices can be questioned, especially when compared with MUAC which measures directly muscle and fat mass.
Responsiveness, defined as the change of an indicator divided by its standard deviation, seems the most appropriate measure to assess the relevance of different indicators to measure nutritional stress(13). Ideally, for comparison, responsiveness should be calculated among all possible nutritional indicators before and during a crisis situation. These data are not readily available, but useful information can be obtained from rural commu-nities experiencing large short-term variations in body composition, such as seasonal variations associated with variations in food availability and morbidity.
The objective of the present study was to compare the responsiveness of selected anthropometric indicators in a rural community during different seasons and to measure their contrast (i.e. the difference in respon-siveness) between seasons with and without nutritional stress.
Data and methods Study population
The study area covered thirty villages in the department of Fatick, an area located about 150 km east of Dakar, the capital city of Senegal (West Africa). The population is poor and lives primarily on subsistence agriculture, growing mainly millet, maize and peanuts (groundnuts). The area is a dry orchard savannah. The climate is harsh, with two distinctive seasons: a rainy season with heavy rainfall from June to October, and a dry season with virtually no rain for the rest of the year. Most crops are planted at the beginning of the rainy season (June) and harvested at the end (September–October). The rainy season is a time of heavy transmission of malaria (mostly Plasmodium falciparum). During the rainy season children undergo severe stress due to food shortage (until the next harvest), malaria, a variety of diarrhoeal diseases and the fact that parents have less time to care for children because of heavy work load in the fields. During the dry season malaria transmission stops, food is more abundant and mothers have more time to devote to young children. However, the dry season is marked by intense transmission of airborne diseases, in particular measles, whooping cough and meningitis. The study area has been the focus of sporadic research between 1962 and 1982, and intense research activity since 1983, which was still going on in 2012. The core of the research is organized around a comprehensive demographic surveillance system covering the whole population of some 30 000 persons(14).
The present study was part of a broader study on the relationship between nutritional status assessed by anthropometry and child survival undertaken in 1983–1984. The broader study has been described in detail elsewhere(15,16). In brief, some 5000 children under 5 years of age living in the study area were visited four times at 6-month intervals in May and November 1983 and in May and November 1984. Intervals between two visits included the dry, post-harvest season (from November to May) and the wet pre-harvest season (from May to November). Altogether, growth data were available for two wet seasons (May 1983 to November 1983, and May 1984 to November 1984) and one dry season (November 1983 to May 1984). For the present study, we selected a sub-sample of children who were present at two successive visits, who were 6–23 months of age at the first visit and who had complete anthropo-metric measures. This age group was selected to maximize contrast because moderate and severe mal-nutrition, and in particular seasonal malmal-nutrition, occur mostly in this age group, and rarely below age 6 months or after age 24 months.
Anthropometric measures
At each visit, a full anthropometric assessment was conducted on all children who were present, including
weight, height/length, head circumference, arm cir-cumference, triceps skinfold and subscapular skinfold. All measurements followed standard procedures and were taken with high-quality equipment by investigators themselves. Length was measured for children unable to stand, usually below 24 months, and height for older children. Weight was measured with beam scales with a precision of 10 g (SECA France, Semur en Auxois, France); length or height (for children who could stand) was measured with metal length/height boards with a precision of 1 mm (Holtain Ltd, Crymych, UK). Circumferences were measured with fibreglass tapes and skinfold thickness with standard callipers (Holtain Ltd). Only one measure was taken for each child at each visit by qualified persons (e.g. B.M. and O.F.).
Statistical analysis Univariate analysis
All anthropometric measures available were used for the present study. First, we used plain values of all measures taken: weight, height/length, head circumference, arm circumference, triceps skinfold and subscapular skinfold. We computed muscle circumference as the difference between MUAC and p 3 triceps skinfold. Second, we used the BMI computed as the ratio of weight to height-squared. Third, we used standardized values of weight-for-age, height-for-age, weight-for-height and head circumference-for-age using Z-scores computed from the 2000 US Centers for Disease Control and Prevention growth charts (CDC-2000 reference set)(17). We selected the CDC-2000 reference set because it had better screening value in this population than the 1977 National Center for Health Statistics growth reference or the 2006 WHO growth standards, in particular for assessing the mortality risk associated with low nutritional status. However, we also provide similar calculations with the 2006 WHO growth standards, for international comparisons.
For each indicator, we computed the mean (m) and standard deviation (s) at baseline, i.e. at the first visit. We defined the change (D) in any selected indicator as the difference between the value at the next visit and the value at the previous visit. Since the mean time interval from one visit to the next was 176 d, with minor varia-tions, we did not standardize the raw values for semester (183 d) in the univariate analysis. The ‘responsiveness’ of each indicator was defined as the change divided by the standard deviation of the same indicator (r 5 D/s). This responsiveness gives a measure of the change (growth or loss) over a semester compared with the variation of the indicator in the population. The higher the value, the more responsive is the indicator for measuring changes. This definition is similar to that introduced earlier by other authors(13). The ‘contrast’ was defined as the dif-ference between the responsiveness during the rainy and the dry season (k 5 r12 r2). The higher the contrast in
absolute value, the better is the indicator to measure the change in body size and body composition during a period of nutritional stress.
Multivariate analysis
A multivariate analysis was carried out to provide a net effect independent of sex, age and duration of interval. This analysis was conducted using linear regression. The dependent variable was the change in the indicator during the interval between two successive visits. The control variables were the duration between two visits (in d), sex (1 for males, 0 for females) and age (in months), and the main independent variable was season (1 for rainy season, 0 for dry season). The net effect of season for each anthropometric indicator was provided directly by the coefficient of season in the linear regression (b) and the ‘contrast’ was computed as the coefficient of season divided by the standard deviation (k05 b/s). All statistical
calculations were done with the SPSS statistical software package version 11.
Results
Sample size and main characteristics
A total of 2803 children-intervals were kept for the final analysis, of which 775 occurred between the first and second visit (May 1983–October 1984: rainy season), 988 occurred between the second and third visit (November 1984–April 1983: dry season) and 1040 occurred between the third and fourth visit (May 1984–October 1984: rainy season). On average, children were well below the international reference for all indicators, with an average WHZ 5 21?1 and an average MUAC 5 13?8 cm, compared with an expected value of 15?5 cm in this age range. The corresponding WHZ value was 20?8 in the 2006 WHO growth standards (Table 1).
Growth during the dry and rainy seasons
Child growth was markedly different during the rainy season when compared with the dry season. For several growth indicators, changes were negative during the rainy season, whereas they were positive during the dry season (MUAC, muscle circumference, triceps skinfold). Changes were also going into the same direction for composite index such as WHZ, BMI and weight-for-age. All of these differences between dry and rainy season were highly significant (P , 10210). As expected, linear growth was positive during both seasons (height, weight, head circumference), but was significantly slower during the rainy season than during the dry season, with the exception of head circumference (no difference). Subscapular skinfold had a different pattern, since it tended to decline with age, especially during the rainy season but also during the more favourable dry season, as expected from international standards.
Responsiveness Univariate analysis
Values of responsiveness (D/s) varied by indicator, and differed between the dry season and the rainy season (Fig. 1). Overall, the largest positive values were obtained for height, weight and head circumference. Low absolute values were obtained for MUAC, muscle circumference and triceps skinfold. Lowest negative values were obtained for BMI, WHZ and subscapular skinfold. More important, the contrast (difference between responsiveness during the
rainy and during the dry season) varied strongly by indi-cator. It was highest in absolute value for MUAC, followed by muscle circumference, WHZ and BMI. Other indicators showed a lower contrast (weight, weight-for-age, triceps skinfold). Three indicators (subscapular skinfold, height and head circumference) showed no contrast in growth between the rainy and dry season (Table 2).
Multivariate analysis
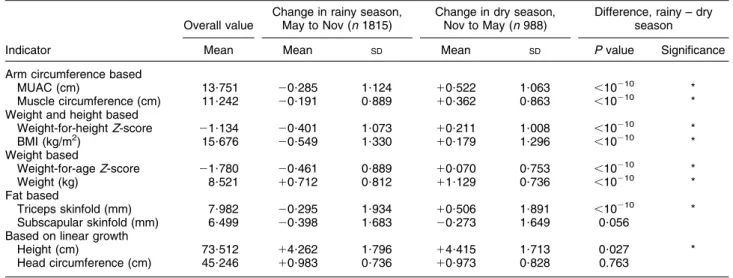
The multivariate analysis confirmed the results of the univariate analysis (Table 3). The highest value of contrast Table 1 Mean values and changes in anthropometric indicators during the dry and rainy season among children aged 6–23 months, Niakhar, Senegal, 1983–1984
Overall value
Change in rainy season, May to Nov (n 1815)
Change in dry season, Nov to May (n 988)
Difference, rainy – dry season
Indicator Mean Mean SD Mean SD P value Significance
Arm circumference based
MUAC (cm) 13?751 20?285 1?124 10?522 1?063 ,10210 *
Muscle circumference (cm) 11?242 20?191 0?889 10?362 0?863 ,10210 *
Weight and height based
Weight-for-height Z-score 21?134 20?401 1?073 10?211 1?008 ,10210 * BMI (kg/m2) 15?676 20?549 1?330 10?179 1?296 ,10210 * Weight based Weight-for-age Z-score 21?780 20?461 0?889 10?070 0?753 ,10210 * Weight (kg) 8?521 10?712 0?812 11?129 0?736 ,10210 * Fat based Triceps skinfold (mm) 7?982 20?295 1?934 10?506 1?891 ,10210 * Subscapular skinfold (mm) 6?499 20?398 1?683 20?273 1?649 0?056 Based on linear growth
Height (cm) 73?512 14?262 1?796 14?415 1?713 0?027 *
Head circumference (cm) 45?246 10?983 0?736 10?973 0?828 0.763
MUAC, mid-upper arm circumference. *P , 0?05 (standard t tests).
Corresponding values in 2006 WHO growth standard: change 5 20?261 (SD1?039) in rainy season and change 5 10?342 (SD0?987) in dry season for weight-for-height Z-score; change 5 20?429 (SD0?818) in rainy season and change 5 10?153 (SD0?754) in dry season for weight-for-age Z-score.
−1·0 −0·8 −0·6 −0·4 0·0 −0·2 0·2 0·4 0·6 0·8 1·0
Mid-upper arm circumference Muscle circumference Weight-for-height Z-score BMI Triceps skinfold Weight-for-age Z-score Weight Height-for-age Z-score Subscapular skinfold Height Head circumference Responsiveness
Fig. 1 Responsiveness of anthropometric indicators among children aged 6–23 months at baseline, by season ( , rainy season; , dry season), Niakhar, Senegal 1983–1984. Note: anthropometric indicators are ranked by contrast (differences between two bars)
was again found for MUAC. Other high values of contrast were found for WHZ, BMI and arm muscle circumference, followed by weight-for-age and triceps skinfold. As for the univariate analysis, the net effects of season were highly significant (all P , 10210). On the other hand, height, head circumference and subscapular skinfold showed no contrast between the two seasons.
Discussion
Comparison of responsiveness of different anthropometric measures and indices within seasons showed that in both
seasons, height, weight and head circumference had the highest responsiveness. This suggests that these indices are the most appropriate to monitor growth velocity of children in a stable situation. This is consistent with the current practice of monitoring preferentially these indices for routinely monitoring the growth of children.
Our hypothesis that responsiveness should vary between seasons was validated. On one hand, there was hardly any variation in head and linear growth between seasons. On the other hand, MUAC, which is directly related to both muscle mass and fat mass, was the most affected, and somewhat more than arm muscle circumference which Table 3 Comparison of changes in anthropometric indicators between dry and rainy seasons (multivariate analysis) among children aged 6–23 months, Niakhar, Senegal, 1983–1984
Net effect of season
Overall standard deviation Mean P value Contrast, rainy – dry
Indicator (s) (b) SD (season) (b/s)
Arm circumference based
MUAC (cm) 1?267 20?725 0?051 2?1 3 10–44 20?57
Muscle circumference (cm) 1?012 20?479 0?041 2?5 3 10–31 20?47
Weight and height based
Weight-for-height Z-score 1?163 20?632 0?047 3?2 3 10–40 20?54 BMI (kg/m2) 1?492 20?756 0?060 1?9 3 10–35 20?51 Weight based Weight-for-age Z-score 1?218 20?518 0?034 7?6 3 10–51 20?43 Weight (kg) 1?532 20?539 0?036 1?2 3 10–48 20?35 Fat based Triceps skinfold (mm) 1?813 20?778 0?089 2?5 3 10–18 20?43 Subscapular skinfold (mm) 1?640 20?064 0?077 0?403 20?04
Based on linear growth
Height (cm) 5?576 20?555 0?076 4?0 3 10–13 20?10
Head circumference (cm) 1?818 0?050 0?032 0?115 10?03
MUAC, mid-upper arm circumference.
Control variables are age, sex and duration of interval. P values from t test on regression models.
Corresponding values in 2006 WHO growth standards: contrast 5 20?55 for weight-for-height Z-score and contrast 5 20?43 for weight-for-age Z-score.
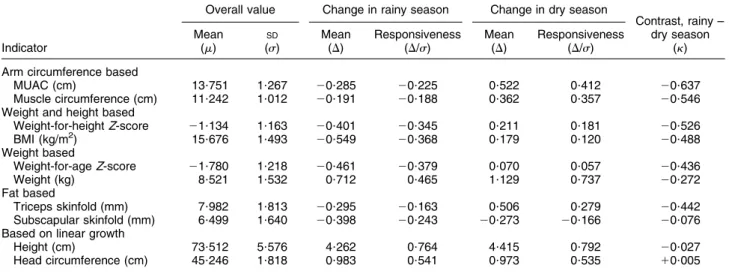
Table 2 Responsiveness in anthropometric indicators between dry and rainy seasons (univariate analysis) among children aged 6–23 months, Niakhar, Senegal 1983–1984
Overall value Change in rainy season Change in dry season
Contrast, rainy – Mean SD Mean Responsiveness Mean Responsiveness dry season
Indicator (m) (s) (D) (D/s) (D) (D/s) (k)
Arm circumference based
MUAC (cm) 13?751 1?267 20?285 20?225 0?522 0?412 20?637
Muscle circumference (cm) 11?242 1?012 20?191 20?188 0?362 0?357 20?546 Weight and height based
Weight-for-height Z-score 21?134 1?163 20?401 20?345 0?211 0?181 20?526 BMI (kg/m2) 15?676 1?493 20?549 20?368 0?179 0?120 20?488 Weight based Weight-for-age Z-score 21?780 1?218 20?461 20?379 0?070 0?057 20?436 Weight (kg) 8?521 1?532 0?712 0?465 1?129 0?737 20?272 Fat based Triceps skinfold (mm) 7?982 1?813 20?295 20?163 0?506 0?279 20?442 Subscapular skinfold (mm) 6?499 1?640 20?398 20?243 20?273 20?166 20?076 Based on linear growth
Height (cm) 73?512 5?576 4?262 0?764 4?415 0?792 20?027
Head circumference (cm) 45?246 1?818 0?983 0?541 0?973 0?535 10?005
MUAC, mid-upper arm circumference.
Responsiveness is the change (D) divided the standard deviation of the measure (s). Contrast is the differences between responsiveness in rainy and dry seasons. Corresponding values in 2006 WHO growth standards: responsiveness in rainy season 5 20?23, responsiveness in dry season 5 10?30 and contrast 5 0?52 for weight-for-height Z-score; responsiveness in rainy season 5 20?34, responsiveness in dry season 5 10?12 and contrast 5 0?46 for weight-for-age Z-score.
discounts for fat. Other classic indicators of changing body composition such as WHZ and BMI also varied sig-nificantly, but were less sensitive than MUAC, as expected since they also include fluid mass. This suggests that MUAC is the nutritional indicator most responsive to nutritional stress at the population level.
The difference in contrast between triceps and sub-scapular skinfold thickness is difficult to interpret as it takes place at an age where fat stores are progressively decreasing(18). In this age range (6–23 months), triceps skinfold is expected to remain roughly constant (although international standards are sometimes inconsistent), whereas subscapular skinfold is expected to decline (true in all standards). These two skinfolds measure different fat stores, likely to have different responses to stress. This point remains poorly studied, and we did not find any detailed analysis on this effect in the published literature. It deserves further research.
Our results are consistent with a previous study in rural Bangladesh which showed that normalized distance of different nutritional indices between seasons was greater for MUAC than for other nutritional indices(19). They are also consistent with our knowledge of adaptation during food deprivation and infection preferentially affecting fat and muscle(10,11) which are the main components of MUAC. This suggests that MUAC is more appropriate than other nutritional indices to measure nutritional stress at population level. This finding, however, requires confirmation in other settings and in other age groups.
In its document on nutrition in emergencies, WHO advised not to use MUAC and stated that its measurement error is too high(3). This document assumes that errors up to 10 mm are often observed when measuring MUAC. This estimation, however, seems very high for skilled observers, who can reproduce MUAC measures with an inter-observer correlation coefficient as high as 0?96 to 0?98(20). The precision of weight measures should not be overestimated either. Even if weight can be measured with 10 g accuracy in a quiet child, several factors impossible to standardize in population surveys such as stool and urine movements, time since last food or drink and hydration status will introduce random errors well beyond 10 g. Of note, MUAC has been shown to be less subject to measurement error than WHZ in a previous study(21) and shown to be less sensitive to hydration status than weight-based nutritional indices(22).
Even if measurement errors were higher for MUAC than for weight and WHZ, this is not enough to discard straightaway the use of MUAC for nutritional surveillance. Measurement errors are likely to increase baseline stan-dard deviation and therefore to decrease responsive-ness. Our results showing a greater responsiveness of MUAC suggest that these measurement errors are com-pensated by the greater variation of MUAC during nutritional stress, making it more detectable. This result, however, cannot be extrapolated to situations where
MUAC is not carefully measured and bears a high random measurement error.
In addition to random errors, a systematic error or observer bias in MUAC measurement could also limit its use to monitor nutritional stress in a community. This is a real possibility as MUAC estimation is influenced by the tension applied to the tape during measurement(20). A simple device to standardize the tension applied to the tape has been recently described (http://tng.brixtonhealth. com/sites/default/files/equal.pull_.MUAC_.pdf). Its useful-ness to remove possible systematic errors during MUAC measure should be explored. If the problem of systematic errors during MUAC measurement can be eliminated, our results suggest that it could be more appropriate than other indices for monitoring nutritional stress of a community, even in non-emergency situations.
Conclusions
Our data suggest that MUAC is the nutritional indictor which is the most responsive to nutritional stress. Our data also show that WHZ is a useful indicator of nutri-tional stress, but apparently is not superior to MUAC as usually assumed in WHO and FAO documents. As WHZ is more difficult to measure, it should be preferred to MUAC only if shown definitely more reactive, which is not supported by our data. MUAC could be more adapted to measure nutritional stress of vulnerable populations, provided its measure can be adequately standardized. Acknowledgements
Source of funding: The Niakhar study was supported by the European Union, DG-XII, Grant # TDR-36 (M.G., B.M., A.B. and O.F.). Conflicts of interest: All authors declare no conflict of interest of any type. Authors’ contribution: The Niakhar study was initiated by M.G., B.M. and A.B.; the fieldwork was conducted by M.B., B.M. and O.F. All four authors contributed to the data analysis and the writing of the paper.
References
1. Myatt M, Khara T & Collins S (2006) A review of methods to detect cases of severely malnourished children in the community for their admission into community-based therapeutic care programs. Food Nutr Bull 27, 3 Suppl., S7–23.
2. World Health Organization/UNICEF/World Food Programme (2009) WHO Child Growth Standards and the Identification of Severe Acute Malnutrition in Infants and Children. Geneva: WHO.
3. World Health Organization (2000) Manual on the Manage-ment of Nutrition in Major Emergencies. Geneva: WHO. 4. Food and Agriculture Organization of the United Nations
(2008) Integrated Food Security Phase Classification – Technical Manual. Rome: FAO; available at http:// www.fao.org/docrep/010/i0275e/i0275e.pdf
5. Seal A & Kerac M (2007) Operational implications of using 2006 World Health Organization growth standards in nutrition programmes: secondary data analysis. BMJ 334, 733. 6. Cogill B (2003) Anthropometric Indicators Measurement
Guide. Washington, DC: FANTA Project, Academy for Educational Development.
7. Myatt M, Duffield A, Seal A et al. (2009) The effect of body shape on weight-for-height and mid-upper arm circumfer-ence based case definitions of acute malnutrition in Ethiopian children. Ann Hum Biol 36, 5–20.
8. Bogin B & Varela-Silva MI (2010) Leg length, body proportion, and health: a review with a note on beauty. Int J Environ Res Public Health 7, 1047–1075.
9. World Health Organization & Centers for Disease Control and Prevention (2010) Technical Guidelines for Integrated Disease Surveillance and Response in the African Region, 2nd ed. Brazzaville, Republic of Congo and Atlanta, GA: WHO Regional Office for Africa and CDC.
10. Cahill GF Jr (2006) Fuel metabolism in starvation. Annu Rev Nutr 26, 1–22.
11. Lecker SH, Solomon V, Mitch WE et al. (1999) Muscle protein breakdown and the critical role of the ubiquitin– proteasome pathway in normal and disease states. J Nutr 129, 1S Suppl., 227S–237S.
12. Food and Agriculture Organization of the United Nations/ World Health Organization (1985) Energy and Protein Requirements. WHO Technical Report Series no. 724. Geneva: WHO.
13. Habicht JP & Pelletier DL (1990) The importance of context in choosing nutritional indicators. J Nutr 120, Suppl. 11, 1519–1524.
14. Garenne M & Cantrelle P (1989) Prospective studies of communities: their unique potential for studying the health
transition. Reflections from the ORSTOM experience in Senegal. In The Health Transition: Methods and Measures (Proceedings of an International Workshop, London, 7–9 June 1989), pp. 251–258 [J Cleland and A Hill, editors]. Canberra: Australian National University.
15. Garenne M, Maire B, Fontaine O et al. (2000) Risques de de´ce`s associe´s a` diffe´rents e´tats nutritionnels chez l’enfant d’aˆge pre´scolaire. Etudes du CEPED no. 17. Paris: CEPED. 16. Garenne M, Willie D, Maire B et al. (2009) Incidence and duration of severe wasting in two African populations. Public Health Nutr 12, 1974–1982.
17. Kuczmarski RJ, Ogden CL, Guo SS et al. (2002) 2000 CDC Growth Charts for the United States: methods and development. Vital Health Stat 11, issue 246, 1–190. 18. Kuzawa CW (1998) Adipose tissue in human infancy
and childhood: an evolutionary perspective. Am J Phys Anthropol Suppl. 27, 177–209.
19. Briend A, Hasan KZ, Aziz KM et al. (1989) Measuring change in nutritional status: a comparison of different anthropometric indices and the sample sizes required. Eur J Clin Nutr 43, 769–778.
20. WHO Multicentre Growth Reference Study Group (2006) Reliability of anthropometric measurements in the WHO Multicentre Growth Reference Study. Acta Paediatr Suppl 450, 38–46.
21. Velzeboer MI, Selwyn BJ, Sargent F et al. (1983) The use of arm circumference in simplified screening for acute malnutrition by minimally trained health workers. J Trop Pediatr 29, 59–66.
22. Mwangome MK, Fegan G, Prentice AM et al. (2011) Are diagnostic criteria for acute malnutrition affected by hydration status in hospitalized children? A repeated measures study. Nutr J 10, 92.