HAL Id: hal-03175551
https://hal.archives-ouvertes.fr/hal-03175551
Preprint submitted on 20 Mar 2021HAL is a multi-disciplinary open access
archive for the deposit and dissemination of sci-entific research documents, whether they are pub-lished or not. The documents may come from teaching and research institutions in France or abroad, or from public or private research centers.
L’archive ouverte pluridisciplinaire HAL, est destinée au dépôt et à la diffusion de documents scientifiques de niveau recherche, publiés ou non, émanant des établissements d’enseignement et de recherche français ou étrangers, des laboratoires publics ou privés.
Epidemiological and clinical insights from SARS-CoV-2
RT-PCR cycle amplification values
Samuel Alizon, Christian Selinger, Mircea Sofonea, Stéphanie
Haim-Boukobza, Jean-Marc Giannoli, Laetitia Ninove, Sylvie Pillet, Thibault
Vincent, Alexis de Rougemont, Camille Tumiotto, et al.
To cite this version:
Samuel Alizon, Christian Selinger, Mircea Sofonea, Stéphanie Haim-Boukobza, Jean-Marc Giannoli, et al.. Epidemiological and clinical insights from SARS-CoV-2 RT-PCR cycle amplification values. 2021. �hal-03175551�
Epidemiological and clinical insights from SARS-CoV-2 RT-PCR
cycle amplification values
Samuel Alizon1,∗, Christian Selinger1,+, Mircea T. Sofonea1,+, Stéphanie Haim-Boukobza2, Jean-Marc Giannoli3, Laetitia Ninove4,
Sylvie Pillet5, Thibault Vincent6, Alexis de Rougemont7,
Camille Tumiotto8, Morgane Solis9, Robin Stephan10,
Céline Bressollette-Bodin11, Maud Salmona12, Anne-Sophie L’Honneur13,
Sylvie Behillil14, Caroline Lefeuvre15, Julia Dina16, Sébastien Hantz17, Cédric Hartard18, David Veyer19, Héloïse M Delagrèverie20,
Slim Fourati21, Benoît Visseaux22, Cécile Henquell23, Bruno Lina24, Vincent Foulongne25, Sonia Burrel26,
and the SFM COVID-19 study group
1MIVEGEC, CNRS, IRD, Université de Montpellier, France 2Laboratoire CERBA, Saint-Ouen-L’Aumône, France 3BIOGROUP, Scientific Direction, France
4Unité des Virus Émergents (UVE: Aix-Marseille Univ-IRD 190-Inserm 1207-IHU Méditerranée
Infection), Marseille, France
5Laboratoire des agents infectieux et d’hygiène, CHU de Saint-Etienne, France 6Laboratoire de Virologie, CHU Rennes, France
7Laboratory of Virology, University Hospital of Dijon, F-21000, Dijon, France
8Univ. Bordeaux, CNRS-UMR 5234, CHU Bordeaux, Virology Department, F-33000, Bordeaux,
France
9CHU de Strasbourg, Laboratoire de Virologie, Strasbourg, France, Université de Strasbourg,
INSERM, IRM UMR_S 1109, Strasbourg, France
10Laboratoire de Microbiologie, CHU Nîmes, France
11Nantes Université, CHU Nantes, Inserm, Centre de Recherche en Transplantation et Immunologie,
UMR 1064, ITUN ; CHU Nantes, Service de Virologie; CHU Nantes, Centre d’Investigation Clinique Unité d’Investigation Clinique 1413, INSERM ; F-44000 Nantes, France
12Laboratoire de Virologie, Hôpital Saint Louis, APHP, INSERM U976, équipe INSIGHT, Université
de Paris, France
17CHU Limoges, Laboratoire de Bactériologie-Virologie-Hygiène, F-87000 Limoges, France et Univ
Limoges, RESINFIT, U 1092, F-87000 Limoges, France
18Laboratoire de Virologie, CHRU de Nancy Brabois, Vandoeuvre-lès-Nancy, France ; Université de
Lorraine, CNRS, LCPME, F-54000, Nancy, France
19Laboratoire de Virologie, Service de Microbiologie, hôpital européen Georges Pompidou, Assistance
Publique-Hôpitaux de Paris et Unité de Génomique Fonctionnelle des Tumeurs Solides, Centre de Recherche des Cordeliers, INSERM, Université Paris, France.
20AP-HP, Hôpital Avicenne, Laboratoire de microbiologie clinique, Bobigny, France 21Henri Mondor Hospital, virology department, France
22Université de Paris, Inserm, UMR 1137 IAME et Laboratoire de Virologie, Hôpital Bichat Claude
Bernard, AP-HP, Paris, France
23Service de Virologie médicale, 3IHP, CHU Clermont-Ferrand, France
24CNR des virus des infections respiratoires (dont la Grippe), Institut des Agents Infectieux, Hopital de
la Croix Rousse, HCL, Lyon, France
25Laboratoire de Virologie, CHU de Montpellier, France
26Sorbonne Université, INSERM U1136, Institut Pierre Louis d’Epidémiologie et de Santé Publique
(IPLESP), AP-HP, Hôpital Pitié-Salpêtrière, Service de Virologie, Paris, France
+equal contribution
∗Corresponding author, samuel.alizon@cnrs.fr
The SARS-CoV-2 pandemic has led to an unprecedented daily use of molecular RT-PCR tests. These tests are interpreted qualitatively for diagnosis, and the relevance of the test result intensity, i.e. the number of amplification cycles (Ct), is debated because
of strong potential biases. We analyze a national database of tests performed on more than 2 million individuals between January and November 2020. Although we find Ct values to vary depending on the testing laboratory or the assay used, we detect
strong significant trends with patient age, number of days after symptoms onset, or the state of the epidemic (the temporal reproduction number) at the time of the test. These results suggest that Ctvalues can be used to improve short-term predictions for
Molecular testing is a key component of screening policies to control the spread of infectious diseases and the SARS-CoV-2 pandemic has led to an unprecedented testing rate using reverse transcription poly-merase chain reaction (RT-PCR) assays. (1). In clinical and public health practices, RT-PCR results are qualitative for viral respiratory disease diagnostics, with reports such as ‘positive’, ‘negative’, ‘uninter-pretable’, and, sometimes, ‘weakly positive’. These are based on the cycles threshold, also referred to as crossing point or crossing threshold (here denoted Ct), which corresponds to the number of PCR
ampli-fication cycles required for the fluorescent signal to rise above a positive threshold. In theory, the more abundant the genetic target in the sample, the fewer the amplification cycles required to detect it. This is why numerous studies on SARS-CoV-2 rely on Ctvalues to assess transmissibility (2) or study infection
kinetics (3). Here, we present a cross-sectional analysis of SARS-CoV-2 RT-PCR tests performed on 2,220,212 individuals in France between January 21, 2020, and November 30, 2020 (Figure 1).
Few studies analyze Ctvalues at a population level. One explanation for this matter of affairs is that
these are known to suffer from several, potentially strong, biases. First, sample type and sampling quality directly affect the amount of genetic material available. Second, the RT-PCR assay matters. Even the quality of the reagents used may have a significant effect on the number of amplification cycles required to achieve the same level of fluorescence for the same amount of target genetic material. Combining data from different laboratories helps to control for these sources of variation in statistical analyses. Furthermore, the larger the dataset, the more we can detect small statistical trends even after having controlled for non-informative variables.
In our analysis, we studied tests from individuals aged between 1 to 89 years old. We did not take into account tests for which key variables such as patient age, patient sex, laboratory geographical department, qualitative result, or RT-PCR assay used were unknown. Note that one test could provide more than one Ct value if containing probes targeting multiple viral genes. According to the national guidelines (4),
it is recommended to focus on the most sensitive target to categorize levels of viral excretion. After removing the biologically unrealistic Ct values that were lower than 10 or larger than 45, the 95%
confidence interval (95CI) of the remaining values was [16.89; 35.56] (Table S1). These correspond to 793, 479 tests from the same number of individuals.
We used a linear regression model to explore how Ctvalues can be explained by the following variables:
patient age and sex, the number of days since the onset of the symptoms (if known), the clinical sampling site (if known), the sampling facility (if known), the RT-PCR assay used, the target gene, the test’s qual-itative result, the sampling date, the temporal reproduction number of the epidemic at the sampling date (denoted Rtand estimated using the EpiEstim method (5)), and a control variable. The latter corresponds
to the last digit of the patient anonymity number and is expected to be independent of the Ctvalue. We
also included in the model an interaction term between sampling date and Rt. For this analysis, we
excluded Ctvalues from internal controls. Univariate analyses are extremely sensitive to heterogeneity
in the dataset. For instance, the age distribution from patients sampled in aged care homes is different than that from city screening facilities, and analyzing the ‘sampling facility’ factor alone could yield misleading result. This is why the analysis used here is multivariate and considers all the factors listed
therefore set our significance thresholds to 5% of that of the control variables, i.e. 6.5 × 10⁻⁴to analyze main effects (Table 1).
The intercept of the linear model indicates the average Ctvalue for a positive test performed with the
reference assay, and all the other factors being set to their reference value. Its magnitude (19.1 cycles) is in line with clinical practice. The importance of the noise in the dataset is illustrated by the strong effect of the testing laboratory, as well as the RT-PCR assay used (Supplementary Figure S1).
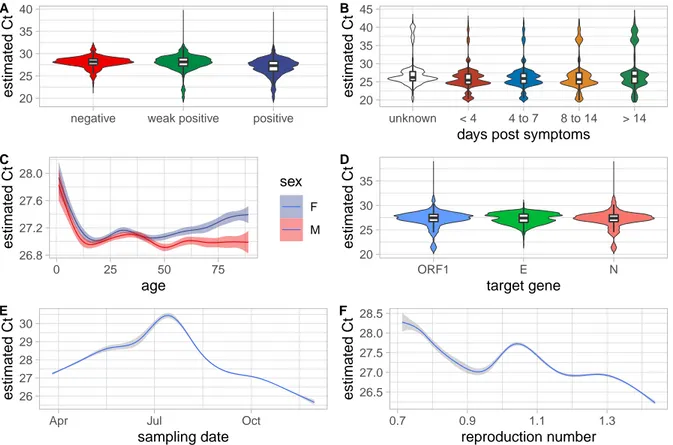
Despite this high level of noise, we detected a strong effect of the qualitative result (Figure 2A), with Ctdifferences that were even larger than that from the laboratory effect. We also found a slightly
sig-nificant difference of -1.81 cycles between the most common type of samples (nasopharyngeal) and that performed on other clinical sampling sites (mostly lower respiratory tracts, but also feces or saliva). This is likely because the latter tests were performed in patients with more severe symptoms.
The effects associated with the number of days since symptoms onset was particularly strong. For the 8.5% of the participants for whom the number of days between symptoms onset and testing dates was known, we found that the Ctgradually increases over the reported range with a maximum difference of
5.73 cycles (Figure 2B).
The effect of sex had the same order of magnitude as that of the control variable and could, therefore, be treated as non-significant. Conversely, the age factor had a strong effect with a decrease of 0.541 cycles per year (Figure 2C).
The target gene of the RT-PCR assay used also yielded a slightly significant effect. The Ct values
obtained when using a probe targeting the ORF1 and S regions of the virus genome were significantly higher than when using the N gene, which was the genomic region of reference in the model (Figure 2D). This effect is consistent with the life-cycle of the virus. As stressed by (6), since coronaviruses are (+)ssRNA viruses, they use the same RNA matrix for replication and transcription, both being amplified by diagnostic assays. Furthermore, Coronaviridae transcripts can produce subgenomic mRNAs that lack part of the genome (7). As a consequence, and as shown in cell cultures (8), genes on the 5’ end of the genome are under-represented. This is consistent with our result where assays targeting the gene on the 3’ end (the N gene) tend to have lower Ct than assays targeting genes on the 5’ end (the ORF1 and S
genes). Note that an alternative explanation could be that some probes target more conserved areas of the SARS-CoV-2 than others (9).
Finally, we found that Ctvalues decreased with time (-0.797 cycle per day), but this effect was non-linear
(Figure 2E). This could be due to the strong variation in testing efforts in France (Figure 1A), but also to variations in the epidemic trend. Indeed, although the Rt(inferred from hospitalization data using the
EpiEstim method (5)) was not found to be significant, the interaction between the sampling date and Rt
was nearly significant (Figure 2F), suggesting that a temporal analysis could yield additional insights. The existence of a correlation between the Ct values of the tests performed in a population and Rt is
consistent with population dynamics theory, which predicts that in an expanding population of infected individuals, the ‘age’ of the infections, i.e. the number of days post-infection, is skewed towards lower values (10). Since Ctvalues have been reported to increase over the course of an infection (3), which we
confirm with this analysis (Figure 2D), it has suggested that these values could be used as an early signal to predict Rt(11).
To investigate this question, we focused on screening data collected in the general population from individuals aged from 5 to 79. We estimated the median and skewness values of the daily distribution of the Ctvalues. To correct for potential confounding factors, these were adjusted using a linear model
a 7-day rolling average of this median, skew, and Rt(Figure 3). For the median Ctvalue, we found a
significant correlation with Rtthat was maximized for a 6 to 7 days delay (Figure S2). This is consistent
with Rtbeing calculated using data from ICU-admissions, which occur with a median of 14 days after
infection (12, 13), and RT-PCR screening data being obtained earlier in the infection.
To further assess the usefulness of Ct data, we used ARIMA models to predict Rt dynamics over 7
days. We compared models without any exogenous data, to models that also included exogenous time series (either median or skewness of estimated Ctvalues distribution, or the fraction of positive tests (1)).
As expected, the prediction error made using only endogenous data (Rt) was low in periods where Rt
variations were limited. Furthermore, we found that adding exogenous data improved the prediction, especially when strong shifts in Rtwere occurring (Figure 3). Ctvalues (green and cyan dots) tended to
provide a better reduction in the error of the prediction than the ratio of positive tests (purple).
This analysis of a large national database of RT-PCR tests performed in the context of a major epidemic confirms that population-level Ctvalues are noisy since even a linear model that features 91 degrees of
freedom does not explain the majority of the variance. However, owing to the law of large numbers, we detect several effects that are in line with biological observations and with virological properties. For instance, our finding that Ctvalues decrease as a function of the number of days after symptoms onset
is consistent with longitudinal follow-ups (3). Similarly, the difference we detect between the virus gene targeted by the RT-PCR assay used can be interpreted in the light of known differences in mRNA copy numbers between genes depending on their distance from the 3’ end (8). Concerning the link between age and Ctvalues, although there are some mechanistic interpretations as to why virus load would increase
with age (14), the evidence was mixed, with some studies reporting a decreasing trend (15) and others not (16, 17). Here, using a multivariate approach on a large dataset allows us to unravel a strong and significant decrease of Ctvalues with age.
A limitation our study is that although our dataset stands out by its size and its level of details, it is restricted to a single country where testing effort varies, both on a temporal and on a spatial scale (Figure 1). Performing similar analyses for other populations can therefore be particularly informative.
A promising output of this analysis is the possibility to use Ctvalues as an early signal to detect changes
in epidemic behavior, e.g. Rtvalues. Indeed, our most robust descriptors of the epidemics originate from
hospital-admission data, but these have a significant delay with the status of the epidemic since patients are hospitalized 2 weeks after infection (12,13). The ratio of positive tests performed in the population of interest can, in theory, provide earlier insights but it suffers from strong sampling biases. We show that accounting for population-based Ct values variations can improve Rt predictions on a 7-days period.
This corroborates earlier hypotheses (11) but also reveals the importance of analyzing a large-enough dataset to filter out the important amount of noise in these values. Overall, these results call for better integration of Ctvalues in national public health policies to monitor epidemics caused by SARS-CoV-2
but also other human viruses, especially since these data raise less ethical concerns than other sources of data such as mobility data.
References
1. E. O.-O. Max Roser, Hannah Ritchie, J. Hasell, Our World in Data (2020). 2. X. He, et al., Nature Medicine 26, 672 (2020).
3. N. Néant, et al., PNAS 118 (2021).
4. French Microbiology Society (SFM), Avis du 25 septembre 2020 de la Société Française de Micro-biologie (SFM) relatif à l’interprétation de la valeur de Ct (estimation de la charge virale) obtenue en cas de RT-PCR SARS-CoV-2 positive sur les prélèvements cliniques réalisés à des fins diagnos-tiques ou de dépistage, Tech. rep. (2021).
5. A. Cori, N. M. Ferguson, C. Fraser, S. Cauchemez, Am J Epidemiol 178, 1505 (2013). 6. Y. Michalakis, M. T. Sofonea, S. Alizon, OSF Preprints (2021).
7. N. S. Ogando, et al., Journal of General Virology, 101, 925 (2020). 8. Y. Finkel, et al., Nature 589, 125 (2021).
9. B. Dearlove, et al., PNAS (2020).
10. H. Caswell, Matrix population models: construction, analysis and interpretation (Sinauer Asso-ciates, Inc., MA 01375 USA, 1989).
11. J. A. Hay, L. Kennedy-Shaffer, S. Kanjilal, M. Lipsitch, M. J. Mina, medRxiv 2020.10.08.20204222 (2020).
12. M. T. Sofonea, et al., medRxiv 2020.05.22.20110593 (2020). 13. H. Salje, et al., Science (2020).
14. Y. Yang, Y. Zhao, F. Zhanga, L. Zhang, L. Li, Aging and disease 11, 1481 (2020). 15. S. Euser, et al., medRxiv 2021.01.15.21249691 (2021).
16. T. C. Jones, et al., medRxiv 2020.06.08.20125484 (2020). 17. A. S. Walker, et al., medRxiv 2020.10.25.20219048 (2020). 18. R. N. Thompson, et al., Epidemics 29, 100356 (2019).
19. This study was approved by the Internal Review Board of the CHU of Montpellier (France) and is registered at ClinicalTrials.gov under the ID NCT04738331. We thank the CNRS and the IRD for their support, and the ETE modelling team for discussion.
Table 1: Main factors affecting Ct values. We only list factors with significant effects with a 10−3 p-value criterion. Coefficients reflect differences in Ct. For qualitative factors, the reference value is
shown.
Factor Value Coefficient 2.5% CI 97.5% CI
(intercept) 19.1 12.9 25.4
assay PerkinElmer (ref.) — — —
Genefinder 12.1 10.3 13.9
laboratory LAB_1 (ref.) — — —
LAB_122 5.42 3.79 7.05
LAB_96 −4.8 −6.71 −2.90
result positive (ref.) — — —
weakly positive 11.3 11.1 11.5
negative 16.9 16.6 17.2
days post-symptoms onset less than 4 (ref.) — — —
4 to 7 2.76 2.66 2.86
8 to 14 4.90 4.73 5.08
more than 14 5.73 5.43 6.03
sample naso-pharyngeal (ref.) — — —
other −1.81 −2.49 −1.14
age (per year) −0.541 −0.585 −0.497
target gene N (ref.) — — —
ORF1 1.03 0.949 1.12
S 1.19 0.948 1.43
0 10000 20000 30000 40000
Apr Jul Oct
sampling date
n
umber of tests
A number of tests analysed (in log10)
0 1 2 3 4 5 B
20 25 30 35 40
negative weak positive positive
estimated Ct A 20 25 30 35 40 45 unknown < 4 4 to 7 8 to 14 > 14 days post symptoms
estimated Ct B 26.8 27.2 27.6 28.0 0 25 50 75 age estimated Ct sex F M C 20 25 30 35 ORF1 E N target gene estimated Ct D 26 27 28 29 30
Apr Jul Oct
sampling date estimated Ct E 26.5 27.0 27.5 28.0 28.5 0.7 0.9 1.1 1.3 reproduction number estimated Ct F
Figure 2: Correlations between key factors and observed Ctvariations. A) Qualitative result of the
test, B) number of days between symptoms onset and testing , C) participant age and sex, D) genomic area targeted by the test, E) sampling date, and F) temporal reproduction number (Rt) at the time of the
test. For panels A, B, and D, the violin plots indicate the distributions and the box plots show the 0.025, 0.25, 0.5, 0.75, and 0.975 quantiles. Panels C, E, and F are obtained with a ‘loess’ smoothing model. The Ctvalues shown are not the raw values but that estimated using a linear model to correct for biases
positive test ratio
Ct skewness Ct median
Rt
Aug Sep Oct Nov Dec
Aug Sep Oct Nov Dec Aug Sep Oct Nov Dec
Aug Sep Oct Nov Dec 0.8 1.0 1.2 1.4 −2 −1 0 1 2 −0.2 0.0 0.2 0.04 0.08 0.12 0.16 MAPE
Aug Sep Oct Nov Dec 0 5 10 15 prediction error , Rt only (%) ΔMAPE
Aug Sep Oct Nov Dec 0
3 6 9
date
prediction error impro
vement (%)
best prediction Rt
Rt + Ct quartiles Rt + Ct skewness Rt + positive test ratio
Figure 3: Predicting temporal reproduction number (Rt) from time series. The top four panels show
the the 7-days rolling averages of the time series of the ratio of positive tests (in purple), the median (in green) and skewness (in cyan) of the daily Ctresidual distribution, and Rt(in black). The bottom panels
show the error made by a prediction using only Rtdata (red dots) and the potential improvement made
Supplementary materials
Contents
S1 Authors contributions 12
S2 Ethics 12
S3 Data and scripts 12
S4 SFM COVID-19 study group 12
S5 Supplementary Methods 13
S5.1 Initial data filtering . . . 13
S5.2 Database properties . . . 13
S5.3 Temporal reproduction number (Rt) . . . 15
S5.4 Statistical analyses . . . 15
S5.4.1 Linear model . . . 15
S5.4.2 Time series analyses . . . 15
S5.4.3 Predictive analyses . . . 16
S5.4.4 Figure 2 Ctvalues . . . 16
S1
Authors contributions
SA, VF, and SB conceived the study, SH-B, J-MG, LN, SP, TV, AdR, CT, MS, RS, CB-B, MS, A-SLH, SB, CL, JD, SH, CH, DV, HMD, SF, BV,CH, VF, and SB contributed anonymous data, SA compiled the anonymous data sets from the collaborating partners, SA, MTS, and CS analysed the data, SA wrote the first draft of the manuscript, all authors commented and approved the manuscript.
This study was supported by the COVID-19 study group from the Société Française de Microbiologie (SFM).
S2
Ethics
This study was approved by the Internal Review Board of the Centre Hospitalier Universitaire de Mont-pellier. It is registered at ClinicalTrials.gov under the identifier NCT04738331.
S3
Data and scripts
The final data set analyzed along with the R scripts will be made available upon publication.
S4
SFM COVID-19 study group
The participants of the SFM COVID-19 study group are LINA Gérard (president of the SFM, CHU Lyon), VABRET Astrid (CHU de Caen), ADNET Justine (CHU de Caen), ROQUEBERT Benedicte (Cerba), DUCANCELLE Alexandra (CHU d’Angers), LE GUILLOU-GUILLEMETTE Hélène (CHU d’Angers), BOUTHRY Elise (CHU d’Angers), LUNEL-FABIANI Françoise (CHU d’Angers), PIVERT Adeline (CHU d’Angers), APAIRE-MARCHAIS Véronique (CHU d’Angers), ROGER Steven (CHU d’Angers), Chakib Alloui (Avicenne), Ségolène Brichler (Avicenne), Emmanuel Gordien (Avicenne), MIRAND Audrey (CHU de Clermont-Ferrand), ARCHIMBAUD Christine (CHU de Clermont-Ferrand), BREBION Amélie (CHU de Clermont-Ferrand), REGAGNON Christel (CHU de Clermont-Ferrand), CHABROLLES Hélène (CHU de Clermont-Ferrand), BISSEUX Maxime (CHU de Clermont-Ferrand), COMBES Patricia (CHU de Clermont-Ferrand), Hélène Jeulin (CHU de Nancy), Véronique Venard (CHU de Nancy), Evelyne Schvoerer (CHU de Nancy), Anne Lebouter (Henri Mondor APHP), Souraya Khouider (Henri Mondor APHP), Alexandre Soulier (Henri Mondor APHP), Aurelie Gourgeon (Henri Mondor APHP), Bellecave Pantxika (CHU de Bordeaux), Busson Laurent (CHU de Bordeaux), Garrigue Isabelle (CHU de Bordeaux), Lafon Marie-Edith (CHU de Bordeaux), Trimoulet Pascale (CHU de Bor-deaux), Bruno Pozzetto (CHU de Saint-Etienne), Thomas Bourlet (CHU de Saint-Etienne), Sylvie Gon-zalo (CHU de Saint-Etienne), Rémi Labetoulle (CHU de Saint-Etienne), Rogez Sylvie (CHU de Limo-ges), Alain Sophie (CHU de LimoLimo-ges), Marianne Coste-Burel (CHU de Nantes), Virginie Ferré (CHU de Nantes), Berthe-Marie Imbert-Marcille (CHU de Nantes), Pierre Edouard Fournier (IHU Méditer-ranée infection), Petit Paul Rémi (IHU MéditerMéditer-ranée infection), Luciani Léa (IHU MéditerMéditer-ranée in-fection), Zandotti Christine (IHU Méditerranée inin-fection), Charre Caroline (Cochin APHP), Mariaggi Alice-Andrée (Cochin APHP), Méritet Jean-François (Cochin APHP), Rozenberg Flore (Cochin APHP), Febreau Christine (CHU de Rennes), Comacle Pauline (CHU de Rennes), Lagathu Gisèle (CHU de Rennes), Maillard Anne (CHU de Rennes), Grolhier Claire (CHU de Rennes), Pronier Charlotte (CHU de
Rennes), David Boutolleau (La Pitié Salpêtrière APHP), Anne-Geneviève Marcelin (La Pitié Salpêtrière APHP), Vincent Calvez (La Pitié Salpêtrière APHP), Stéphane Marot (La Pitié Salpêtrière APHP), Sepi-deh Akhavan (La Pitié Salpêtrière APHP), Basma Abdi (La Pitié Salpêtrière APHP), Marc Wirden (La Pitié Salpêtrière APHP), Cathia Soulié (La Pitié Salpêtrière APHP), Aude Jary (La Pitié Salpêtrière APHP), Elisa Teyssou (La Pitié Salpêtrière APHP), Sylvie van der Werf (CNR IPP), Vincent Enouf (CNR IPP), BOUDET Agathe (CHU de Nîmes), CARLES Marie-Josee (CHU de Nîmes), PERE Hélène (HEGP APHP), BELEC Laurent (HEGP APHP), IZQUIERDO Laure (HEGP APHP), RODARY Julien (HEGP APHP), BAILLARD Jean-Louis (HEGP APHP), RIBEYRE Tatiana (HEGP APHP), SALIBA Madelina (HEGP APHP), ROGER Alicia (HEGP APHP), GARNIER Nathalie (HEGP APHP), ROBIL-LARD Nicolas (HEGP APHP), Le Goff Jérôme (Saint Louis APHP), Delaugerre Constance (Saint Louis APHP), Chaix Marie-Laure (Saint Louis APHP), Feghoul Linda (Saint Louis APHP), Mahjoub Nadia (Saint Louis APHP), Maylin Sarah (Saint Louis APHP), Schnepf Nathalie (Saint Louis APHP), Alfaisal Jamal (Saint Louis APHP), AGNELLO Davide (CHU de Dijon), AUVRAY Christelle (CHU de Dijon), BELLIOT Gaël (CHU de Dijon), BOUR Jean-Baptiste (CHU de Dijon), CASENAZ Alice (CHU de Di-jon), GUILLOTIN Florence (CHU de DiDi-jon), MANOHA Catherine (CHU de DiDi-jon), SI-MOHAMMED Ali (CHU de Dijon), TAN Rithy-Nicolas (CHU de Dijon), Diane Descamps (Bichat APHP), Nadhira Houhou-Fidouh (Bichat APHP), Charlotte Charpentier (Bichat APHP), Houria Ichou (Bichat APHP), Florence Damond (Bichat APHP), Quentin Le Hingrat (Bichat APHP), Valentine Ferré (Bichat APHP), Lucile Larrouy (Bichat APHP), Vincent Mackiewicz (Bichat APHP), Gilles Collin (Bichat APHP), FAFI-KREMER Samira (CHU de Strasbourg), GALLAIS Floriane (CHU de Strasbourg), LAUGEL Elodie (CHU de Strasbourg), BENOTMANE Ilies (CHU de Strasbourg), VELAY Aurélie (CHU de Strasbourg), and WENDLING Marie-Josée (CHU de Strasbourg)
S5
Supplementary Methods
S5.1 Initial data filtering
The French Society for Microbiology (SFM) send a query to collect anonymous RT-PCR test results data from 19 public and 2 private laboratories. The response files were curated manually and merged using R. Test values without any Ctvalues (negative tests) were removed.
This led to an initial global data set from 2, 220, 212 individuals. Removing non-numerical Ctvalues
(usually a qualitative description of a negative result) decreased this number by 30% from 10, 668, 371 to 7, 516, 936 Ctvalues (note that most tests are usually associated with more than a single value since it
can have multiple targets). We then removed all the Ctvalues equal to zero, which left us with 1, 969, 043
values.
Finally, we performed some extra filtering to remove aberrant Ct values (greater than 100), test with
missing values for sampling French department, qualitative result, or RT-PCR test used. This left us with 1, 299, 447 values originating from 824, 446 individuals. Further details are available in Table S1.
Table S1: Description of the dataset variables. For real numbers, we show the median and the 95% confidence interval. For categorical variables, we either indicate the number of factors or the number of occurrences n for each factor.
Variable Description Details Values
department French administrative department where
the sampling was performed categorical 97 departments id_lab laboratory associated with the sampling categorical 128 labs control_variable a control variable created using the last
digit of the patient anonymity number categorical 10 values id_patient participant anonymity number categorical 825, 446 ids
date sampling date date min = 01/21/2020
max = 30/11/2020
sampling_facility type of facility where the sampling was performed
city screening n = 1, 008, 307 aged care home n = 3, 822
hospital n = 72, 682 prison n = 45 missing n = 44, 570 sample_type clinical localization sampled nasopharyngeal n = 1, 086, 004
other n = 35, 660 assay_PCR the description of the RT-PCR assay used categorical 13 assays
target_gene SARS-CoV-2 genomic area corresponding to the Ctvalue N n = 199, 256 E n = 55, 717 S n = 9, 953 ORF1 n = 227, 192 N& ORF1 n = 1, 196 internal control n = 636, 123 Ct
amplification cycles required to reach the
signal (0 values are removed) real 28.10 [18.30; 37.37] Rt
temporal reproduction number (see
Supplementary methods for details) real 1.15 [0.76; 1.41] result qualitative result of the test
positive n = 524, 065 negative n = 585, 293 weak positive n = 20, 079 age participant age (in years) integer 48 [25; 83]
sex patient sex female n = 637, 212
male n = 492, 225
symptoms number of days between symptoms onset and testing less than 4 n = 107, 417 4 to 7 n = 22, 308 8 to 12 n = 6, 070 more than 12 n = 1, 945 missing n = 991, 697
S5.3 Temporal reproduction number (Rt)
The temporal reproduction number (denoted Rt) was computed on the COVID-19 hospital admission
incidence time series established by the national public health agency (Santé Publique France) and acces-sible at this website. Because of strong daily variations (especially on week-ends), we first transformed the time series using a 7-days rolling average. We then used the EpiEstim method (5) and the eponym package in R (18).
Earlier studies have reported that, for patients who develop severe symptoms, the median time between infection and hospital admission is in the order of 14 days (12, 13).
S5.4 Statistical analyses
All the analyses were performed in R version 3.6.3.
S5.4.1 Linear model
The linear model was performed in individuals from 1 to 90 years old. We also removed Ct values
associated to internal controls because they caused the distribution of the residuals to be non-Gaussian. Quantitative factors, namely R(t), date, and age were scaled and centered.
The model was formulated as follows in R:
modele_general = lm(Ct ~ Rt*date + age + sexe + target_gene +
assay_PCR + id_lab + symptoms + result +
sample_type + sampling_facility + control_variable, data)
The adjusted R2of the model was 38.8% and the distribution of the residuals Gaussian (Figure S2A). The model was analyzed using an ANOVA assuming type-II errors because of the unbalanced nature of the data set. All the variable were found to be extremely significant (p-value < 10−6), except for Rt(p-value of 0.68) the control variable (p-value of 0.0131), sampling facility (p-value of 0.0135), sex
(p-value of 0.0021), interaction between Rtand date (p-value of 0.000842).
S5.4.2 Time series analyses
To analyze the time series of reproduction number and Ctvalues we restricted the data to tests performed
after July 1, 2021, in a screening context, using nasopharyngeal swabs, in individuals aged from 6 to 80. These assumptions were made such that Ct values would reflect the state of the ongoing epidemic.
Finally, we excluded values from internal control genes. Overall, we analysed 234,782 Ctvalues from
110,227 individuals.
To correct for other potential confounding factors, we first performed a linear model.
S5.4.3 Predictive analyses
We used ARIMA models (implemented in the R package forecast) to predict the hospital-admission temporal reproduction number (Rt) from past observations.
For each date, predictions were evaluated in terms of the mean absolute percentage error (MAPE) for horizons of 7 days in the future based on coefficients learned from past data starting on July 29th, 2020. More precisely, for each date we compared the temporal reproduction number data {Dk; k = 1, . . . , 7}
with the seven-day model forecast {Fk; k = 1, . . . , 7} by
MAPE = 1 7 7 X k=1 Dk− Fk Dk We considered 4 types of data:
1. past Rtdata (i.e. endogenous data),
2. quartiles from Ctresiduals (to remove biases),
3. skewness from Ct residuals,
4. national positive test ratio collected from https://covid.ourworldindata.org/data/. The residuals of Ctwere obtained from the following linear model:
lm(Ct ~ age + target_gene*assay_PCR + id_lab, data)
Our goal was to see if adding exogenous data, i.e. Ctvalues and proportion of positive tests, increased
prediction precision.
Models were tuned with the auto.arima function, and untuned models were run with p = 9, d = 2, and q = 0 as default parameters, based on the cross-correlation analysis between Rtand Cttime series
(Figure S2).
Prediction improvement by models using in addition exogenous data relative to model using past values of Rtonly was defined by
∆MAPE = MAPERt− MAPERt+exo
S5.4.4 Figure 2 Ctvalues
To visualize the effect of the different factors, we first perform a linear model to correct for the effect of confounding factors.
We used the general model described above but removed the effect ‘control_variable’, as well as the effects ‘target_gene’, ‘sample_type’, ‘symptoms’ and ‘sampling_facility’ which had little effect and were sometimes lacking for many participants. For each figure, we also removed the main factor of interest (depending on the panel).
S6
Supplementary Figures
n=44688 n=284619 n=38515 n=18878 n=2915 n=12022 n=4721 n=4448 n=37375 n=58846 n=22928 n=24885 n=1027 n=401 n=5295 n=4 n=253157 n=17159 n=16740 n=736 n=593 n=2837 n=1760 n=1904 n=6949 n=30333 n=3674 n=26287 n=10527 n=9939 n=9190Genefinder Technique Charité Thermofischer
Cobas 6800 (Roche) Cobas 8800 (Roche) Daan Gene (Appolonbiotek)
Argene (BioMérieux) BGI CNR Paris
PerkinElmer Alinity (Abbott) Allplex (Seegene)
ORF1 S E N N&O IC ORF1 S E N N&O IC ORF1 S E N N&O IC
20 25 30 35 40 45 20 25 30 35 40 45 20 25 30 35 40 45 20 25 30 35 40 45 target gene estimated Ct
Figure S1: Effect of the RT-PCR assay used on the estimated Ctvalue as a function of the targeted
0.00 0.02 0.04 0.06
−40 −20 0 20
linear model Ct residual
density A 0.00 0.02 0.04 0.06 −20 −10 0 10 20
linear mixed model Ct residual
density
B
Figure S2: Distribution of the Ctresiduals value. A) For the linear model used for the main analysis
shown in Table 1, B) for the linear model used to generate residuals for the Rttime series analysis.
● ● ● ● ● ● ● ● ● ● ● ●● ● ● ●● ●● ●● ● ● ● ● ● ● ●● ●● ● ●● ● ● ●● ● ● ● ●● −0.2 0.0 0.2 −20 −10 0 10 20 lag (days) correlation A ●● ●● ●● ●● ● ●● ● ● ● ● ● ● ●● ● ● ●● ● ● ● ● ●● ● ●● ● ● ● ● ●● ● ● ● ●● −0.4 −0.2 0.0 0.2 0.4 −20 −10 0 10 20 lag (days) correlation B
Figure S3: Cross correlation functions between Rtand A) the median or B) the skewness of the Ct
residuals distribution. The blue shaded areas show the non-significant values (with a 95% threshold) and the red vertical dotted lines the lag with the highest significant correlation. Note that the lag is smaller for the skewness than for the median of the distribution.
positive test ratio
Ct skewness Ct median
Rt
Aug Sep Oct Nov Dec
Aug Sep Oct Nov Dec Aug Sep Oct Nov Dec
Aug Sep Oct Nov Dec 0.8 1.0 1.2 1.4 −2 −1 0 1 2 −0.2 0.0 0.2 0.04 0.08 0.12 0.16 date MAPE
Aug Sep Oct Nov Dec 0 5 10 15 prediction error , Rt only (%) ΔMAPE
Aug Sep Oct Nov Dec 0.0
2.5 5.0 7.5
prediction error impro
vement (%)
best prediction Rt
Rt + Ct quartiles Rt + Ct skewness Rt + positive test ratio