HAL Id: hal-00296395
https://hal.archives-ouvertes.fr/hal-00296395
Submitted on 10 Dec 2007
HAL is a multi-disciplinary open access
archive for the deposit and dissemination of
sci-entific research documents, whether they are
pub-lished or not. The documents may come from
teaching and research institutions in France or
abroad, or from public or private research centers.
L’archive ouverte pluridisciplinaire HAL, est
destinée au dépôt et à la diffusion de documents
scientifiques de niveau recherche, publiés ou non,
émanant des établissements d’enseignement et de
recherche français ou étrangers, des laboratoires
publics ou privés.
Greece during the total solar eclipse event of 29 March
2006
P. Zanis, E. Katragkou, M. Kanakidou, B. E. Psiloglou, S. Karathanasis, M.
Vrekoussis, E. Gerasopoulos, I. Lisaridis, K. Markakis, A. Poupkou, et al.
To cite this version:
P. Zanis, E. Katragkou, M. Kanakidou, B. E. Psiloglou, S. Karathanasis, et al.. Effects on
sur-face atmospheric photo-oxidants over Greece during the total solar eclipse event of 29 March 2006.
Atmospheric Chemistry and Physics, European Geosciences Union, 2007, 7 (23), pp.6061-6073.
�hal-00296395�
www.atmos-chem-phys.net/7/6061/2007/ © Author(s) 2007. This work is licensed under a Creative Commons License.
Chemistry
and Physics
Effects on surface atmospheric photo-oxidants over Greece during
the total solar eclipse event of 29 March 2006
P. Zanis1, E. Katragkou2, M. Kanakidou3, B. E. Psiloglou4, S. Karathanasis5, M. Vrekoussis3,*, E. Gerasopoulos4, I. Lisaridis2, K. Markakis2, A. Poupkou2, V. Amiridis4, D. Melas2, N. Mihalopoulos3, and C. Zerefos4
1Department of Meteorology and Climatology, Aristotle University of Thessaloniki, Greece 2Laboratory of Atmospheric Physics, Aristotle University of Thessaloniki, Greece
3Environmental Chemical Processes Laboratory, Department of Chemistry, University of Crete, Greece 4National Observatory of Athens, Athens, Greece
5Region of Central Macedonia, Thessaloniki, Greece
*now at: Institute of Environmental Physics and Remote Sensing IUP/IFE, University of Bremen, Germany
Received: 20 July 2007 – Published in Atmos. Chem. Phys. Discuss.: 2 August 2007
Revised: 26 November 2007 – Accepted: 26 November 2007 – Published: 10 December 2007
Abstract.
This study investigates the effects of the total solar eclipse of 29 March 2006 on surface air-quality levels over Greece based on observations at a number of sites in conjunction with chemical box modelling and 3-D air-quality modelling. Emphasis is given on surface ozone and other photooxidants at four Greek sites Kastelorizo, Finokalia (Crete), Pallini (Athens) and Thessaloniki, which are located at gradually increasing distances from the path of the eclipse totality and are characterized by different air pollution levels. The eclipse offered the opportunity to test our understanding of air pollu-tion build-up and the response of the gas-phase chemistry of photo-oxidants during a photolytical perturbation using both a photochemical box model and a regional air-quality offline model based on the modeling system WRF/CAMx. At the relatively unpolluted sites of Kastelorizo and Finokalia no clear signal of the solar eclipse on surface O3, NO2and NO
concentrations can be deduced from the observations while there is no correlation of observed O3, NO2 and NO with
observed global radiation. The box and regional model sim-ulations for the two relatively unpolluted sites indicate that the calculated changes in net ozone production rates between eclipse and non eclipse conditions are rather small compared to the observed short-term ozone variability. Furthermore the simulated ozone lifetime is in the range of a few days at these sites and hence the solar eclipse effects on ozone can be eas-ily masked by local and regional transport. At the polluted sites of Thessaloniki and Pallini, the solar eclipse effects on O3, NO2and NO concentrations are revealed from both the
measurements and modeling with the net effect being a de-crease in O3and NO and an increase in NO2as NO2formed
Correspondence to: P. Zanis
(zanis@auth.gr)
from the reaction of O3with NO while at the same time NO2
is not efficiently photolysed. This result is also supported by a positive correlation of observed global radiation with O3
and NO and a negative correlation with NO2. It is evident
from the 3-D air quality modeling over Greece that the max-imum effects of the eclipse on O3, NO2and NO are reflected
on the large urban agglomerations of Athens, and Thessa-loniki where the maximum of the emissions occur.
1 Introduction
The effects of a solar eclipse on total ozone column and stratospheric ozone have been reported by several authors (Zerefos et al., 2000 and references therein). However, there are only a limited number of studies concerning the so-lar eclipse induced effects on tropospheric ozone and other photooxidants (Srivastava et al., 1982; Abram et al., 2000; Fabian et al., 2001; Zanis et al., 2001; Zerefos et al., 2001).
During a solar eclipse solar radiation changes may affect tropospheric ozone in several ways and timescales. Tropo-spheric ozone concentrations may be directly affected by the JO1D and JNO2 photolysis rate constants changes and
in-directly by the NOx and HOx budget modifications. Both
change the relative strength of sources and sinks of tropo-spheric O3. A fast response of tropospheric ozone to solar
eclipse stems from the decrease of JNO2 which induces a
perturbation from the photostationary steady state of O3, NO
and NO2in reactions (R1), (R2) and (R3):
NO2+hv (λ<424 nm)→O(3P) + NO (R1)
O(3P) + O2+M→O3+M (R2)
As a direct consequence the primary pollutant NO destroys O3through the titration reaction (R3) without O3being
re-sumed through the NO2photolysis (R1). This fast ozone
re-sponse to solar eclipse can be clearly identified in relatively polluted sites such as urban and suburban sites.
A slower response of tropospheric ozone to solar eclipse can result from changes in the UV-B radiation which af-fect the photolysis rate constant JO1D that photodissociates ozone in the near UV. Changes in UV-B induce changes in the direct ozone loss rate via reaction (R4), of the produc-tion rate of the hydroxyl radical OH (in the presence of water vapor) via reaction (R5) and of the hydroperoxy radicals via reactions (R6) and (R7):
O3+hv(λ<320 nm)→O1D + O2 (R4)
O1D + H2O→2OH (R5)
OH + CO→H + CO2 (R6)
H + O2+M→HO2+M (R7)
In turn, changes in the OH and HO2concentrations induce
changes in the rates of ozone loss pathways via reactions (R8) and (R9):
HO2+O3→OH + 2O2 (R8)
OH + O3→HO2+O2) (R9)
and in the ozone production pathway via reaction (R10) when NO is present :
HO2+NO→OH + NO2 (R10)
The photolysis of other species which are secondary sources of radicals such as HCHO (λ<330 nm) or CH3CHO
(λ<330 nm) via radical formation can also affect the surface ozone concentrations. Therefore, surface ozone is expected to be susceptible to solar radiation changes observed during eclipse events.
Zanis et al. (2001) showed that during the eclipse of 11 August 1999 the surface ozone displayed a decrease of around 10–15 ppbv at the urban site of Thessaloniki, Greece (90% sun disk obscuration) while at the rural elevated site of Hohenpeissenberg, Germany (99.4% sun disk obscura-tion) the actual surface ozone data did not show any clear eclipse effect. During the 11 August 1999 eclipse event, Mavrakis et al. (2004) found ozone responses to the eclipse over the greater Athens area that varied in terms of timing and intensity as a function of the local emissions, the local topography and the distance from the seashore. Photochemi-cal box model simulations for Freising-Weihenstephan, Ger-many for the same eclipse event suggested a 4 ppb reduction in the net O3production until the end of the eclipse. Both
measurements and model simulations showed that the par-titioning of NOxbetween NO and NO2was determined
al-most exclusively by the variations in JNO2 (Fabian et al.,
2001). Furthermore highly time-resolved measurements of O3, OH and JO1D were made at ground level during a 97%
solar eclipse at Silwood Park, Ascot, UK on 11 August 1999 (Abram et al., 2000). The observed change in the concentra-tion of OH, which decreased to below the detecconcentra-tion limit of the instrument at the maximum of the solar eclipse and the decrease of ozone shortly after maximum eclipse provided a clear demonstration of the fast photochemistry of the plane-tary boundary layer.
The present work investigates the chemical effects during the total solar eclipse of 29 March 2006 on surface ozone and other photo-oxidants over Greece. Taking advantage that part of southeastern Greece experienced the totality of solar eclipse, combined measurements of air quality and meteo-rological parameters were organized at sites located at dif-ferent distances from the eclipse path. The difdif-ferent solar obscuration at each site combined with a variety of air qual-ity measurements has enabled a thorough representation and investigation of the response of photochemistry to an abrupt photolytical perturbation.
2 Data and methods
2.1 Description of measurements
The eclipse effects during the 29 March 2006 on the bio-sphere and on various atmospheric layers have been investi-gated in the frame of a field experiment over Greece. Details about the organization of the experimental campaigns, the measurement sites, eclipse path maps as well as information about the eclipse circumstances for each location are given in an overview paper by Gerasopoulos et al. (2007). The measurements used in this study were carried out at two ur-ban sites, Pallini (greater Athens area) and Thessaloniki and at two marine rural sites, Finokalia (Crete) and Kastelorizo Island.
The Institute for Environmental Research and Sustain-able Development (IERSD) of the National Observatory of Athens (NOA), conducted measurements of gas-phase air pollutants using their automobile station in the framework of the eclipse campaign at Kastelorizo Island. This air qual-ity monitoring includes measurements of (i) ozone (O3), (ii)
nitrogen oxides (NO and NO2), and (iii) carbon monoxide
(CO), with the use of HORIBA Air Pollution Monitoring Systems (AP-360 series). The uncertainties of the field mea-surements of O3, NOxand CO for the 1-minute averages are
±3.2 ppbv for O3, ±4.0 ppbv for NOxand ±0.21 ppmv for
CO while the detection limits are 0.5 ppbv for O3, and NOx
measurements and 0.2 ppmv for CO. All air quality analyz-ers were carefully calibrated on site using specific gases of known concentration. In addition, various meteorological observations were carried out from a fully automated me-teorological station: (i) air temperature and relative humid-ity, (ii) atmospheric pressure, (iii) wind speed and direction
(6 m height), (iv) u, v and w wind components using an ultra-sound sonic anemometer, (v) total solar radiation on a hori-zontal surface, and (vi) direct solar radiation. All parame-ters were recorded with 1 min time resolution, except for the ultra-sound sonic anemometer measuring at a frequency of 21 Hz.
The monitoring station of the University of Crete at Fi-nokalia, Lasithi, Crete is located 70 km eastward of Her-aklion (about 140 thousand inhabitants) and 25 km west of Agios Nikolaos (about 20 thousand inhabitants), the near-est big cities in the area. These cities do not have any noticeable influence on the site due to the prevailing north winds. The station is located on the north coast of Crete exposed to the sea from 270◦–90◦ (W–E). An automated meteorological station enables measurements of air temper-ature, relative humidity, wind speed and direction and total solar radiation. The photodissociation rates of NO2(JNO2)
and O3 to O1D (JO1D) as well as Radon-222 (222Rn), O3,
NO, NO2, PM10, and other chemical tracers are also
moni-tored and registered every 5 min (2 h for Radon) (Mihalopou-los et al., 1997; Gerasopou(Mihalopou-los et al., 2005, 2006). Details about the station and the instrumentation are presented at http://finokalia.chemistry.uoc.gr/.
The Air Quality Monitoring Network of Athens Interna-tional Airport (AIA) operates since October 1998 and con-sists of five permanent monitoring stations and one mobile monitoring station. The permanent stations are installed in the Municipalities of Glyka Nera, Koropi, Markopoulo, Pallini and Spata while the mobile station is currently lo-cated at the airport premises. A wide range of pollutants are operationally monitored using HORIBA Air Pollution Moni-toring Systems (AP-360CE) including: nitrogen oxides (NO and NO2), sulphur dioxide (SO2), carbon monoxide (CO),
ozone (O3), particulate matter (PM10), hydrocarbons (HCs)
and benzene-toluene-xylene (BTX). Furthermore the meteo-rological parameters including wind speed and direction, air temperature, relative humidity, rainfall, solar radiation and atmospheric pressure are also measured.
In the Greater Area of Thessaloniki air quality measure-ments are carried out regularly since 2001 by the Region of Central Macedonia (RCM). This monitoring network con-sists of eight fixed monitoring stations equipped with instru-ments that measure ambient levels of gaseous (SO2, NO2,
NO, CO, O3) and particulate matter (PM10and TSP) air
pol-lutants using a HORIBA Air Pollution Monitoring Systems (AP-360 series). Most of the stations also collect meteoro-logical data (wind direction, horizontal wind speed, ambient temperature and humidity). In this study we used the data collected at the air quality measurement station situated at the roof of the Physics Department of Aristotle University of Thessaloniki (AUTH). During the day of the eclipse event, the air quality (NO, NO2and O3)and meteorological (wind
speed, wind direction, air temperature and relative humidity) measurements were recorded with 1 minute time resolution. The field measurements of O3 and NOx at Pallini,
Thessa-loniki and Finokalia exhibit similar uncertainties and detec-tions limits to those referred above for Kastelorizo.
2.2 Box modelling
The impact of the observed changes in meteorological and chemical parameters during the eclipse on the oxidant lev-els has been studied with a chemical box model (ECPL box model; Poisson et al., 2001; Tsigaridis and Kanakidou, 2002; Vrekoussis et al., 2004). The commercially available soft-ware FACSIMILE (Curtis and Sweetenham, 1988), which uses automatic time step selection and error control appro-priate to solve stiff equations like the system of non lin-ear chemical reactions occurring in the troposphere, was used to solve the differential equations with a high accu-racy required for chemistry studies. The chemistry scheme is a condensed chemical mechanism (about 300 chemical reactions and 140 chemical species). It is able to simu-late boundary layer photochemistry of ozone, water vapour, nitrogen oxides, carbon monoxide and volatile organics as well as the chemistry of sulphur. In addition to background O3/NOx/OH/CO and CH4 chemistry, it also takes into
ac-count the oxidation chemistry of C1-C5hydrocarbons
includ-ing isoprene (Tsigaridis and Kanakidou 2002; Vrekoussis et al., 2004, 2006) and biogenic sulphur oxidation mecha-nisms (Sciare et al., 2000a). Oxidation of volatile organic compounds (VOC) by all three major oxidants (O3, OH and
NO3) is considered when applicable. Heterogeneous
reac-tions of peroxy and nitrate radicals are taken into account as explained by Tsigaridis and Kanakidou (2002) and Vrekous-sis et al. (2004).
The condensed chemistry scheme of the box model has been evaluated for its ability to compute oxidant fields by comparison to a detailed chemistry scheme for C1-C5 chem-istry as shown in Poisson et al. (2001) as well as to several field observations under different conditions in the boundary layer (Poisson et al., 2001; Sciare et al., 2000b; Tsigaridis and Kanakidou, 2002; Vrekoussis et al., 2004; 2006).
Ethene, propene, ethane, propane and butanes diurnal mean mixing ratios, measured at Finokalia, Crete, in 2004 (Liakakou, 2007), are adopted in the model as initial condi-tions for all stacondi-tions due to the absence of VOC data for the other locations. Formaldehyde (HCHO) mixing ratios have been initialised to 1 ppbv (Lelieveld et al., 2002). This model version has been previously applied to evaluate on a seasonal basis the impact of isoprene chemistry on the oxidizing ca-pacity of the area (Liakakou et al., 2007).
Chemistry box model simulations have been performed over a 3-day period around the eclipse occurrence over Fi-nokalia. The first day of the simulation was used as spin up time. Observed meteorology, photodissociation rates of NO2 and O3 (JNO2 and JO1D), NO, NO2 and O3 levels
have been used as input to the model every 5 min. Reac-tion rates driven by meteorological condiReac-tions are calculated online. The model has been applied to calculate the free
radical levels in the marine boundary layer and evaluate their response to the eclipse. Simulations have been performed both by considering and by neglecting the perturbation of photodissociation rates caused by the solar eclipse.
Similar simulations have been also performed for the other observational sites, Kastelorizo, Pallini (Athens) and Thessa-loniki for the day of the eclipse.
2.3 Regional Air-quality modeling
The regional air quality model simulations have been per-formed with the Comprehensive Air quality Model (CAMx version 4.40). CAMx ran with grid spacing over Greece in a spatial resolution of 10×10 km and four fine nests with higher resolution (2×2 km) over the Greater Athens and Thessaloniki areas, Kastelorizo and Finokalia. The domain’s vertical profile contains 15 layers of varying thickness. Layer 1 is 22 m deep, layer 2 extends between 22 and 50 m and sub-sequent layer depths increase with height. The uppermost layer is 1.5 km thick and extends to about 8 km.
The meteorological fields have been derived from the Weather Research and Forecasting (WRF version 2.1.2, Jan-uary 2006) Model developed at the National Center for At-mospheric Research, operated by the University Corporation for Atmospheric Research. WRF has been modified accord-ingly to reproduce the event of eclipse (Founda et al., this is-sue). The first model domain covers the Balkan area (55×55 grid boxes with 30×30 km resolution), the second domain covers Greece (nested domain with 121×121 grid boxes and 10×10 km resolution). The four domains with finer reso-lution (2×2 km) cover the measuring sites (Athens, Thessa-loniki, Kastelorizo, Finokalia). In the vertical WRF model 31 layers between surface and 18.5 km were considered.
Anthropogenic and biogenic gridded emissions have been compiled for a coarse master domain covering Greece (98×108 cells, 10×10 km) and for the four nested grids with finer resolution (2×2 km). Emission data for gaseous pollu-tants (NMVOC, NOx, CO, SO2, NH3)and particulate
mat-ter (PM10)were estimated for different anthropogenic
emis-sion sectors such as transport, power plants, the industrial and central heating sectors. Anthropogenic emissions of the neighbouring countries (Albania, Bulgaria and Turkey) have been taken from the EMEP emission database. Diurnal biogenic emissions over Greece and neighbouring countries have been calculated for every month of the year following the EMEP/CORINAIR methodology (Poupkou et al., 2004). All emissions are injected in the first model layer of 22 m height.
Three days of simulation are regarded as “spin-up” time (26–28 March 2006) in order to eliminate the effect of initial conditions. Initial and boundary conditions corresponded to concentrations of clean air. The chemistry mechanism in-voked is Carbon Bond version 4 (CB4) reviewed by Dodge (2000). This mechanism includes 117 reactions – 11 of which are photolytic – and up to 67 species (37 gasses, 12
radicals and up to 18 particulates). Photolysis rates were de-rived for each grid cell assuming clear sky conditions as a function of five parameters: solar zenith angle, altitude, to-tal ozone column, surface albedo, and atmospheric turbid-ity. The rates were taken from a large lookup table that spans the range of conditions for each of the five dimen-sions. This table has been developed using the TUV pho-tolysis pre-processor following the discrete ordinates method (Madronich, 1993).
The major accomplishment of introducing the eclipse ef-fect in the model parameterizations was to insert the eclipse path into the model’s subroutines in such a way that affects only a specific area on Earth’s surface in a time-dependent manner. The photolysis rate variation was introduced by the use of factor per(lat,lon,t), which was related to the distance from the centre of the eclipse shadow, the latter considered as a circle moving on Earth with a specific velocity. Every time the photolysis rates were calculated, the distance of each grid point from the centre of the shadow was changing accord-ing to the formula applied. Photolysis rates thus have been modified for the eclipse event (09:30–12:00 UTC) by multi-plication of the clear-sky photolysis rates Jclearwith a factor
per which actually simulated the differences in sun disk cov-erage and was given as a function of latitude, longitude and time per(lat,lon,t).
The presence of clouds modifies further Jclearaccording to
the equation:
J=per(lat, lon, t) ∗ [1 + Fc(Ac−1)] ∗ Jclear (1)
where Fc is the cloud cover fraction – introduced into the model by the input of meteorological fields – and Acis the vertical cloud attenuation factor, calculated separately for above and within/below clouds:
Ac=1 + (1 − t )cosφ above cloud layer (2)
Ac=1.6 t cosφ within /below cloud layer where φ is solar zenith angle and t the energy transmission coefficient. A more detailed description of the calculation of photolysis rates and the cloud attenuation factor are given in CAMx User’s Guide (2006).
In order to analyse the photochemical model performance the Process Analysis (PA) tool has been invoked. The PA tool, implemented in CAMx, allows for a better understand-ing of the complex interactions in different processes and simulation results within the context of model formulation (CAMx User’s Guide, 2006). Besides the standard gaseous species concentrations involved in tropospheric chemistry (NOx, O3and VOCs) PA allows retrieval of information on
parameters calculated by CAMx, like O3production,
Table 1. Observations and simulations with CAMx of O3, NO2
and NO averaged over the time window 09:30–12:00 UTC when the eclipse took place for the sites Kastelorizo, Finokalia, Pallini and Thessaloniki. The standard deviation is given in parenthesis. The mean bias between modelled and observed values, calculated from the formula (1/N)P(modi-obsi) for the same time window,
is also indicated as well as the maximum total solar obscuration for each site. O3(ppbv) NO2(ppbv) NO (ppbv) Maximum solar obscuration (%) Kastelorizo 100 Obs 68.60 (±4.26) 1.57 (±1.40) 0.02 (±0.01) CAMx 51.74 (±0.58) 0.17 (±0.01) 0.39 (±0.28) Mean Bias −16.01 −1.73 −0.41 Finokalia 95.6 Obs 42.72 (±2.48) 0.34 (±0.13) 0.07 (±0.02) CAMx 43.48 (±0.55) 0.30 (±0.04) 0.05(±0.02) Mean Bias 1.19 −0.05 −0.02 Pallini, Athens 84 Obs 36.87 (±3.59) 15.59 (±3.42) 4.83 (±1.13) CAMx 34.78 (±6.40) 19.03 (±7.30) 6.21 (±4.28) Mean Bias −2.25 3.61 3.62 Thessaloniki 75.1 Obs 43.47 (±4.31) 12.11 (±2.69) 1.89 (±1.16) CAMx 42.48 (±3.35) 11.75 (±2.80) 3.22 (±0.50) Mean Bias −1.80 3.10 5.41 3 Results 3.1 Measurements
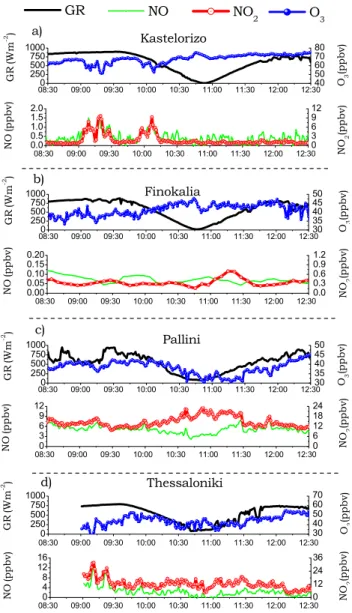
The time series of measured O3, NO2and NO and solar
radi-ation for the four different sites during the day of eclipse are illustrated in Fig. 1 while the average concentrations of the chemical constituents during the time window of the eclipse from 09:30 to 12:00 UTC are shown in Table 1. Based on the NOx levels at these four sites the maritime stations of
Finokalia and Kastelorizo can be considered as relatively un-polluted to semi-un-polluted sites while the suburban/urban sta-tions of Pallini (Athens) and Thessaloniki are polluted sites. At Kastelorizo (Fig. 1a) no major signal of solar eclipse on surface O3, NO2 and NO concentrations can be deduced
from the observations. The only striking features are the two pollution plumes with peak concentrations of NOx(about 90
and 15 ppbv for NO2and NO, respectively) and the
subse-quent lower concentrations of O3prior and just after the
be-ginning of the solar eclipse. Similarly at Finokalia (Fig. 1b) no drastic changes are seen on O3, NO2and NO
concentra-tions due to the solar eclipse.
The solar eclipse effects on O3, NO2and NO
concentra-tions are more clearly marked on the measurements at Pallini station (Fig. 1c). O3 and NO concentrations show a
grad-ual decrease from the first contact until the maximum cov-erage, while during the second phase ozone gradually in-creases reaching its prior to the eclipse levels. An oppo-site pattern is seen on the NO2 concentrations as the NO2
08:30 09:00 09:30 10:00 10:30 11:00 11:30 12:00 12:30 0.0 0.5 1.0 1.5 2.0 0 3 6 9 12 08:300 09:00 09:30 10:00 10:30 11:00 11:30 12:00 12:30 250 500 750 1000 40 50 60 70 80 08:30 09:00 09:30 10:00 10:30 11:00 11:30 12:00 12:30 0.00 0.05 0.10 0.15 0.20 0.0 0.3 0.6 0.9 1.2 08:30 09:00 09:30 10:00 10:30 11:00 11:30 12:00 12:30 0 250 500 750 1000 30 35 40 45 50 08:30 09:00 09:30 10:00 10:30 11:00 11:30 12:00 12:30 0 3 6 9 12 0 6 12 18 24 08:300 09:00 09:30 10:00 10:30 11:00 11:30 12:00 12:30 250 500 750 1000 30 35 40 45 50 08:30 09:00 09:30 10:00 10:30 11:00 11:30 12:00 12:30 0 4 8 12 16 0 12 24 36 08:30 09:00 09:30 10:00 10:30 11:00 11:30 12:00 12:30 0 250 500 750 1000 30 40 50 60 70 NO Kastelorizo NO2 GR O 3 Finokalia c) b) d) N O2 (p p b v) Pallini O3 (p p b v) G R (W m -2 ) N O (p p b v) N O (p p b v) G R (W m -2) N O (p p b v) G R (Wm -2 ) N O (p p b v) G R (W m -2) O3 (p p b v) N O2 (p p b v) O3 (p p b v) N O2 (p p b v) O3 (p p b v) N O2 (p p b v) a) Thessaloniki
Fig. 1. Time series of O3, NO, NO2 and global radiation at
Kastelorizo, Finokalia, Pallini and Thessaloniki during the eclipse day of 29 March 2006 from 08:38 to 12:28. Time is expressed in UTC.
builds up during the eclipse. The O3, NO2and NO
measure-ments at Thessaloniki show similar behaviour with Pallini but with higher variability. The ozone decline at Thessa-loniki during the eclipse is between 5 and 10 ppbv while NO values drop below the detection limit of the instrument dur-ing the maximum coverage of the solar disk. The differences in O3, NO2 and NO concentrations between their averaged
values in the time window of maximum total solar obscu-ration (10:30–11:00 UTC) and their averaged values from both the time windows before and after the eclipse (09:30– 10:00 UTC and 11:30–12:00 UTC) reveal O3 decrease by
−8 and −4 ppbv, NO decrease by −1 and −2 ppbv and NO2increase by 2, and 6 ppbv for Thessaloniki and Pallini,
Table 2. Correlation coefficients of observed O3, NO2 and NO
with observed Global Radiation (GR) over the time window 09:30– 12:00 UTC when the eclipse took place for the sites Kastelorizo, Finokalia, Pallini and Thessaloniki.
O3vs GR NO2vs GR NO vs GR
Kastelorizo −0.27 0.27 0.21 Finokalia −0.51 −0.04 0.11 Pallini, Athens 0.71 −0.82 0.59 Thessaloniki 0.63 0.02 0.58
the time window 10:30–11:00 UTC is ∼86% for Kastelorizo,
∼82% for Finokalia, ∼76 % for Pallini (Athens) and ∼71% for Thessaloniki.
The similar behaviour of O3, NO2and NO concentrations
at the two polluted sites, Pallini and Thessaloniki, can be at-tributed to perturbation of the photostationary state of O3,
NO and NO2during the eclipse, with NO2formed from the
reaction of O3with NO and not efficiently photolysed. The
net effect is a decrease in O3and NO while NO2is
accumu-lated.
The fact that the response of observed O3, NO2and NO to
the solar eclipse is mainly indicated at the two polluted sites (Thessaloniki and Pallini) and not at the relatively unpolluted sites (Kastelorizo and Finokalia) is also depicted in Table 2, which presents the correlation coefficients of observed O3,
NO2 and NO with observed global radiation (GR) over the
time window 09:30–12:00 UTC when the eclipse took place. Specifically, at the polluted sites we note a positive corre-lation of O3 and NO with GR and a negative correlation of
NO2with GR. This can be attributed to the fact that during
the evolution of the solar eclipse the decrease of solar ra-diation is associated with a decrease in O3 and NO and an
increase in NO2in accordance with theoretical expectations
from the perturbation of the photostationary state of O3, NO
and NO2. The only exception is the lack of correlation
be-tween NO2and GR at Thessaloniki.
In contrast at the two relatively unpolluted sites we note a negative correlation of O3with GR which means that the
decrease of solar radiation during the eclipse is surprisingly associated with an increase in O3. Furthermore we note a
lack of statistical significant correlation (at the 95% confi-dence level) of NO and NO2with GR. These results do not
corroborate with our expectations from the perturbation of photostationary state of O3, NO and NO2during the eclipse
and point to longer lifetimes of these species and local to re-gional transport effects masking the eclipse effects.
In order to quantify the magnitude of the solar eclipse ef-fect on these species chemical box modelling and regional air-quality modelling have been used at all four sites as it is discussed in the following Sects. 3.2 and 3.3.
0 6 12 18 24 30 36 42 48 54 60 66 72 0 1 2 3 0 6 12 18 24 30 36 42 48 54 60 66 72 0 3 6 9 12 (b)
(a) Solar eclipse at Finokalia (observations)
Hour starting on 28 March 2007 at 0:00
J (N O2 ) (1 0 -3s -1) J (O 1D ) (1 0 -5s -1) JO1D 0 3 6 9 JNO2
Solar eclipse at Finokalia (model)
N O3 ( p p tv) O H (1 0 6 ra d ica ls . cm -3 ) H O2 ( 1 0 8 rad ical s .cm -3) OH HO 2 0 1 2 3 4 NO 3
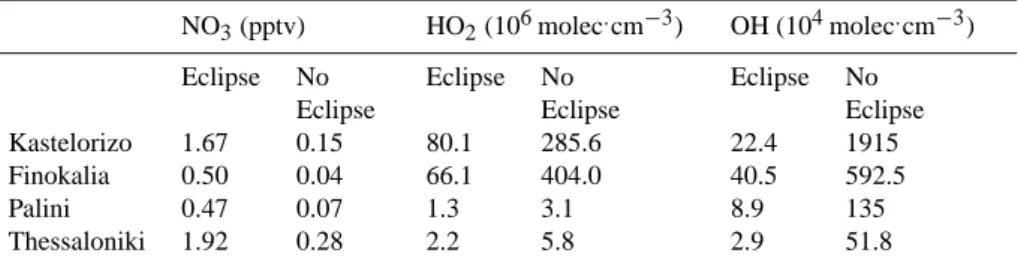
Fig. 2. (a) Measured photolysis rates of NO2(JNO2) and O3(JO1D)
at Finokalia over a 3 days period around the eclipse of the 29th of March 2006. (b) hydroxyl (OH), hydrogen peroxy (HO2) and nitrate (NO3) radical levels simulated by the chemical box model
for Finokalia during these 3 days. Time is expressed in UTC.
3.2 Box model results
Driven by the observed JNO2 and JO1D variations during
the eclipse period (Fig. 2a), the box model simulates a sharp change from daytime to nighttime chemistry as depicted in Fig. 2b for Finokalia station. During the eclipse period hy-droxyl (OH) and hydrogen peroxy (HO2)radicals, mainly
photochemically produced, show rapid decrease by more than an order of magnitude to nighttime levels. Such rapid changes in OH radical concentrations have been indeed mea-sured by Abram et al. (2000) during the 97% solar eclipse at Silwood Park, Ascot, UK in August 1999. Simultane-ously our model simulations show that nitrate (NO3)radical
– mainly present during night – is increasing to the pptv level typical of nighttime conditions over the area (Vrekoussis et al., 2006, 2007).
Similar conclusions are drawn from the box model simu-lations for the other observational sites. This is evident from Table 3, which shows the concentrations of NO3, HO2 and
OH for eclipse and non-eclipse conditions in box model sim-ulations at the time of maximum solar obscuration for all four sites. Specifically averaged within the window of the eclipse maximum (10:30–11:00 UTC), OH radicals decrease by more than 93% at all sites while HO2radicals decrease by
about 84% at Finokalia, 72% at Kastelorizo, 62% at Thessa-loniki and 58% at Pallini. Finally the NO3radicals increase
in the window of the maximum solar obscuration and reach around 2 ppbv at Kastelorizo and Thessaloniki, and 0.5 pptv at Finokalia and Pallini. In Table 3 we also note that HOx
(HO2+OH) levels are lower at the polluted sites than at the
relatively unpolluted sites as HOx levels are suppressed at
Table 3. Concentrations of NO3, HO2and OH for eclipse and non-eclipse conditions in box model simulations at the window of maximum
solar obscuration (10:30–11:00 UTC) for the sites Kastelorizo, Finokalia, Pallini and Thessaloniki.
NO3(pptv) HO2(106molec.cm−3) OH (104molec.cm−3)
Eclipse No Eclipse No Eclipse No Eclipse Eclipse Eclipse Kastelorizo 1.67 0.15 80.1 285.6 22.4 1915 Finokalia 0.50 0.04 66.1 404.0 40.5 592.5 Palini 0.47 0.07 1.3 3.1 8.9 135 Thessaloniki 1.92 0.28 2.2 5.8 2.9 51.8
According to our box model simulations for Kastelorizo, during day, outside the eclipse period, OH radicals are 40 times and almost 3 orders of magnitude more effective than NO3 radicals in oxidizing DMS and isoprene, respectively.
During the eclipse this pattern is reversed and NO3radicals
are the most efficient oxidant being 70 times and 4 orders of magnitude more efficient than OH in oxidizing DMS and isoprene, respectively.
This drastic and sudden change from daytime to nighttime chemistry during the eclipse has also markedly affected the modelled O3budget changes simulated by the chemical box
model for Finokalia (location with 95.6% coverage). Indeed, comparing simulations both by considering and by neglect-ing the perturbation of photodissociation rates due to the solar eclipse, it was calculated a mean decrease in the net ozone production rate (NetPO3=PO3-QO3)of 1.20 ppbv/h
(see Table 5) when integrated over the eclipse period (09:30-12:00; Fig. 3b). The O3production term (PO3)was
calcu-lated by the photolysis of NO2to NO after substracting the
titration of O3by NO while the O3loss term (QO3)was
de-rived from the rate of the O1D reaction with H2O and of O3
reactions with HOx and with unsaturated hydrocarbons. A
slightly higher change in NetPO3of −1.83 ppbv/h was
cculated by the box model for Kastelorizo (location with al-most 100% coverage) averaged between the time window 09:30 and 12:00 UTC (see Table 5). Even higher changes in NetPO3 averaged between 09:30 and 12:00 UTC have been computed for Thessaloniki (7.65 ppbv/h) that is an ur-ban location with smaller eclipse coverage whereas the high-est changes have been computed for Pallini (38.33 ppbv/h) that experiences the highest NO levels among the studied sites. Note that these budget calculations do account for the titration of O3by NO that significantly affects O3levels in
polluted regions, like Thessaloniki and Pallini. In parallel NO2increases due to the absence of NO2photodissociation
as indicated by the observed almost zero JNO2values.
3.3 Regional air quality model results
As described in Sect. 2.3 CAMx calculated the diurnal vari-ation of the photolysis rate JNO2for eclipse and non-eclipse
0 6 12 18 24 0 1 2 3 24 30 36 42 48 0 3 6 9 12 0 6 12 18 24 (b)
(a) Eclipse at Finokalia 29th of March
P O3 Q O3 ( p p b v .h -1) PO3 - QO3 (eclipse) PO 3 - QO3 (no eclipse) N O3 ( p p tv) O H (1 0 6 ra d ica ls . cm -3 ) H O2 ( 1 0 8 ra d ica ls . cm -3 ) OH_base_run HO2_base_run OH_day_before HO2_day_before 0 1 2 3 4 NO 3_base_run NO3_day_before
Fig. 3. (a) Net O3 chemical production (NetPO3=PO3-QO3) at
Finokalia during the day of the eclipse, 29th of March 2006, simulated by considering the effect of eclipse of photolysis rates (NetPO3 base-run) and by neglecting it (NetPO3 jdaybefore) (b) as (a) but for OH, HO2 and NO3 radical levels. Time is
ex-pressed in UTC. NetPO3=PO3–QO3, where PO3=6RRO2NONO,
QO3=O1D+H2O, alkenes + O3
conditions. An example for these calculations is shown in Fig. 4. NO2 photolysis rates (black curve) follow a
sinu-soidal curve increasing gradually after 04:00 UTC and re-turning to almost zero values after around 16:30 UTC. When considering the eclipse in the calculations (magenta curve), the modelled NO2 photolysis rates gradually decrease
af-ter 09:30 UTC to minimize at around 11:00 UTC and one hour later return to the non-eclipse values. It should be noted the good level of agreement at Finokalia between the modelled JNO2 values and the observed JNO2 values
(Fig. 4b). The maximum of the observed JNO2 values is
around 8.1×10⁻³s−1 while the respective value calculated in CAMx is 7.6×10⁻³s−1. The relative reduction of photol-ysis rates is space dependent according to the distance from the centre of the eclipse shadow. In order to depict the impact of eclipse on JNO2over the whole modelling region, the
0 2 4 6 8 10 12 14 16 18 20 22 24 0.0 2.5x10⁻³ 5.0x10⁻³ 7.5x10⁻³ 1.0x10⁻² 0 2 4 6 8 10 12 14 16 18 20 22 24 0.0 2.5x10⁻³ 5.0x10⁻³ 7.5x10⁻³ 1.0x10⁻² 0 2 4 6 8 10 12 14 16 18 20 22 24 0.0 2.5x10⁻³ 5.0x10⁻³ 7.5x10⁻³ 1.0x10⁻² 0 2 4 6 8 10 12 14 16 18 20 22 24 0.0 2.5x10⁻³ 5.0x10⁻³ 7.5x10⁻³ 1.0x10⁻² c) Observations (eclipse) d) b) a) Thessaloniki Pallini Finokalia
J
N
O
2(
s
-1)
With eclipse No eclipse
Kastelorizo
Time (UTC)
Fig. 4. Diurnal variation of the photolysis rate constant J(NO2)
values calculated in CAMx simulations for eclipse and non-eclipse conditions at Kastelorizo, Finokalia, Pallini and Thessaloniki. The observed J(NO2) values for Finokalia are also indicated.
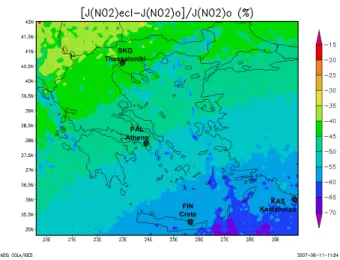
was plotted over the master domain (here subscript “o” de-noting simulations without eclipse and “ecl” simulation with eclipse) averaged for the time window 10:00–11:00 UTC (Fig. 5). A decrease in JNO2of 60–65 % was calculated for
Kastelorizo and 55–60% for Finokalia, 45–50 % for Pallini (Athens) and 40–45% for the Thessaloniki.
The values of O3, NO2and NO simulated by CAMx and
averaged over the time window 09:30–12:00 UTC when the eclipse took place for the four different sites are also shown in Table 1 for comparison with observations. Furthermore in order to have a measure of the model performance the mean bias between modelled and observed values was cal-culated from the formula (1/N)P(modi-obsi) for the time window 09:30–12:00 UTC. From the calculation of the mean bias is clearly evident that the model simulation for O3 at
Kastelorizo presents the largest uncertainty with a mean bias of 16 ppbv while for NOxwe have the largest percentage
un-certainty.
Comparing the simulations with the observations the fol-lowing remarks can be made:
KAS Kastelorizo FIN Crete PAL Athens SKG Thessaloniki
Fig. 5. Percentage decrease of NO2photolysis rates averaged for
the time window 10:00–11:00 UTC over the master modeling do-main. The four dots show the four observational sites.
1. The simulated O3 at Kastelorizo is significantly lower
than the observations. Similarly the simulated NOx
lev-els are underestimated compared to the observations, possibly due to generally underestimated anthropogenic emissions over Turkey, which lies only a few kilometers away from Kastelorizo and/or to the clean-atmosphere boundaries that was assumed for this run: Kastelorizo is the easternmost Greek island close to the edges of our domain.
2. At Finokalia both the simulated O3 and NOx values
agree with the observations.
3. The modelled O3, NO2 and NO values at Pallini and
Thessaloniki compare rather well with the respective observations.
4. Both the observed and modelled O3 levels at Pallini
are lower than at Thessaloniki by a few ppbv whereas both the observed and modelled NOxlevels at Pallini
are slightly higher than at Thessaloniki. This pattern is coherent with the non-linear behaviour in O3
produc-tion that associates an increase in NOxin these highly
polluted sites with a suppression of O3production.
The average differences of O3, NO2 and NO between
eclipse and non-eclipse conditions in CAMx simulations over the time window of the eclipse (09:30–12:00 UTC) and for maximum coverage of the sun-disk for the four sites are indicated in Table 4. At the relatively unpolluted sites of Kastelorizo and Finokalia, the CAMx simulations indicate an ozone decrease of only −0.4 ppbv for Kastelorizo and
−1.0 ppbv for Finokalia at the time of the maximum cov-erage of the sun-disk. These values are smaller than the stan-dard deviation of the ozone measurements during the time
Table 4. Differences of O3, NO2and NO between eclipse and non-eclipse conditions in CAMx simulations over the time window of
the eclipse 09:30–12:00 UTC for the sites Kastelorizo, Finokalia, Pallini and Thessaloniki. The values in parentheses correspond to the respective values of differences for the maximum sun coverage. The differences from the observations of O3, NO2and NO between their
averaged values in the time window of maximum total solar obscuration 10:30–11:00 UTC and their averaged values from both the time windows before and after the eclipse (09:30–10:00 UTC and 11:30–12:00 UTC) are also provided for comparison.
1O3(ppbv) Obs 1NO2(ppbv) Obs 1NO (ppbv) Obs
Model Model Model
Kastelorizo −0.3 (−0.4) 0.8 0.03 (0.06) −0.35 −0.01 (−0.03) −0.06 Finokalia −0.7 (−1.0) 2.3 0.06 (0.11) −0.07 −0.02 (−0.05) 0.00 Pallini, Athens −4.1 (−6.4) −4.0 3.41 (5.75) 5.56 −2.35 (−4.99) −2.10 Thessaloniki −5.8 (-10.6) −8.4 3.44 (7.3) 1.84 −0.19 (−1.25) −0.93
window of the eclipse for both sites (see Table 1). Specif-ically the standard deviation of the ozone measurements for the time window 09:30–12:00 UTC is 4.3 ppbv at Kastelorizo and 2.5 ppbv at Finokalia. Hence comparing the simulated from CAMx eclipse effect on ozone with the short-term ob-served ozone variability it is easily conceived why a clear evidence of the solar eclipse on O3cannot be supported for
both Kastelorizo and Finokalia (Fig. 1). Similarly the CAMx simulations indicate only small changes for NO and NO2for
Kastelorizo and Finokalia during the solar eclipse. In partic-ular, increases in NO2of 0.06 and 0.11 ppbv and decreases
in NO of 0.03 and 0.05 ppbv have been calculated at the time of the maximum coverage of sun-disk for Kastelorizo and Finokalia, respectively. It should be further noted from Table 4 that the differences from the observations of O3, NO2
and NO between their averaged values in the time window of maximum total solar obscuration (10:30–11:00 UTC) and their averaged values from both the time windows before and after the eclipse (09:30–10:00 UTC and 11:30–12:00 UTC) are generally not consistent with the CAMx calculations of the eclipse effects on these species. This inconsistency points to the fact that at these relatively unpolluted sites the eclipse effects on the observations of O3, NO2and NO are masked.
Mind also that the changes in O3, NO2and NO between
eclipse and non-eclipse conditions in the CAMx simulations for Kastelorizo are smaller than for Finokalia even though at Kastelorizo there was almost 100% sun coverage. This discrepancy can be attributed to the lower pollution levels at Kastelorizo in CAMx runs. Hence we anticipate that the CAMx simulations of the changes in O3, NO2and NO
be-tween eclipse and non-eclipse conditions for Kastelorizo are underestimated because of the underestimation of O3 and
NOx levels in the CAMx results compared to observations (see Tables 1 and 2), earlier discussed.
At the polluted sites the CAMx simulations indicate an ozone decrease of 6.4 ppbv for Pallini and 10.6 ppbv for Thessaloniki at the time of the maximum coverage of the sun-disk. The CAMx simulated O3change between eclipse
and non-eclipse conditions integrated over the time window
of the eclipse 09:30–12:00 UTC is −4.1 ppbv for Pallini and
−5.8 ppbv for Thessaloniki (see also Table 4). These sim-ulated ozone decreases due to the solar eclipse are in good agreement with the in-situ ozone observations at the two pol-luted sites (see Table 4). For example, the difference in the observed O3between the averaged value in the time window
of maximum total solar obscuration (10:30–11:00 UTC) and the averaged values from both the time windows before and after the eclipse (09:30–10:00 UTC and 11:30–12:00 UTC) is −8 and −4 ppbv for Thessaloniki and Pallini, respectively. Furthermore, CAMx simulations indicate a decrease in NO of −2.55 ppbv and an increase in NO2 of 3.41 ppbv
for Pallini over the time window of the eclipse 09:30– 12:00 UTC. The observations of NO and NO2at Pallini
tak-ing the difference between the time window of the maxi-mum coverage of the sun disk and the time windows be-fore and after the completion of the solar eclipse indicate a NO decrease of −2.1 ppbv and NO2increase of 5.6 ppbv.
The CAMx simulations at Thessaloniki indicate a decrease in NO of −0.19 ppbv and an increase in NO2of 3.44 ppbv over
the time window of the eclipse 09:30–12:00 UTC whereas the observations indicate NO decrease of about −1 ppbv and NO2 increase of about 2 ppbv. Hence the CAMx simulated
values of the differences of O3, NO2and NO between eclipse
and non-eclipse conditions compare reasonably well with ob-servations for both Pallini and Thessaloniki.
The lifetime of any chemical species in equilibrium can be defined by the concentration of this chemical species di-vided with its destruction or production rate. In the back-ground atmosphere the ozone gas phase destruction rate is basically determined from fractional ozone photolysis in re-actions (R4) and (R5) as well as rere-actions of ozone with HOx (HO2+OH) radicals in reactions (R8) and (R9). The
chemical process analysis in CAMx calculates the ozone de-struction rate due to the above mentioned processes and other ozone destruction pathways including ozone titration by NO and ozone reaction with alkenes. We calculated the ozone lifetime based on CAMx simulated fields for the four sites for both the eclipse and non-eclipse conditions. For the two
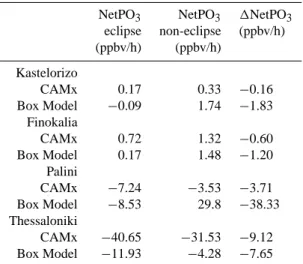
Table 5. Net O3chemical production (NetPO3=PO3-QO3) at the
four studied sites for eclipse and non-eclipse conditions over the time window of eclipse 09:30–12:00 UTC in CAMx and Box Model as well as their difference 1NetPO3 between eclipse and
non-eclipse conditions.
NetPO3 NetPO3 1NetPO3
eclipse non-eclipse (ppbv/h) (ppbv/h) (ppbv/h) Kastelorizo CAMx 0.17 0.33 −0.16 Box Model −0.09 1.74 −1.83 Finokalia CAMx 0.72 1.32 −0.60 Box Model 0.17 1.48 −1.20 Palini CAMx −7.24 −3.53 −3.71 Box Model −8.53 29.8 −38.33 Thessaloniki CAMx −40.65 −31.53 −9.12 Box Model −11.93 −4.28 −7.65
relatively unpolluted sites, Kastelorizo and Finokalia, the ozone lifetime is about 2.7 days for non-eclipse conditions and becomes around 6.5 days for eclipse conditions. The first point to be mentioned is that for such ozone lifetimes it is sensible that we do not clearly see an abrupt and major signal of solar eclipse on surface O3as in this timescale local
to regional scale transport effects may mask the eclipse ef-fects. The second point to be noted is that the ozone lifetime increases as we move from non-eclipse to eclipse conditions which can be explained by the fact that in the relatively un-polluted atmosphere (far from high NOxemission areas) the
ozone loss terms are reduced during the eclipse as both HOx
and JO1D levels are reduced. For the polluted sites, Thessa-loniki and Pallini, the ozone lifetimes are much smaller be-ing 1.3 h and 3 h for eclipse conditions and 1.9 h and 7.8 h for non-eclipse conditions, respectively, which can be explained by the fact that in high NOx emission areas there is rapid
ozone destruction by NO-titration dominating over the other ozone loss terms (CAMx version 4.40, 2006). In contrast to the relatively unpolluted sites, at the two polluted sites we note that the ozone lifetime decreases as we move from non-eclipse to non-eclipse conditions. This can be attributed to the fact that ozone during the eclipse continues to be removed by its reaction with NO (R3) without being efficiently reproduced by NO2photolysis in reaction (R1).
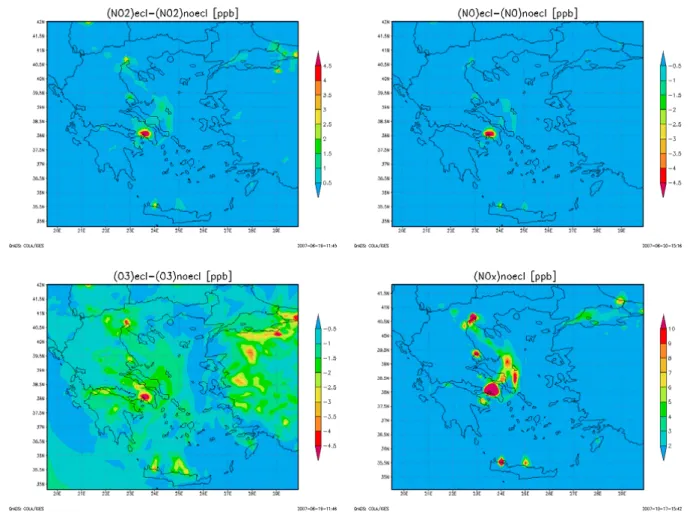
The eclipse effect over Greece as calculated by CAMx is depicted in Fig. 6 that shows the differences in NO2, NO
and O3 between eclipse and non-eclipse conditions for the
first model level Z1(<22 m) averaged over the time window 10:00–11:00 UTC. Over Greece the maximum impacts of the eclipse on O3, NO2and NO are calculated to occur over
the large urban agglomerations of Athens, and Thessaloniki where the maximum of the emissions occur. Furthermore, we note a stripe at the western Aegean Sea with notable eclipse effects on these air pollutants which might be associated to ship emissions since ship trails coincide in space.
Comparing the net O3 production calculated by the box
model and by the regional air-quality model (see Table 5) we note a relatively good agreement at Finokalia and Thes-saloniki for the difference 1NetPO3 (between NetPO3 for
eclipse and NetPO3for non-eclipse conditions) when
inte-grated over the eclipse window. At Pallini and Kastelorizo we also note a rather good comparison between CAMx and box model calculations for NetPO3 for eclipse
condi-tions (0.17 ppbv/h in CAMx versus −0.09 ppbv/h in box model for Kastelorizo and −7.24 ppbv/h in CAMx ver-sus −8.53 ppbv/h in box model for Pallini). However the NetPO3 for non-eclipse conditions in box model
calcula-tions is higher than in CAMx calculacalcula-tions which is also reflected in the comparison of 1NetPO3 (−0.16 ppbv/h in
CAMx versus −1.83 ppbv/h in box model for Kastelorizo and −3.71 ppbv/h in CAMx versus −38.33 ppbv/h in box model for Pallini). Indeed the box model calculations over-estimate the impact of the eclipse on NetPO3at Kastelorizo
and Pallini in comparison with CAMx calculations but at least they have similar sign. For the case of Kastelorizo, as earlier discussed this underestimation in CAMx compared to box model could be attributed to generally underesti-mated anthropogenic emissions over Turkey and/or to clean-atmosphere boundaries conditions assumed for the CAMx run at the edge of our domain where the Kastelorizo is lo-cated. Furthermore it should be kept in mind that differences between CAMx and box model calculations for the eclipse effect may also rise from the fact that the box model eval-uates the in-situ effect of eclipse on O3 production
result-ing from the photolysis rates changes alone whereas the re-gional model in addition accounts for air masses mixing due to transport.
4 Summary and conclusions
The present work investigated the chemical effects of the so-lar eclipse of 29 March 2006 on surface air quality levels over Greece based on observations at a number of sites in con-junction with chemical box modelling and 3-D air-quality modelling. Emphasis has been given on surface ozone and other photooxidants at four Greek sites Kastelorizo, Fi-nokalia (Crete), Pallini (Athens) and Thessaloniki, which are located at gradually increasing distances from the eclipse path and are characterized by different air pollution levels. The different solar obscuration at each site combined with a variety of environments, by means of air quality level, namely polluted urban/suburban (Thessaloniki, Pallini), and relatively unpolluted coastal (Finokalia, Kastelorizo) enabled
Fig. 6. Differences of NO2, NO and O3between eclipse and non-eclipse conditions in CAMx simulations over the master modeling domain for the first model level Z1 (<22 m) averaged for the time window 10:00–11:00 UTC. The NOx concentrations for the non-eclipse simulation is also illustrated to indicate the areas with high levels of pollution.
a thorough investigation of the response of photochemistry to an abrupt photolytical change.
At the relatively unpolluted sites of Kastelorizo and Fi-nokalia no clear impact of solar eclipse on surface O3, NO2
and NO concentrations can be deduced from the observations and model simulations. The observations corroborate with chemical box modelling and 3-D air-quality modelling. O3
at Finokalia has been associated with a mean decrease in the net ozone production rate of 1.20 ppbv/h (box model) and 0.60 ppbv/h (CAMx) when integrated over the eclipse period (09:30–12:00 UTC). Similarly, at Kastelorizo (location with almost 100% coverage) O3has been associated with a mean
decrease in the net ozone production rate of 1.83 ppbv/h (box model) and 0.16 ppbv/h (CAMx). Such changes in the net ozone production between eclipse and non eclipse condi-tions, as calculated by both box and 3-D air quality models, are rather small compared to the short-term ozone variability. Furthermore the ozone lifetime is in the range of a few days
at these sites and hence the solar eclipse effects on ozone can be easily masked by local and regional transport.
At the polluted urban and suburban sites of Thessaloniki and Pallini, respectively, solar eclipse effects on O3, NO2and
NO concentrations are clearly indicated from both the mea-surements and 3-D air-quality modelling. The net effect is a decrease in O3and NO while NO2is accumulated. The
com-mon behaviour of O3, NO2and NO concentrations at the two
polluted sites, Pallini and Thessaloniki, can be attributed to their perturbation from the photostationary state of O3, NO
and NO2during the eclipse, with NO2formed from the
re-action of O3 with NO while at the same time NO2 is not
efficiently photolysed.
The fact that the response of observed O3, NO2and NO to
the solar eclipse is mainly indicated at the two polluted sites (Thessaloniki and Pallini) and not at the relatively unpolluted sites (Kastelorizo and Finokalia) is also depicted from the correlation coefficients of observed O3, NO2 and NO with
observed GR. Specifically, at the polluted sites we note a pos-itive correlation of O3and NO with GR and a negative
corre-lation of NO2with GR in accordance with a perturbation of
the photostationary state of O3, NO and NO2. In contrast at
the two relatively unpolluted sites we note a negative correla-tion of O3with GR and a lack of correlation of NO and NO2
with GR.
Box model calculations also demonstrated the rapid de-crease of the photochemically produced OH and HO2
radi-cals to nighttime levels at all four sites during the eclipse pe-riod. Simultaneously the NO3radical concentration, which
is the main nighttime oxidant species, increased at all sites to the pptv level reaching even 4 pptv at Kastelorizo.
The 3-D air quality modelling over Greece simulates the maximum effects of the eclipse on O3, NO2 and NO at
the large urban agglomerations of Athens, and Thessaloniki where the maximum of the emissions occur.
The net O3production (NetPO3)and the impact of
chang-ing photolysis rates on it (1NetPO3)calculated by the box
model and by the regional air-quality model agree reason-ably well when integrated over the eclipse window at Fi-nokalia but is underestimated by CAMx for Kastelorizo. This underestimation is linked to an underestimation of CAMx O3, and NOxlevels which could be in turn due to generally
underestimated anthropogenic emissions over Turkey and/or the fact that Kastelorizo is close to the edge of our domain with clean-atmosphere boundaries conditions assumed for the CAMx run.
Acknowledgements. Compilation and presentation of this work
has been facilitated by the ACCENT –EU network of excellence. Support by a research and education PYTHAGORAS II grant co-funded by the Greek Ministry of Education (25%) and the European Social Fund (75%) is acknowledged. The air quality and meteorological data of Pallini, Athens were kindly provided by the Air Quality Monitoring Network of Athens International Airport (AIA) Eleftherios Venizelos.
Edited by: P. Monks
References
Abram, J. P., Creasey, D. J., Dwaye, E. H., Lee, J. D., and Pilling, M. J.: Hydroxyl radical and ozone measurements in England dur-ing the solar eclipse of 11 August 1999, Geophys. Res. Lett., 27, 3437–3440, 2000.
CAMx User’s Guide, Version 4.40: ENVIRON International Cor-poration, September 2006, www.camx.com, 2006.
Curtis, A. R. and Sweetenham, W. P: FACSIMILE/CHEKMAT User’s Manual AERE R-12805, United Kingdom Atomic Energy Authority (UKAEA), Harwell, 1988.
Dodge, M.: Chemical oxidant mechanisms for air quality modeling: critical review, Atmos. Environ., 34, 2103–2130, 2000. Gerasopoulos, E., Kouvarakis, G., Vrekoussis, M., Kanakidou, M.,
and Mihalopoulos, N.: Ozone variability in the marine boundary
layer of the eastern Mediterranean based on 7-year observations, J. Geophys. Res., doi:10.1029/2005JD005991, 110 (D15), 2005. Gerasopoulos, E., Kouvarakis, G., Vrekoussis, M., Donoussis, C., Mihalopoulos, M., and Kanakidou, M.: Photochemical ozone production in the Eastern Mediterranean, Atmos. Environ., 40, 3057–3069, 2006.
Gerasopoulos, E., Zerefos, C. S., Tsagouri, I., et al.: The Total Solar Eclipse of March 2006: Overview, Atmos. Chem. Phys. Discuss., in press, 2007.
Fabian, P., Rappenglueck, B., Stohl, A., Werner, H., Winterhal-ter, M., Schlager, H., Stock, P., Berresheim, H., Kaminski, U., Koepke, P., Reuder, J., and Birmili, W.: Boundary layer photo-chemistry during a total solar eclipse, Meteorol. Z., 10 (3), 187– 192, 2001.
Founda, D., Melas, D., Lykoudis, S., Lisaridis, I., Gerasopoulos, E., Kouvarakis, G., Petrakis, M., and C. Zerefos: The effect of the total solar eclipse of 29 March 2006 on meteorological vari-ables in Greece, Atmos. Chem. Phys. Discuss., 7, 10 631–10 667, 2007.
Lelieveld, J., Berresheim, H., Borrmann, S., Crutzen, P. J., Den-tener, F. J., Fischer, H., Feichter, J., Flatau, P. J., Heland, J., Holzinger, R., Korrmann, R., Lawrence, M. G., Levin, Z., Markowicz, K. M., Mihalopoulos N., Minikin, A., Ramanathan, V., De Reus, M., Roelofs, G. J., Scheeren, H. A., Sciare, J., Schlager, H., Schultz, M., Siegmund, P., Steil, B., Stephanou, E. G., Stier, P., Traub, M., Warneke, C., Williams, J., and Ziereis, H.: Global air pollution crossroads over the Mediterranean, Sci-ence, 298, 794–799, 2002.
Liakakou, E., Vrekoussis, M., Bonsang, B., Donousis, Ch., Kanaki-dou, M., and Mihalopoulos, N.: Isoprene above the Eastern Mediterranean: Seasonal variation and contribution to the oxi-dation capacity of the atmosphere, Atmos. Environ., 41, 1002– 1010, 2007.
Liakakou, E.: Factors controlling the variability of NMHCS above the Eastern Mediterranean, PhD Thesis, University of Crete, 2007.
Poupkou, A., Symeonidis, P., Lisaridis, I., Pouspourika, E., Yay, O. D., Melas, D., Ziomas, I., Balis, D., and Zerefos, C.: Com-pilation of an emission inventory for the purpose of studying the regional photochemical pollution in the Balkan Region, Proceed-ings of the Quadrennial Ozone Symposium 2004, Kos, Greece, pp. 902–903, 2004.
Madronich, S.: UV radiation in the natural and perturbed atmo-sphere, in: Environmental Effects of UV (Ultraviolet) Radiation, edited by: Tevini, M., Lewis Publisher, Boca Raton, pp. 17–69, 1993.
Mavrakis, A., Theoharatos, G., and Lykoudis, S.: Ultraviolet ra-diation and surface ozone variations during the solar eclipse of 11 Aug. 1999, over Attica, Greece, Proceeding of the XX Qua-drennial Ozone Symposium, Vol. II, Session 6, pp. 1126–1127, 2004.
Mihalopoulos, N., Stephanou, E., Kanakidou, M., Pilitsidis, S., and Bousquet, P.: Tropospheric aerosol ionic composition above the Eastern Mediterranean Area, Tellus 49B, 314–326, 1997. Poisson, N., Kanakidou, M., Bonsang, B., Behmann, T., Burrows, J.
P., Fischer, H., Golz, C., Harder, H., Lewis, A., Moortgat, G. K., Nunes, T., Pio, C. A., Platt, U., Sauer, F., Schuster, G., Seakins, P., Senzig, J., Seuwen, R., Trapp, D., Volz-Thomas, A., Zenker, T., and Zitzelberger, R.: The impact of natural non-methane
hy-drocarbon oxidation on the free radical and ozone budgets above a eucalyptus forest, Chemosphere–Global Change Science, 3, 353–366, 2001.
Sciare, J., Kanakidou, M., and Mihalopoulos, N.: Diurnal and sea-sonal variation of atmospheric dimethyl sulfoxide (DMSO) at Amsterdam island in the southern indian ocean, J. Geophys. Res., 105, 17 257–17 265, 2000a.
Sciare, J., Baboukas, E. D., Kanakidou, M., Kriscke, U., Belviso, S., Bardouki, H., and Mihalopoulos, N.: Spatial and temporal variability of atmospheric sulfur containing gases and particles during the Albatross campaign, J. Geophys. Res., 105, 14 433– 14 448, 2000b.
Srivastava, G. P., Pakkir, M. P. M., and Balwalli, R. R.: Ozone con-centration measurements near the ground at Raichur during the solar eclipse of 1980, Proceedings of Indian Natural Sciences Academy, A48(3), 138–142, 1982.
Tsigaridis, K. and Kanakidou, M.: Importance of Volatile Organic Compounds Photochemistry Over a Forested Area in Central Greece, Atmos. Environ., 36, 19, 3137–3146, 2002.
Vrekoussis, M., Kanakidou, M., Mihalopoulos, N., Crutzen, P. J., Lelieveld, J., Perner, D., Berresheim, H., and Baboukas, E.: Role of the NO3radicals in oxidation processes in the eastern
Mediter-ranean troposphere during the MINOS campaign, Atmos. Chem. Phys., 4, 169–182, 2004,
http://www.atmos-chem-phys.net/4/169/2004/.
Vrekoussis, M., Liakakou, E., Mihalopoulos, N., Kanakidou, M., Crutzen, P. J., and Lelieveld, J.: Formation of HNO3
and NO−3 in the anthropogenically-influenced eastern Mediter-ranean marine boundary layer, Geophys. Res. Lett., 33, L05811, doi:10.1029/2005GL025069, 2006.
Vrekoussis, M., Mihalopoulos, N., Gerasopoulos, E., Kanakidou, M., Crutzen, P. J., and Lelieveld, J.: Two-years of NO3
radi-cal observations in the boundary layer over the Eastern Mediter-ranean, Atmos. Chem. Phys., 7, 315–327, 2007,
http://www.atmos-chem-phys.net/7/315/2007/.
Zanis, P., Zerefos, C. S., Gilge, S., Melas, D., Balis, D., Ziomas, I., Gerasopoulos, E., Tzoumaka, P., Kaminski, U., and Fricke, W.: Comparison of measured and modelled surface ozone concentra-tions at two different sites in Europe during the solar eclipse on August 11, 1999, Atmos. Environ., 35, 4663–4673, 2001. Zerefos, C. S., Balis, D. S., Zanis, P., Meleti, C., Bais, A. F.,
Tour-pali, K., Melas, D., Ziomas, I., Galani, E., Kourtidis, K., Pa-payannis, A., and Gogosheva, Z.: Changes in surface UV solar irradiance and ozone over the Balkans during the eclipse of Au-gust 11, 1999, Adv. Space Res., 27(12), 1955–1963, 2001. Zerefos, C. S, Balis, D. S., Meleti, C., Bais, A. F., Tourpali, K.,
Vanicek, K., Cappelani, F., Kaminski, U., Tiziano, C., Stubi, R., Formenti, P., and Andreae, A.: Changes in environmental param-eters during the solar eclipse of August 11, 1999, over Europe, Effects on surface UV solar irradiance and total ozone, J. Geo-phys. Res., 105, 26 463–26 473, 2000.