HAL Id: hal-02457779
https://hal.archives-ouvertes.fr/hal-02457779
Submitted on 30 Jan 2020
HAL is a multi-disciplinary open access
archive for the deposit and dissemination of
sci-entific research documents, whether they are
pub-lished or not. The documents may come from
teaching and research institutions in France or
abroad, or from public or private research centers.
L’archive ouverte pluridisciplinaire HAL, est
destinée au dépôt et à la diffusion de documents
scientifiques de niveau recherche, publiés ou non,
émanant des établissements d’enseignement et de
recherche français ou étrangers, des laboratoires
publics ou privés.
STUDYING ULTRA DIFFUSE GALAXIES IN VIRGO
WITH CFHT-NGVS, GALEX-GUVICS AND
CFHT-VESTIGE
Samuel Boissier, Junais Snc (sans Nom Connu/ No Family Name)
To cite this version:
Samuel Boissier, Junais Snc (sans Nom Connu/ No Family Name). STUDYING ULTRA DIFFUSE
GALAXIES IN VIRGO WITH CFHT-NGVS, GALEX-GUVICS AND CFHT-VESTIGE. Semaine de
l’Astrophysique Française, May 2019, Nice, France. �hal-02457779�
STUDYING ULTRA DIFFUSE GALAXIES IN VIRGO WITH CFHT-NGVS,
GALEX-GUVICS AND CFHT-VESTIGE
S. Boissier
1and Junais
1Abstract. In the recent years, Ultra Diffuse Galaxies (UDGs) have been found in large numbers first in clusters (e.g. Koda et al. 2015), and then also in the field, with a very wide range of properties. The Virgo cluster being both nearby, and deeply observed at all wavelength, it is a prime target to search and study such galaxies in the cluster environment. It was not necessary the easier place to do so because of the large spatial extent of the galaxies due to its proximity. Recently, however, the Next Generation Virgo Survey (NGVS) (Ferrarese et al. 2012) has allowed us to characterize thousands of galaxies in Virgo, and to find more than 100 UDGs or LSB galaxies.
After discussing some of the vague definitions of low/diffuse galaxies, this contribution presents some on-going work concerning the study of such galaxies in Virgo, on the basis on the NGVS survey. We focus especially on the contribution of GALEX data in the UV and of the VESTIGE survey for the Hα emission. Finally, we show that simple models of galaxy evolution can allow us to test what can be the effect of ram-pressure stripping (by purely modifying the star formation history of galaxies that would be usual star forming galaxies if it was not the case). UDGs may be affected by a combination of effects but simple models allow us to study an effect that SHOULD be present in the cluster environment.
Keywords: galaxies, low surface brightness
1 About the notions of Diffuse, Ultra-Diffuse, Low Surface Brightness and outlier galaxies
Low Surface Brightness galaxies (LSBs) have often been loosely defined as galaxies with “central surface
bright-ness well below” the Freeman (1970) value (of 21.65 mag arcsec−2), without any precision on the photometric
band, or on the definition of the central surface brightness. Historically, it was usually the surface brightness extrapolated at R=0 for the disk component in a bulge/disk decomposition (Impey & Bothun 1997).
Early-on, it was obvious that this was not very satisfactory as dwarf galaxies are usually LSB by this definition, but are incomparable to giant LSBs such as the massive Malin 1 galaxy (see Junais & Boissier contribution in this volume). Sprayberry et al. (1995) proposed a definition based on the “diffuseness” of galaxies defined as µg(0) + 5log(Rs) (Rs being the scale-length), allowing them to take into account this difference.
Recently, van Dokkum et al. (2015) coined the term “ultra-diffuse galaxies” (UDGs) that became very fash-ionable (a good communication move), corresponding to another selection, more extreme in surface brightness, but excluding very small galaxies that were known before-hand. UDGs are very numerous, at least in clusters (Koda et al. 2015). However, as before, the definition is somewhat arbitrary (different photometric bands and different size thresholds are used by different authors). Considering the overlap with previous definitions, a few of these UDGs were known, but were not identified as such before the few recent years. Moreover, there is a form of continuity between all these diffuse galaxies, as well as with the more usual ones (Danieli & van Dokkum 2019).
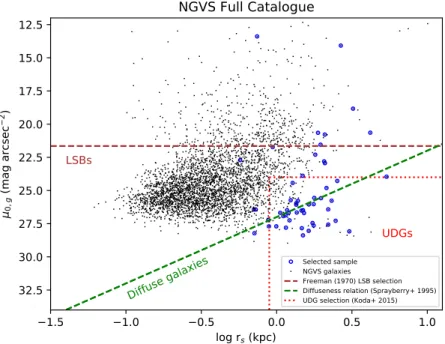
In the Virgo Cluster, Lim et al. (in preparation) have used the NGVS survey (Ferrarese et al. 2012) to find outliers in scaling relationship for Virgo Galaxies. The outliers to these relationships is another way to select galaxies that are (by definition) different from the “usual” ones. Some LSBs, UDGs or diffuse galaxies are indeed found among those, as can be seen in Fig. 1, where are shown the Virgo galaxies in the NGVS survey, the outliers, and an illustration of the definitions given above.
1 Aix Marseille Univ, CNRS, CNES, LAM, Marseille, France c
238 SF2A 2019
From Fig. 1, it can be seen that all outliers are not necessarily of low surface brightness, that the “UDG” box may select galaxies that are within the dispersion of the scaling relation (in fact, regular galaxies), that the LSB, UDG, or diffuse selections have of course some overlap, although they are not similar despite the obvious continuity between all these types of galaxies.
1.5
1.0
0.5
0.0
0.5
1.0
log r
s(kpc)
12.5
15.0
17.5
20.0
22.5
25.0
27.5
30.0
32.5
0, g(m
ag
ar
cs
ec
2)
LSBs
Diffuse galaxies
UDGs
NGVS Full Catalogue
Selected sample NGVS galaxies Freeman (1970) LSB selection Diffuseness relation (Sprayberry+ 1995) UDG selection (Koda+ 2015)Fig. 1. Central surface brightness as a function of scale-length. The lines illustrate different definitions of low surface brightness galaxies: classical threshold in red, diffuseness of Sprayberry et al. (1995) in green, ultra-diffuse galaxies in orange. The points are a sample of galaxies in the Virgo Cluster, found in the NGVS survey (Ferrarese et al. 2012). Blue circles indicates galaxies that are outliers in the scaling relationships described by these galaxies.
2 Diffuse galaxies in the Virgo cluster
Figure 1 shows the distribution in the central surface brightness vs scale-length plane of the 3688 galaxies found in the Virgo Cluster, based on the NGVS data. In this plot, we show on the x-axis a scale-length for comparison with the definition of Sprayberry et al. (1995), but we actually use the effective radius measured in the NGVS, that we transform into a scale-length assuming a disk geometry (i.e., dividing by 1.678).
Among these galaxies, Lim et al. (in preparation) defined a sample of 52 outliers, based on the scaling relationship of the sample. As demonstrated by Singh et al. (2019) in the COMA cluster, UV data can bring more information on UDGs (how many among them are star-forming, or could be star-forming). In the Virgo cluster, we have access to the GUViCS survey (Boselli et al. 2011). In the coming year, we will proceed to study the UV properties of our samples (the outliers, but also “diffuse” galaxies of interest). Moreover, we will have also access to Hα data owing to the VESTIGE (Boselli et al. 2018) project. We will thus be able to pinpoint the quenching time as optical, UV, and the Hα emission line probe different typical timescales from 10 to several 100 Myrs (Boissier 2013). We should determine how much residual star formation is present in our samples. Preliminary image inspection suggests that we may find nuclei activity in some cases. Any detection in the narrow-band filter of VESTIGE will moreover confirm the membership to Virgo, that is not fully established for all the galaxies.
3 One context to model them all
One of the main issue concerning Ultra Diffuse Galaxies is the question of their formation (which processes are responsible for the low surface brightness, and for the quenching of star formation when they are red). It is
difficult to address this question in isolation to the formation and evolution of other galaxies since a continuity exists as discussed in the first section.
Answers to the question may come from global simulations of large volume implementing all the needed physics (e.g. Di Cintio et al. 2017), however these models are very complex and implement a lot of sub-grid physics. It is sometimes hard in this context, however, to understand what is the result of which assumptions. Another approach is to take galaxies such as those observed today, and add some processes that may “transform” them into ultra-diffuse galaxies (Rom´an & Trujillo 2017).
Finally, we propose here to study samples of diffuse, LSB, or UDG galaxies with a grid of models that was initially built for nearby spiral galaxies (Boissier & Prantzos 2000; Mu˜noz-Mateos et al. 2011). In this grid, the evolution of any galaxy is basically fixed once is chosen its circular velocity (or its total final mass, in the absence of interactions with the environment), and its specific angular momentum (spin). The grid is build for the baryonic matter, and the velocity and spin are transformed into baryon’s properties through simple scaling relationships. The physical ingredients (accretion time-scale, star formation law) are fixed and universal for all the galaxies. The same family of models was used to study samples of giant LSBs under the classical definition (Boissier et al. 2003), and to study the effect of ram-pressure stripping in Virgo (Boselli et al. 2006, 2008). Finally, in Boissier et al. (2016), it was found that when adopting a very large spin parameter, the model is consistent with the properties of the giant LSB disk of Malin 1.
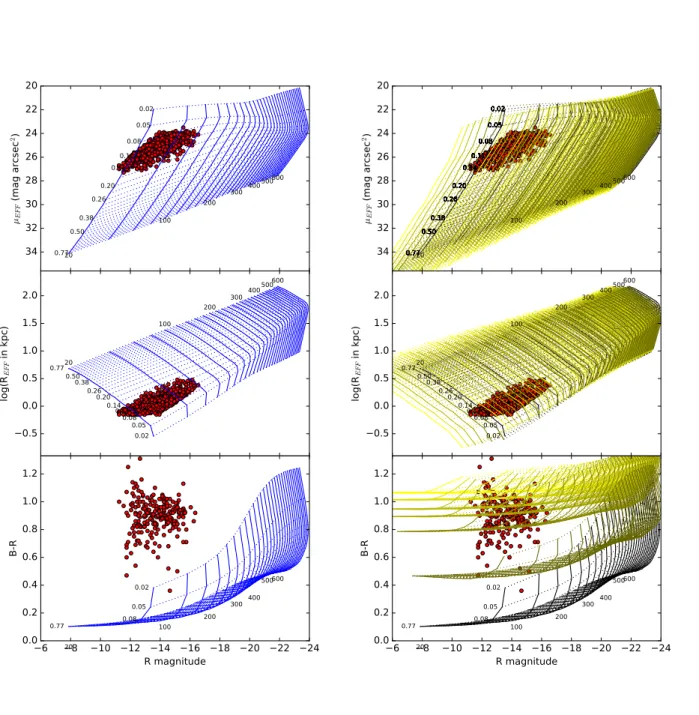
However, so far, all of these models had not been computed in an homogeneous way, and were not covering the full expanse of parameter space. For instance the ram-pressure stripping effect was only applied to average spin-parameters, and models with spin parameter intermediate between regular LSBs and the Malin 1 disk had not been computed. This is now corrected, as we present in Fig.2 a grid of models covering in a homogeneous way the full range of velocity and spin parameters (in the left). We show how this full grid is affected by a ram-pressure stripping event (for different peak-epochs of the stripping) in the right. This illustration shows that the sample of UDGs of Koda et al. (2015) is consistent with galaxies of intermediate spins, relatively low velocities. However, in the absence of ram-pressure stripping, these galaxies would have blue colour today. A ram-pressure even around 1.5 Gyr ago make them consistent with the observed colours.
In conclusion, such simple models allow the existence of blue or red UDGs depending on the advent (or not) of ram-pressure stripping during their history. While this comparison does not exclude other processes, it allows us to test in a very simple way what can be the destiny of diffuse galaxies within and outside clusters. We plan to use them to interpret the observations of diffuse, LSB, or UDG samples such as the ones discussed in the previous section.
We express our thanks to the organisers and SOC of the SF2A meeting, and to the inspiring band “The WatHermelons”. The mission to SF2A was supported by the Programme National Cosmology et Galaxies (PNCG) of CNRS/INSU with INP and IN2P3, co-funded by CEA and CNES. We also thanks the many collaborators involved in the studies mentioned in this proceedings, and especially A. Boselli, G. Gavazzi, A. Gil de Paz, J. Koda, B. Madore, J.C. Munos Mateos, N. Prantzos.
References
Boissier, S. 2013, Star Formation in Galaxies, Vol. 6, 141
Boissier, S., Boselli, A., Ferrarese, L., et al. 2016, A&A, 593, A126
Boissier, S., Monnier Ragaigne, D., Prantzos, N., et al. 2003, MNRAS, 343, 653 Boissier, S. & Prantzos, N. 2000, MNRAS, 312, 398
Boselli, A., Boissier, S., Cortese, L., & Gavazzi, G. 2008, ApJ, 674, 742 Boselli, A., Boissier, S., Cortese, L., et al. 2006, ApJ, 651, 811
Boselli, A., Boissier, S., Heinis, S., et al. 2011, A&A, 528, A107 Boselli, A., Fossati, M., Ferrarese, L., et al. 2018, A&A, 614, A56 Danieli, S. & van Dokkum, P. 2019, ApJ, 875, 155
Di Cintio, A., Brook, C. B., Dutton, A. A., et al. 2017, MNRAS, 466, L1 Ferrarese, L., Cˆot´e, P., Cuillandre, J.-C., et al. 2012, ApJS, 200, 4 Freeman, K. C. 1970, ApJ, 160, 811
Impey, C. & Bothun, G. 1997, ARA&A, 35, 267
Koda, J., Yagi, M., Yamanoi, H., & Komiyama, Y. 2015, ApJ, 807, L2 Mu˜noz-Mateos, J. C., Boissier, S., Gil de Paz, A., et al. 2011, ApJ, 731, 10 Rom´an, J. & Trujillo, I. 2017, MNRAS, 468, 4039
240 SF2A 2019 20 22 24 26 28 30 32 34 µEFF (m ag ar cs ec 2) 20 100 200 300 400500600 0.02 0.05 0.08 0.11 0.14 0.20 0.26 0.38 0.50 0.77 0.5 0.0 0.5 1.0 1.5 2.0 log (REFF in kp c) 20 100 200 300 400500600 0.02 0.05 0.08 0.11 0.14 0.20 0.26 0.38 0.50 0.77 24 22 20 18 16 14 12 10 8 6 R magnitude 0.0 0.2 0.4 0.6 0.8 1.0 1.2 B-R 20 100 200 300400 500600 0.02 0.05 0.08 0.77 20 22 24 26 28 30 32 34 µEFF (m ag ar cs ec 2) 20 100 200 300 400500600 0.02 0.05 0.08 0.11 0.14 0.20 0.26 0.38 0.50 0.77 0.02 0.05 0.08 0.11 0.14 0.20 0.26 0.38 0.50 0.77 0.02 0.05 0.08 0.11 0.14 0.20 0.26 0.38 0.50 0.77 0.02 0.05 0.08 0.11 0.14 0.20 0.26 0.38 0.50 0.77 0.02 0.05 0.08 0.11 0.14 0.20 0.26 0.38 0.50 0.77 0.02 0.05 0.08 0.11 0.14 0.20 0.26 0.38 0.50 0.77 0.02 0.05 0.08 0.11 0.14 0.20 0.26 0.38 0.50 0.77 0.02 0.05 0.08 0.11 0.14 0.20 0.26 0.38 0.50 0.77 0.02 0.05 0.08 0.11 0.14 0.20 0.26 0.38 0.50 0.77 0.02 0.05 0.08 0.11 0.14 0.20 0.26 0.38 0.50 0.77 0.02 0.05 0.08 0.11 0.14 0.20 0.26 0.38 0.50 0.77 0.02 0.05 0.08 0.11 0.14 0.20 0.26 0.38 0.50 0.77 0.02 0.05 0.08 0.11 0.14 0.20 0.26 0.38 0.50 0.77 0.02 0.05 0.08 0.11 0.14 0.20 0.26 0.38 0.50 0.77 0.02 0.05 0.08 0.11 0.14 0.20 0.26 0.38 0.50 0.77 0.02 0.05 0.08 0.11 0.14 0.20 0.26 0.38 0.50 0.77 0.02 0.05 0.08 0.11 0.14 0.20 0.26 0.38 0.50 0.77 0.02 0.05 0.08 0.11 0.14 0.20 0.26 0.38 0.50 0.77 0.02 0.05 0.08 0.11 0.14 0.20 0.26 0.38 0.50 0.77 0.02 0.05 0.08 0.11 0.14 0.20 0.26 0.38 0.50 0.77 0.02 0.05 0.08 0.11 0.14 0.20 0.26 0.38 0.50 0.77 0.02 0.05 0.08 0.11 0.14 0.20 0.26 0.38 0.50 0.77 0.02 0.05 0.08 0.11 0.14 0.20 0.26 0.38 0.50 0.77 0.02 0.05 0.08 0.11 0.14 0.20 0.26 0.38 0.50 0.77 0.02 0.05 0.08 0.11 0.14 0.20 0.26 0.38 0.50 0.77 0.02 0.05 0.08 0.11 0.14 0.20 0.26 0.38 0.50 0.77 0.5 0.0 0.5 1.0 1.5 2.0 log (REFF in kp c) 20 100 200 300 400500600 0.02 0.05 0.08 0.11 0.14 0.20 0.26 0.38 0.50 0.77 24 22 20 18 16 14 12 10 8 6 R magnitude 0.0 0.2 0.4 0.6 0.8 1.0 1.2 B-R 20 100 200 300400 500600 0.02 0.05 0.08 0.77
Fig. 2. Left: Grid of models for a very large range of angular momentum and mass. Right: The same grid is shown in black, while the different colored grids show the properties of the same galaxies, if they entered a cluster and undergone ram-pressure event at different epochs (from the bluer to the redder grids with a peak of ram-pressure now, 1, 2, 3, 4 or 5 Gyr ago).
Singh, P. R., Zaritsky, D., Donnerstein, R., & Spekkens, K. 2019, AJ, 157, 212 Sprayberry, D., Bernstein, G. M., Impey, C. D., & Bothun, G. D. 1995, ApJ, 438, 72 van Dokkum, P. G., Romanowsky, A. J., Abraham, R., et al. 2015, ApJ, 804, L26