HAL Id: hal-00296098
https://hal.archives-ouvertes.fr/hal-00296098
Submitted on 19 Dec 2006
HAL is a multi-disciplinary open access
archive for the deposit and dissemination of
sci-entific research documents, whether they are
pub-lished or not. The documents may come from
teaching and research institutions in France or
abroad, or from public or private research centers.
L’archive ouverte pluridisciplinaire HAL, est
destinée au dépôt et à la diffusion de documents
scientifiques de niveau recherche, publiés ou non,
émanant des établissements d’enseignement et de
recherche français ou étrangers, des laboratoires
publics ou privés.
Spectra Obtained During the 2002 New England Air
Quality Study with an Aerodyne Aerosol Mass
Spectrometer
C. Marcolli, M. R. Canagaratna, D. R. Worsnop, R. Bahreini, J. A. de Gouw,
C. Warneke, P. D. Goldan, W. C. Kuster, E. J. Williams, B. M. Lerner, et al.
To cite this version:
C. Marcolli, M. R. Canagaratna, D. R. Worsnop, R. Bahreini, J. A. de Gouw, et al.. Cluster Analysis
of the Organic Peaks in Bulk Mass Spectra Obtained During the 2002 New England Air Quality
Study with an Aerodyne Aerosol Mass Spectrometer. Atmospheric Chemistry and Physics, European
Geosciences Union, 2006, 6 (12), pp.5649-5666. �hal-00296098�
www.atmos-chem-phys.net/6/5649/2006/ © Author(s) 2006. This work is licensed under a Creative Commons License.
Chemistry
and Physics
Cluster Analysis of the Organic Peaks in Bulk Mass Spectra
Obtained During the 2002 New England Air Quality Study with an
Aerodyne Aerosol Mass Spectrometer
C. Marcolli1, M. R. Canagaratna2, D. R. Worsnop2, R. Bahreini3,4, J. A. de Gouw3,4, C. Warneke3,4, P. D. Goldan3, W. C. Kuster3, E. J. Williams3,4, B. M. Lerner3,4, J. M. Roberts3, J. F. Meagher3, F. C. Fehsenfeld3, M. Marchewka5, S. B. Bertman5, and A. M. Middlebrook3
1Institute for Atmospheric and Climate Science, ETH Zurich, Switzerland 2Aerodyne Research Incorporated, Billerica, Massachusetts, USA
3National Oceanic and Atmospheric Administration, Earth System Research Laboratory, Chemical Sciences Division,
Boulder, Colorado, USA
4Cooperative Institute for Research in Environmental Sciences, University of Colorado, Boulder, Colorado, USA 5Department of Chemistry, Western Michigan University, Kalamazoo, Michigan, USA
Received: 3 April 2006 – Published in Atmos. Chem. Phys. Discuss.: 12 June 2006 Revised: 6 December 2006 – Accepted: 6 December 2006 – Published: 19 December 2006
Abstract. We applied hierarchical cluster analysis to an Aerodyne aerosol mass spectrometer (AMS) bulk mass spec-tral dataset collected aboard the NOAA research vessel R. H. Brown during the 2002 New England Air Quality Study off the east coast of the United States. Emphasizing the or-ganic peaks, the cluster analysis yielded a series of categories that are distinguishable with respect to their mass spectra and their occurrence as a function of time. The differences between the categories mainly arise from relative intensity changes rather than from the presence or absence of specific peaks. The most frequent category exhibits a strong signal at
m/z 44 and represents oxidized organic matter probably
orig-inating from both anthropogenic as well as biogenic sources. On the basis of spectral and trace gas correlations, the second most common category with strong signals at m/z 29, 43, and 44 contains contributions from isoprene oxidation prod-ucts. The third through the fifth most common categories have peak patterns characteristic of monoterpene oxidation products and were most frequently observed when air masses from monoterpene rich regions were sampled. Taken to-gether, the second through the fifth most common categories represent on average 17% of the total organic mass that stems likely from biogenic sources during the ship’s cruise. These numbers have to be viewed as lower limits since the most common category was attributed to anthropogenic sources for this calculation. The cluster analysis was also very ef-fective in identifying a few contaminated mass spectra that
Correspondence to: C. Marcolli
(claudia.marcolli@env.ethz.ch)
were not removed during pre-processing. This study demon-strates that hierarchical clustering is a useful tool to analyze the complex patterns of the organic peaks in bulk aerosol mass spectra from a field study.
1 Introduction
Particles in the atmosphere play important roles in the Earth’s climate and human health (P¨oschl, 2005). In urban and rural locations the main components of the aerosol are often am-monium sulphate and organics (Zappoli et al., 1999). While most of the sulphate aerosol originates from anthropogenic sources, the situation is more complex for the organic com-ponent, which consists of complex mixtures of substances from different anthropogenic as well as biogenic sources. Or-ganic particles are either emitted directly into the atmosphere by fossil fuel or biomass combustion thus forming primary organic aerosols or form from gaseous precursors leading to secondary organic aerosols (Kanakidou et al., 2005). In the aerosol phase or during cloud events the organic aerosol is still further processed (Kalberer et al., 2004; Blando and Turpin, 2000; P¨oschl, 2005). Ambient measurements of their abundance, size, and chemical composition lead to an in-creased understanding of their sources and how they evolve in the atmosphere. Individual organic tracers can be used to apportion organic particulate matter among its sources us-ing a chemical mass balance approach. This method in-volves the extraction and analysis of filter samples usually by GC/MS and is therefore limited in its time resolution as
Table 1. Assignment of fragments for the most intense m/z of the
investigated mass spectra.
m/z Fragments 26 CN+, CHCH+ 27 CH2CH+ 29 CH3CH+2, CHO+, CH3N+ 30 NO+, CH2O+, CH4N+ 31 CH3O+ 41 CH2CHCH+2 and isomers 42 CH2CH2CH+2, CH2CO+ 43 CH3CH2CH+2, CH2CHO+, CH3CO+ 44 CO+2
55 CH2CHCH2CH+2,CH2CHCO+and isomers
57 CH3CH2CH2CH+2, CH2CHCH2O+ CH3CH2CO+and isomers 67 CH2(CH)3CH+2 and others 69 CF+3 and others 119 CF3CF+2 and others 169 CF3CF2CF+2 and others
well as laborious and costly (Turpin et al., 2000). An alter-native to this off-line technique is offered by real-time mea-surements that use mass spectrometry to determine aerosol compositions (Middlebrook et al., 2003).
The Aerodyne aerosol mass spectrometer (AMS) has been designed to measure size-resolved mass distributions and to-tal mass loadings of non-refractory chemical species from submicron particles (Jayne et al., 2000; Allan et al., 2003a; Jimenez et al., 2003). In the AMS, particles are focused into a vaporizer located within the electron impaction ionization source region of a quadrupole mass spectrometer. When it is operated in the mass spectrum mode, mass spectra from
m/z 1–300 can be collected from several particles with good
time resolution yet without particle size information. By ex-tracting the mass spectral ion signals for various species, it has been shown to yield quantitative aerosol compositions for sulphate, nitrate, ammonium and total organic particu-late matter (Allan et al., 2003b, 2004a; Bahreini et al., 2003; Schneider et al., 2004). A hierarchical clustering algorithm has been successfully applied to categorize mass spectra from individual particles measured by the Particle Analysis by Laser Mass Spectrometry (PALMS) instrument (Murphy et al., 2003). In the present study, we apply this algorithm to a quadrupole AMS dataset of particle ensembles collected during the 2002 New England Air Quality Study (NEAQS) to observe the occurrence of typical organic mass spectral features. The AMS signals in most m/z channels are due to organic species; however, the exact assignment of peaks in complex mixtures such as those found in atmospheric aerosol particles is impossible. For organic substances, the AMS has been shown to generate mass spectra that are consistent with
45 44 43 42 41 40 L a ti tu d e -74 -72 -70 -68 Longitude 30x103 25 20 15 10 5 0
July Isoprene Emissions (µg m-2h-1) Maine
New Hampshire Massachusetts New York City Boston Cape Ann Bar Harbor 45 44 43 42 41 40 L a ti tu de -74 -72 -70 -68 Longitude 2500 2000 1500 1000 500 0
July Monoterpene Emissions (µg m-2h-1)
° ° ° ° ° ° ° ° ° ° ° ° ° ° ° ° ° ° ° ° °
Fig. 1. Maps showing the ship track (yellow) and isoprene
emis-sions (top panel) and monoterpene emisemis-sions (bottom panel) for the month of July from the Megan biogenic source emission pro-file (Guenther et al., 2006). The dark blue patch at 71◦longitude and 42.5◦latitude is the Boston urban area. The ship sailed out of Charleston, SC on 12 July 2002 (off the map) to outside New York City on 16 July. On route to the study region, an issue with the AMS sampling inlet was discovered, rendering all of the data col-lected up to 18 July unusable. The ship sailed into the study region on 17 July, was downwind of Boston on July 18, and then remained north of Cape Ann off the New Hampshire/Massachusetts coast un-til 24–26 July when it sailed up the coast of Maine past Bar Harbor. The ship was docked in New Hampshire from 26–29 July . The ship was positioned directly downwind of Boston on 31 July. From 1–5 August, the ship was off the New Hampshire coast and left the study region on 5 August. On 10 August, the ship sailed into Chesapeake Bay before heading back to Charleston and reaching the home port on 11 August (both cities are off the map).
the electron impact ionization spectra found in standard mass spectrometry libraries yet with generally more fragmenta-tion (Allan et al., 2003b; Alfarra, 2004). Furthermore, in-creased fragmentation has been observed in the AMS with increased vaporizer temperature (Alfarra, 2004). Organic functional groups can be identified from the small (m/z<50)
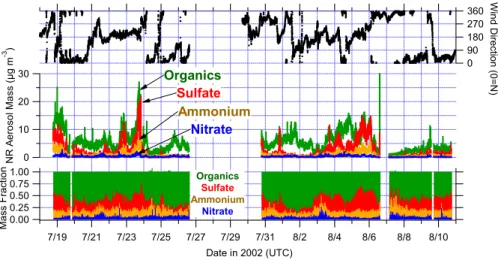
30 20 10 0 N R A e ro so l M a ss (µ g m -3 ) 7/19 7/21 7/23 7/25 7/27 7/29 7/31 8/2 8/4 8/6 8/8 8/10 Date in 2002 (UTC) 1.00 0.75 0.50 0.25 0.00 Ma s s F ra c ti o n 360 270 180 90 0 W in d D ire ct io n (0 = N ) Organics Ammonium Sulfate Nitrate Organics Sulfate Ammonium Nitrate
Fig. 2. Time series of the AMS non-refractory (NR) aerosol mass loadings, NR mass fraction, and wind direction.
ion fragments and information about the oxidation and sat-uration state of the organic aerosol fraction can be retrieved by means of the so-called ion series or delta analysis (McLaf-ferty and Tureˇcek, 1993; Allan et al., 2003b; Schneider et al., 2004; Bahreini et al., 2003; Alfarra et al., 2004; Canagaratna et al., 2004; Bahreini et al., 2005). However, specific patterns of the organic signals can not be captured by this method alone. Although discrimination between fragments with the same nominal m/z such as those listed in Table 1 is now pos-sible with a high resolution time-of-flight AMS (DeCarlo et al., 2006), several research groups have obtained low resolu-tion data with the quadrupole AMS. The quesresolu-tion therefore arises as to what other information about the aerosol organic material can be extracted from an AMS dataset. One method that has been used involves multivariate linear regressions, separating the ambient mass spectra into linear combinations of two (or three) components using m/z 44 and 57 (plus 43) as initial seeds for the deconvolution of the spectra (Zhang et al., 2005a). Scatter plots of organic peak intensities have also been used to compare ambient AMS data with reference spectra (Alfarra et al., 2006).
2 Experimental methods
2.1 Sampling, analysis, and data summary
The AMS dataset was collected aboard the NOAA research vessel Ronald H. Brown off the east coast of the United States between 18 July and 10 August 2002 as part of NEAQS 2002. A map of the ship track is shown in Fig. 1. For this study, many different types of air masses and sources were sampled (e.g., urban from Boston and New York City and biogenic from Maine) and therefore a detailed cluster analysis was performed to see whether or not specific mass spectral signatures of the several different types of general sources in the bulk mass spectra could be detected. Mass
spectra from m/z 1–300 and particle time-of-flight mass dis-tributions were recorded every 2 min with 1 min sampling times in each mode for most of the study. More experimental details of the AMS dataset and how the mass loadings were measured were reported elsewhere (de Gouw et al., 2005). Volatile organic compounds (VOCs) were measured by on-line gas chromatography-mass spectrometry (Goldan et al., 2004) and proton-transfer-reaction mass spectrometry (de Gouw et al., 2003), and ozone measurements were obtained using a commercial UV absorbance instrument (Thermo En-vironmental Instruments Inc., Model 49C).
The AMS non-refractory mass loadings for organic ma-terial, sulphate, ammonium, and nitrate are shown in Fig. 2 along with the wind direction during sampling. As previ-ously reported, the overall submicron aerosol composition during this study was predominantly organic and sulphate (Quinn and Bates, 2003; Bates et al., 2005). The highest loadings of both sulphate and organic mass occurred when the wind direction was from the southwest where the air masses had recently come from urban sources. Classification of the synoptic weather in New England shows that trans-port from the west, southwest, and south results in hot, hu-mid conditions (Atlantic Return) and the highest fine parti-cle concentrations (Slater et al., 2002; Keim et al., 2005). The AMS non-refractory aerosol mass loadings were sig-nificantly lower and dominated by organic material when the winds were from the north where monoterpene emis-sions were prevalent (see Fig. 1). Low fine particle con-centrations with more organic carbon relative to sulphate than in the southwesterly winds are common in the region when the transport is from the northwest, north, and north-east with cold, dry conditions (Canadian High) (Slater et al., 2002; Keim et al., 2005). Hence, grouping the AMS dataset by wind direction is reasonably representative of these two weather conditions.
2.2 Derived quantities: photochemical age and delta anal-ysis
In this manuscript we will make use of the photochemical age of an air mass, an isoprene source term, and a delta anal-ysis of the AMS mass spectra. The photochemical age of the air masses was determined from the VOCs by examining the ratios of toluene to benzene, and the amount of isoprene from the source was extrapolated from the ratio of methyl vinyl ketone (MVK) plus methacrolein (MACR) to isoprene (see Eqs. 1, 2a, and 2b in de Gouw et al., 2005). For the delta analysis, each m/z in the spectrum corresponds to a delta value equal to m/z–14n+1 where n is an integer (McLafferty and Tureˇcek, 1993). The delta value of a particular m/z pro-vides an indication of the functionality, given that hydrocar-bons typically differ by a CH2group which is 14 amu, with
negative delta values generally indicating unsaturated hydro-carbons and positive delta values generally indicating oxi-dized hydrocarbons. The intensity-weighted averages of the delta values are then calculated for various ranges of carbon number (Bahreini et al., 2005).
2.3 Hierarchical cluster analysis
The hierarchical clustering algorithm that was developed for PALMS (Particle Analysis by Laser Mass Spectrometry) data (Murphy et al., 2003) is briefly described here. The most similar spectra or clusters are sequentially combined until a stopping condition is met. The algorithm uses the dot product between mass spectra as the similarity criterion: the most similar spectra or clusters are assigned the same category and their mass spectra are averaged. Mathematically, the total signal in each spectrum is normalized to unit intensity by dividing the peak intensities by the square root of the sum of the squares of the individual peak intensities and then each spectrum is represented as a vector:
A=[a1, a2, a3, etc.] (1)
where a1, a2, a3, etc. are the normalized peak intensities at
various m/z. The dot product of two normalized vectors, A and B, is simply:
A·B=a1b1+a2b2+a3b3+etc. (2)
This dot product is the cosine of the angle between the two vectors: if it is zero the normalized spectra are orthogonal and if it is one the normalized spectra are identical. In hierar-chical clustering, the data are searched for the pair of spectra with the highest dot product. Those two spectra are aver-aged and renormalized to produce a category that replaces them. Then the dataset, now smaller by one spectrum, is again searched for the highest dot product, whether it is be-tween two spectra or a spectrum and a category. These are averaged and the process is continued until all the remaining dot products are less than a stopping condition (strict crite-rion). The number of spectra in each category is retained to
obtain a weighted average when subsequent spectra are in-cluded. For categories containing a small number of spectra, the stopping condition is loosened (loose criterion) to allow less-closely matched spectra to be combined in small cate-gories. At the end of clustering, a final pass is made to en-sure all of the spectra are placed in the appropriate category, which reduces the bias of the sequence for combining.
The PALMS hierarchical clustering algorithm was adapted to the AMS mass spectra. Spectra obtained during the field study from ammonium nitrate calibration particles or that were known to contain contaminants were initially removed, resulting in 12 730 spectra for the cluster analysis. The peaks known to be dominated by air or by inorganic ions (m/z 14– 24, 28, 32–34, 36, 39, 40, 47–50, 64–66, 80–83, 98–100) were excluded and the peaks at m/z 29, 30, 38, and 44 were corrected for contributions from air using the method of Al-lan et al. (2004a). Although m/z 38 and 41 can originate from inorganic species (specifically H37Cl+ and 41K+,
re-spectively), they were not excluded in this analysis. The av-erage noise levels as determined by the method described by Allan et al. (2003a) have been subtracted from the peak sig-nals at each m/z and any negative values were set to zero. This was done to give the channels with high noise level and low signal less weight. Although there could be a bias due to this procedure, it would occur mainly in the high m/z peaks where the signals were small and does not significantly im-pact the cluster analysis using linear signals. Finally, the to-tal signal of each spectrum was normalized to unit intensity. In the application for the PALMS datasets, a combination of the linear scaled peak intensities and the log scaled raw spec-trum was used. For the present work, only the linear peak intensities were used. Using the log of the signals intensi-fied the noise level of the high m/z peaks and did not con-tain useful information since most of the spectral signal was in the smaller ion fragments. The diversity (or number of categories) and the relative occurrence of the categories for approximately every two hours were calculated by forming groups of sixty of the 2 min averaged spectra as a function of time.
3 Results and discussion
3.1 Categorization
The AMS mass spectra in this study were from ambient at-mospheric aerosols, which are composed of numerous or-ganic compounds with varying concentrations rather than a few individual organic species. Thus, these data did not form distinct clusters per se, and the choice of the stopping con-dition and the number of resulting categories was arbitrary. For our dataset, the 12 730 spectra were first divided into four subsets by time. To reduce computing time, the clustering al-gorithm was run separately for each subset with strict criteria until the number of categories was low enough to be easily
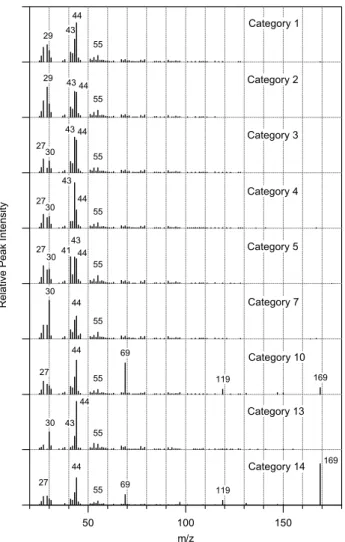
R e la ti ve P e a k In te n si ty 150 100 50 m/z Category 2 Category 3 Category 4 Category 5 44 43 29 29 43 44 44 44 30 27 43 55 55 55 55 27 55 41 43 44 Category 1 43 27 30 30 Category 7 Category 13 Category 10 Category 14 44 44 44 44 30 30 69 69 27 119 119 169 169 43 55 55 55 55 27
Fig. 3. Relative peak intensities (linear arbitrary units) for the top 5
and other prominent categories.
handled in one set for the last pass. The stopping condition for the last pass was optimized to yield clusters with differ-ent spectral features as well as distinct time sequences. The criteria for each pass and the resulting number of categories are shown in Table 2. After the categories were established, a final pass of all the spectra was performed to ensure that they were placed in the appropriate categories. We stopped with 48 categories – the largest one comprising 9505 of the to-tal of 12 730 spectra, the smallest ones containing one spec-trum each. Table 3 lists the most prominent peaks in the top 15 categories and the averaged mass spectra of some im-portant categories are shown in Fig. 3. The top 5 categories comprise over 92% of the spectra. The categories mainly differ in the relative intensity rather than in the presence or absence of specific peaks. Most of them are dominated by peaks with m/z below 50. Thus, the sampled organic aerosol fraction either consisted of quite small molecules or strongly fragmented in the mass spectrometer. The Aerodyne mass spectra collected during the MINOS campaign by
Schnei-Table 2. Criteria used for generating clusters.
Pass Strict Loose No. Spectra for Resulting
No. Criterion Criterion Loose No.
Criterion Categories
1 0.97 0.97 – 4120
2 0.97 0.97 – 2233
3 0.97 0.97 – 1715
4 0.93 0.77 50 48
der et al. (2004) also show a strong dominance of low m/z peaks whereas around 40% of the total organic signal dur-ing the ACE-Asia campaign was due to fragments with m/z above 50 (Bahreini et al., 2003). The individual spectra are assigned to the category which gives the best match based on the dot product as the similarity criterion. While still meeting the criterion, the sequence of most intense peaks for individ-ual category members can deviate from the one of the aver-aged spectrum: 8% of category 1 spectra exhibit the strongest signal at m/z 43 instead of m/z 44 as the average in Fig. 3 shows; in category 2, 46% of the spectra show m/z 29 as the strongest peak, 31% m/z 43, and 19% m/z 44, reflecting the similar intensities of m/z 29, 43, and 44 in the averaged spectrum.
Some of the most abundant peaks can be unambiguously assigned to specific organic fragments as shown in Table 1. Mass m/z 44 is a sign of oxidized organic species since it is due to CO+2 e.g. from oxo- and dicarboxylic acids as well as highly oxygenated species (Alfarra, 2004). It is strong in category 1 (Fig. 3), thus, this category can be considered as highly oxidized. Although they could arise from ammo-nium or sodium nitrate, m/z 30 and 46 were included in this analysis since they could also be due to NO+and NO+2 from organic nitrates, nitro aromatics, and possibly other organo-nitrogen or organo-oxygen containing species. Mass m/z 30 is the most abundant peak in category 7 (Fig. 3), the second most abundant peak in category 13, and is common in many other categories (Table 3). The peaks at m/z 69, 119, and 169 have been observed in fluorinated hydrocarbon oil from mechanical pumps (J. Jimenez and P. Silva, personal com-munication). Mass m/z 69 and 169 are the second most and the most abundant ones in categories 10 (with 60 spectra) and 14 (with 24 spectra), respectively (Fig. 3).
In many of the categories, m/z 57 is typically not a major peak. A strong peak at m/z 57 along with m/z 55 and other hydrocarbon fragments differing from these two masses in steps of 14 amu due to CH2groups have been found in the
AMS spectra from direct emissions of diesel exhaust (Cana-garatna et al., 2004) and this distinct pattern has been ob-served in urban mass spectra during the morning (Allan et al., 2003b; Alfarra et al., 2004; Zhang et al., 2005a,b). Dur-ing the NEAQS 2002 study, however, the only time when a relatively high m/z 57 was observed was when the ship’s
Table 3. Characteristics of the 15 most abundant categories.
Category No. spectra Most intense m/z (intensities normalized to the largest peak ± standard deviation)
1 9505 44 (100±15), 43 (58±16), 29 (44±16), 27 (38±11), 30 (29±11), 41 (25±12), 42 (22±8), 55 (16±9) 2 1052 29 (100±16), 43 (86±20), 44 (83±22), 27 (55±16), 30 (44±18), 41 (34±17), 42 (27±11), 55 (24±13) 3 513 43 (100±14), 44 (92±16), 27 (39±15), 30 (33±15), 41 (32±18), 42 (26±15), 26 (15±9), 55 (14±11) 4 414 43 (100±11), 44 (40±18), 27 (31±13), 30 (25±12), 29 (23±16), 42 (15±10), 41 (14±12), 55 (12±11) 5 275 41 (100±22), 43 (99±27), 44 (93±31), 27 (67±23), 30 (53±23), 29 (51±26), 42 (33±16), 55 (30±20) 6 259 44 (100±22), 27 (71±17), 43 (54±20), 30 (50±20), 55 (32±19), 42 (25±16), 26 (20±13), 53 (15±12) 7 163 30 (100±15), 44 (60±22), 43 (49±18), 27 (36±13), 29 (36±19), 41 (24±15), 55 (17±11), 42 (17±10) 8 137 27 (100±19), 43 (74±22), 44 (62±21), 30 (37±17), 29 (31±21), 42 (23±15), 41 (22±17), 26 (17±13) 9 82 29 (100±16), 44 (49±24), 27 (29±16), 30 (26±13), 43 (23±14), 42 (15±10), 41 (13±12), 26 (13±10) 10 60 44 (100±23), 69 (92±27), 43 (50±22), 27 (38±15), 29 (29±17), 30 (25±12), 41 (23±18), 169 (19±20) 11 53 43 (100±20), 27 (78±17), 30 (52±21), 55 (29±22), 31 (22±13), 42 (21±15), 41 (20±18), 26 (18±15) 12 38 55 (100±21), 44 (57±22), 43 (45±18), 29 (32±17), 27 (30±15), 30 (24±11), 42 (15±8), 41 (14±12) 13 25 44 (100±16), 30 (37±15), 43 (28±17), 53 (13±9), 55 (11±11), 27 (9±8), 31 (8±9), 67 (7±8) 14 24 169 (100±20), 44 (66±21), 43 (30±11), 69 (25±16), 29 (22±17), 27 (21±8), 30 (15±6), 41 (14±11) 15 15 57 (100±18), 44 (44±18), 43 (40±16), 30 (25±13), 29 (23±14), 27 (22±6), 41 (20±9), 42 (12±6)
Fig. 4a. Reference spectra (linear arbitrary units): laboratory
gener-ated spectra of fulvic acid (Alfarra et al., 2006), Pittsburgh oxidized organic aerosol (OOA) from a field study (Zhang et al., 2005a), the aerosol oxidation products of α-pinene plus OH (Alfarra et al., 2006) and plus ozone (O3) (Bahreini et al., 2005), cyclopentene
(CP) plus O3(Bahreini et al., 2005), 1,3,5-trimethylbenzene (TMB) plus OH (Alfarra et al., 2006), and meta-xylene plus OH (Bahreini et al., 2005). R e la ti ve P eak Intensi ty 150 100 50 m/z isoprene + OH isoprene + NO3 isoprene + OH (low NOx) isoprene + OH (high NOx)
MACR + OH (very high NOx)
43 43 29 29 55 29 43 29 4344 29 43 44 57
Fig. 4b. Reference spectra (linear arbitrary units): laboratory
gen-erated spectra of the aerosol oxidation products of isoprene plus hydroxyl radical (OH) (unpublished data from R. Bahreini), iso-prene plus OH with varying levels of nitrogen oxides (NOx) (Kroll
et al., 2006), methacrolein (MACR) plus OH with very high NOx
(Kroll et al., 2006), and isoprene plus nitrate radical (NO3) (work
in progress from S. Murphy). Low NOxwas less than 1 ppbv, high
NOxwas 400 ppbv, and very high NOxwas 800 ppbv.
exhaust was inadvertently sampled while changing position, and these spectra were removed from the cluster analysis dur-ing pre-processdur-ing. The lack of fresh organic aerosol spec-tra during this study is consistent with the VOC data which nearly always exhibited some degree of aging (de Gouw et al., 2005). The hydrocarbon-like fraction described by
Zhang et al. (2005a) might have been too dilute or highly processed to yield a specific signal in the mass spectra. Cate-gory 15 with 15 spectra was the only one with strong m/z 57 (Table 3).
3.2 Comparison with mass spectra
Very recently, mass spectra of secondary organic aerosols formed from the oxidation of anthropogenic and biogenic precursors have been measured by different research groups with the quadrupole AMS (Alfarra et al., 2006; Bahreini et al., 2005). Secondary organic aerosol has also recently been observed in chamber studies of isoprene oxidation (Kroll et al., 2005, 2006), and AMS mass spectra of these particles have been obtained in similar experiments (unpublished data from R. Bahreini and work in progress from S. Murphy). Note that methacrolein (MACR) is an oxidation product of isoprene. The laboratory spectra are shown in Fig. 4 together with reference spectra for fulvic acid (Alfarra et al., 2006) and oxidized urban aerosol derived from a multivariate linear regression of the aerosol sampled in Pittsburgh in September 2002 (Pittsburgh OOA) (Zhang et al., 2005a). These spectra are compared to the top 5 categories to find similarities and their correlations are shown in Fig. 5. Since aerosols from different sources may have been sampled at the same time by the AMS spectrometer during the field study, the measured mass spectra might be dominated by one type of aerosol or contain a mixture of aerosol types. Because of its abundance throughout the whole campaign, category 1 spectral features are the most likely to be mixed into other categories result-ing in a relatively large m/z 44 signal. Furthermore, other peaks in the spectra may form distinct patterns in the absence of m/z 44. Therefore, the correlations were carried out with and without m/z 44. The complete set of peaks used for these correlations are at m/z 12, 13, 25, 26, 27, 29, 31, 37, 38, 41, 42, 43, 44, 45, 51, 53, 55, 57, 67, 69, 71, 73, 85, 87, 89, and 91, which have the most signal intensity.
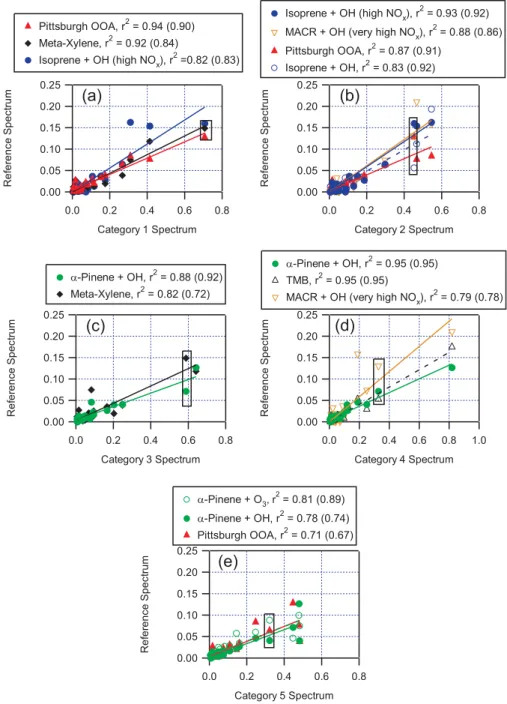
The best correlations of category 1 occur with the spec-trum of oxidized organic aerosols obtained in Pittsburgh, which become distinctly better than the ones with meta-xylene when m/z 44 is excluded (Fig. 5a). Therefore, cat-egory 1 can be considered as highly oxidized. The patterns observed in categories 2–5 are quite similar to spectra ob-tained from oxidation of mostly biogenic precursors (Alfarra et al., 2006; Bahreini et al., 2005; Kroll et al., 2006) and these particles are less oxidized than when m/z 44 domi-nates the spectrum (Alfarra, 2004). The category 2 spec-trum has a large peak at m/z 29, similar signal intensities at m/z 43, and m/z 44 and relatively low signal at m/z 41,
m/z 55, and m/z 57 which signifies the prevalence of
car-bonyls (C=O) from either ketones, aldehydes, and carboxylic acids (McLafferty and Tureˇcek, 1993; Alfarra et al., 2004). This category shows the highest correlation with the iso-prene oxidation spectra (Fig. 5b). Category 3 most closely resembles the spectrum observed of aerosols produced by
α-pinene oxidation with hydroxyl radical (OH) (Alfarra et al., 2006), especially when m/z 44 is excluded (Fig. 5c). Hence, it could be characteristic of more strongly oxidized products than present in the reference. Category 4 is extremely similar to the spectra formed by OH oxidation of α-pinene or 1,3,5-trimethylbenzene (TMB) (Alfarra et al., 2006) (Fig. 5d) and the pattern of the main peaks of category 5 has the highest resemblance to the one formed during α-pinene ozonolysis experiments (Bahreini et al., 2005) (Fig. 5e). A list of dot products using all of the peaks and calculated in the same way as for the clustering program is presented in Table 4. These results are similar to those from the linear regression correlations: category 1 is closest to the Pittsburgh OOA and meta-xylene, category 2 is closest to the isoprene plus OH under high NOx conditions and methacrolein (MACR) plus
OH under very high NOx conditions, category 3 is closest
to α-pinene plus OH, category 4 is closest to α-pinene plus OH and TMB, and category 5 is closest to both α-pinene ox-idation products. If the clustering algorithm was used to put the reference spectra into categories, OOA and meta-xylene would have been placed in category 1, isoprene plus OH un-der high NOxconditions and methacrolein (MACR) plus OH
under very high NOxconditions in category 2, and α-pinene
plus OH and TMB would have been placed in category 4. All of the other reference spectra would not have been placed in the top 5 categories when applying the strict criterion.
In addition to subtle differences in the mass spectra of the low m/z peaks from various precursors, the high m/z frag-ments may also exhibit distinct mass spectral patterns. These can be analyzed by the ion series or delta analysis technique which uses the delta value, 1=m/z-14n+1 (where n is the “nominal” number of CH2groups), as an indication of the
functional groups in the molecule. Bahreini et al. (2005) previously used this technique to examine the delta patterns of oxidation products from many types of precursors (ter-penoid, cycloalkene, and meta-xylene). In that study, the larger carbon fragments (C5-C6 and C7-C15) of secondary organic aerosols from different biogenic (terpenoid) precur-sors showed negative delta values which was in sharp con-trast to the positive ones observed for secondary organic aerosols formed from cycloalkenes and meta-xylene repre-senting anthropogenic precursors.
The average delta patterns for the top 5 categories (Fig. 6) are similar to each other and more similar to those from bio-genic precursors than those from anthropobio-genic precursors, implying that the organic mass of higher m/z fragments in these categories is biogenic in origin. Note that 23% of the total organic signal is represented by these peaks. Indeed all of the top 15 categories, with the exception of category 14, have comparable average delta patterns. The delta pattern of category 5 is nearly identical to that from α-pinene ozonoly-sis products (Bahreini et al., 2005) which strongly indicates that secondary organic aerosol from α-pinene ozonolysis was present in these spectra. However it must be noted that the delta patterns for the aerosol products of only one aromatic
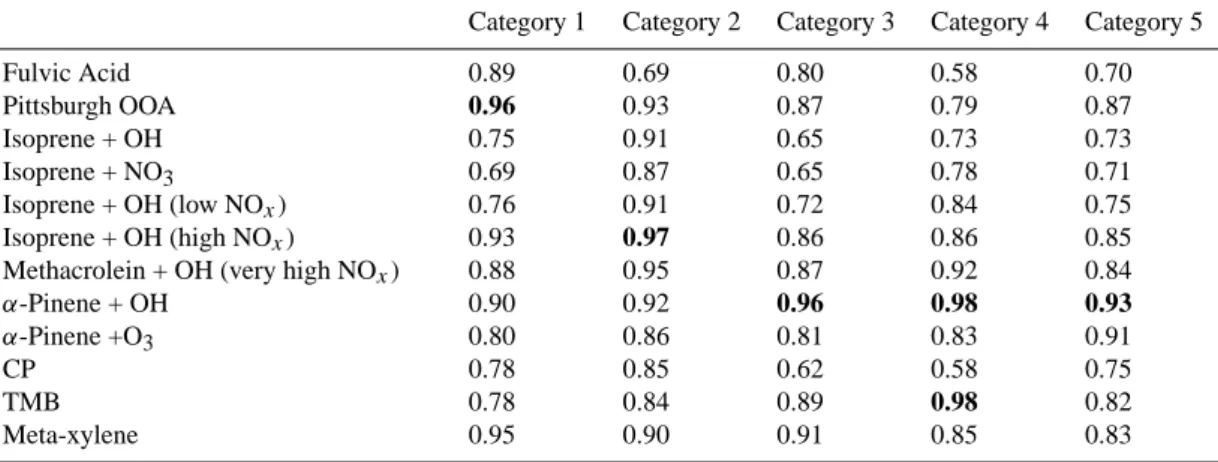
Table 4. Dot products of the reference spectra with the top 5 categories. The bold values indicate the reference spectra that have the highest
dot products for each category spectrum.
Category 1 Category 2 Category 3 Category 4 Category 5
Fulvic Acid 0.89 0.69 0.80 0.58 0.70 Pittsburgh OOA 0.96 0.93 0.87 0.79 0.87 Isoprene + OH 0.75 0.91 0.65 0.73 0.73 Isoprene + NO3 0.69 0.87 0.65 0.78 0.71 Isoprene + OH (low NOx) 0.76 0.91 0.72 0.84 0.75 Isoprene + OH (high NOx) 0.93 0.97 0.86 0.86 0.85
Methacrolein + OH (very high NOx) 0.88 0.95 0.87 0.92 0.84
α-Pinene + OH 0.90 0.92 0.96 0.98 0.93
α-Pinene +O3 0.80 0.86 0.81 0.83 0.91
CP 0.78 0.85 0.62 0.58 0.75
TMB 0.78 0.84 0.89 0.98 0.82
Meta-xylene 0.95 0.90 0.91 0.85 0.83
anthropogenic precursor compound (meta-xylene) have been investigated (Bahreini et al., 2005).
3.3 Trends with time and wind direction
To judge whether the categories are related to certain time periods, we investigated them as a function of time (Fig. 7). The top two panels show the organic mass loadings and the diversity of the organic aerosol fraction over the whole mea-surement period. It can be seen that the diversity – i.e. the number of different categories within groups of 60 consec-utive measurements – is highest at times when the overall mass loading is lowest. Since category 1 comprises 75% of the spectra, there is a very strong anti-correlation between the diversity and this category. The high diversity at low mass loadings might be to some extent a statistical effect, since for averaging times of 1 min and at low mass loadings only few particles are responsible for the detected signal at a specific m/z channel and the presence of one large particle might influence the resulting mass spectrum (Bahreini et al., 2003). Since also at low mass loadings some time periods are strongly dominated by category 1, the diversity can not be completely explained by counting statistics. The low di-versity for high mass loadings may indeed be an indication that the air masses are homogeneous and well-mixed.
Category 1 was dominant during almost the whole mea-surement period, being most abundant at times when the or-ganic mass loading was high. Its incidence dropped notably during three periods: on 23 July, 3 August, and 6 August (Fig. 7). In all three instances, the organic mass loadings were much lower, due to either the passage of cold fronts or major wind direction shifts from the southeast to the south-west or north in a south-westerly fashion (Fig. 2). Although the contribution to any wind direction is dominated by category 1 spectra, the relative contribution for category 1 spectra is the highest when the winds are from the east or south (Fig. 8).
Category 2 is prevalent on 23–24 July , 3 August, and 5– 6 August during wind shifts at the end of the high organic mass events and is highest on August 5 when categories 3 through 5 are altogether absent. During these time periods the winds are from the southwest (Figs. 2 and 8) and have passed over the Boston urban area as well as an isoprene “hot spot” (Fig. 1a). This further supports the notion of cat-egory 2 as being indicative of isoprene oxidation products which might be mixed together with oxidized urban aerosol as established from the correlations in Fig. 5b. Categories 3 through 5 are most common mainly during two time peri-ods (24–26 July and 6–7 August ) when the organic mass loading was relatively low and winds are from the north (Figs. 2 and 8). Because northerly winds come from over Canada with relatively low isoprene and high monoterpene emissions (Fig. 1), the incidence of categories 3 through 5 supports the interpretation of these categories as originating from monoterpene oxidation products. Although categories 7 and 13 both have relatively large peaks at m/z 30, their time trends are different: Category 7 was observed mainly on three days – 21 July, 3 August, and 7 August – whereas cat-egory 13 was observed mainly on 7 August, the day with the lowest submicron aerosol mass throughout the whole cam-paign. Categories 10 and 14 occurred mainly on 10 August between 03:00 and 16:00 UTC, when the ship was in Chesa-peake Bay. The ship’s movement during this time did not create sufficient relative wind off the bow to sample air away from the ship. The clear signature of fluorocarbons in cate-gories 10 and 14 indicates that the AMS sampled mechanical pump exhaust from other sampling equipment on the ship.
Other top 15 categories (6, 8, 9, and 11, not shown in Figs. 3 or 7) were observed most frequently during low mass periods when the spectra showed a large variation of compo-sition as is reflected by the high diversity (Fig. 7b). They contain between 53 and 259 spectra and exhibit the main peak at m/z 27 (category 8), m/z 29 (category 9), and m/z 43
Fig. 5. Correlation plots of the peaks (arbitrary units) in the reference spectra (Fig. 4) with the peaks (arbitrary units) in categories 1–5
(Fig. 3). Note only the reference spectra with the highest correlation coefficients are shown. The correlation coefficients in parentheses are for correlations without m/z 44 (points in the box).
(category 11), indicating a low degree of oxidation at these low mass periods. The exception is category 6 which has a large peak at m/z 44. Category 11 with hardly any signal at
m/z 44 was only present when the organic mass was below
4 µg/m3.
3.4 Diurnal and photochemical age trends
The diurnal cycles of the total organic mass loading, ozone, and the shortwave radiation averaged over the whole
sam-pling period as well as the average relative occurrence of the top 5 categories are shown in Fig. 9. Although spec-tra were averaged that were collected at different locations and under varying weather conditions, it still allows for sum-marizing general trends: The particulate organic matter ex-hibits the highest values from 14:00 to 18:00 UTC (10:00 to 14:00 local time) when the solar radiation was at a maxi-mum during the afternoon. This is consistent with secondary organic aerosol formation by gas-to-particle conversion that
-4 -3 -2 -1 0 1 2 3 A v e ra g e D e lt a C1-C4 C5-C6 C7-C15 Category 1 Category 2 Category 3 Category 4 Category 5
Fig. 6. Average delta patterns (arbitrary units) for low (C1–C4), mid
(C5–C6), and high (C7–C15) m/z peaks for categories 1 through 5.
contributed to the total particulate organic mass. Category 1 exhibits a similar diurnal cycle, but with a wider maxi-mum. Therefore, gas-to-particle conversion may only partly explain the diurnal cycle of category 1, indicating that further processing might take place within the particles. Another possibility is the change in composition to more oxidized particles from the free troposphere as the nocturnal bound-ary layer collapses. The diurnal pattern of ozone is similar to that from organic aerosol mass and even more similar to that of category 1, which suggests that they are both from photochemical production rather than transport. Category 2 has a significant drop in frequency during midday (14:00 to 19:00 UTC or 10:00 to 15:00 local time), whereas the fre-quency of category 1 spectra increases during this time pe-riod. Category 5 is not abundant at high solar irradiance and typically peaks in the morning.
Figure 10 shows the relative occurrence of the top five cat-egories versus the photochemical age of their air masses. The fraction of spectra placed in category 1 increased with age and there is a decreasing trend for category 2 spectra. Since category 1 has a significant peak at m/z 44, this could in-dicate processing of the organic material detected in cate-gory 2 spectra to form more oxidized organic material. Al-ternatively, the increase in relative occurrence of category 1 spectra may be due to condensation of oxidized material from a different source. It must be noted that the sampled air masses probably originated from or passed over different source regions (Fig. 8), so the relative contribution of each category as a function of photochemical age is not necessar-ily indicative of changes to the aerosol composition as ur-ban air ages. However, categories 1 and 2 tend to both be abundant when winds are from the direction of major urban areas. Furthermore, the relative peak intensity at m/z 44 in-creased over time in chamber studies of secondary organic aerosol formation (Alfarra et al., 2006), which is indicative of further oxidation during aging and consistent with the field data. The distributions shown in Fig. 10 for categories 3–5
20 40 60 80 Cat 1 u O cc rre nc e 0 20 40 Cat 2 c O cu rre nce 0 5 10 15 20 b D ive si ty r 20 40 Cat 7 O cc urre nc e 0 5 10 15 O ccu rre nc e Cat 5 30 20 10 O n e ccu rre c Cat 3 30 20 10 c rre O c u nc e Cat 4 0 5 10 15 20 25 a g s (m Or . Ma s g/ m ) 3 0 5 10 15 O c u n e c rre c Cat 10 00 8 6 4 2 O c u n e c rre c Cat 13 July 18
00:00 July 2500:00 August 100:00 August 800:00 Date and Time (UTC)
0 8 c O curre nce 4 8 6 4 2 0 O c u n e c rre c 0 Cat 14
Fig. 7. Time series of the aerosol organic mass loading (a), the
diversity (b), and the relative occurrence (%) of the top 5 and other prominent categories.
are broad, yet tend to be relatively more important in younger air masses. Since the photochemical age is determined from anthropogenic VOCs originating from source regions in the west or southwest, only a weak correspondence with the de-gree of oxidation for categories 3–5, which mainly occur dur-ing times with northerly winds, can be expected. The low correlation with photochemical age in Fig. 10 is therefore
100 80 60 40 20 0 Re la ti ve O ccu rren c e for C a te gori es 1 -2 (% ) 360 315 270 225 180 135 90 45 0 Wind Direction (0=N) 10 8 6 4 2 0 Re la tive O ccu rren c e for C a te gor ie s 3 -5 (% ) Category 1 Category 2 Category 3 Category 4 Category 5
Fig. 8. Relative occurrence for categories 1 through 5 as a function
of wind direction sorted for wind speeds greater than 4 m/s.
Fig. 9. Relative occurrence of particulate organic matter (top panel
in green), ozone (top panel in red), and shortwave radiation (top panel in black) for a mean day averaged over the whole sampling period. Relative occurrence for categories 1 through 5 as a function of time of day (bottom panel).
consistent with the particulate organic matter in categories 3–5 being comprised of only minor contributions from an-thropogenic precursors that have been oxidized during trans-port and aging.
3.5 Correlations of categories 1–5 with gas phase species The occurrence of categories 1 through 5 is shown as a func-tion of time in Fig. 11 for 25–26 July , the time period when winds were from the north and the ship was sailing off the coast of Maine (detailed ship track and wind directions for this time period are given in Fig. 13a of de Gouw et al., 2005). At this time, the synoptic climate classification for
100 80 60 40 20 0 Re la ti ve O c cu rr e n c e fo r Ca te g o ry 1 (% ) 50 40 30 20 10 0 Photochemical Age (hrs) 25 20 15 10 5 0 Rel a tiv e O c c u rre nc e for Cat e gori e s 2 -5 (% ) Category 1 Category 2 Category 3 Category 4 Category 5
Fig. 10. Relative occurrence for categories 1 through 5 as a function
of photochemical age.
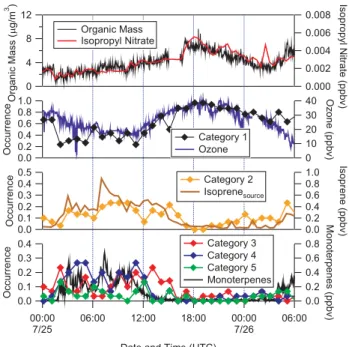
Fig. 11. Organic aerosol mass, isopropyl nitrate (a secondary
an-thropogenic volatile organic compound or VOC), ozone (from both biogenic and anthropogenic hydrocarbons), isoprene source (from de Gouw et al., 2005) and monoterpenes (biogenic VOCs), and the relative occurrence of categories 1 through 5 when the ship was sailing off the coast of Maine.
the region was a Canadian High, characterized by northerly or northwesterly winds from over Canada (Keim et al., 2005) with relatively high monoterpene emissions, moderate isoprene emissions, and low anthropogenic emissions (see Fig. 1). Biogenic organic aerosols were previously reported to be present during these conditions (Slater et al., 2002). Also shown are the organic mass loadings as well as the concentrations of ozone and selected volatile organic com-pounds (VOCs): isopropyl nitrate, isoprene from the source, and the sum of all the monoterpenes. As discussed by de Gouw et al. (2005) and shown in the top panel of Fig. 11,
the organic mass during this study is correlated with a sec-ondary anthropogenic species (isopropyl nitrate), despite the relatively high concentrations of isoprene and monoterpenes. For this time period, category 1 exhibits a distinct correla-tion with ozone. Indeed, 93% of the spectra when ozone concentrations are above 75 ppbv are placed in category 1 and 6% are placed in category 2. This is consistent with the relative contribution of m/z 44 to the total organic mass correlating with the fraction of calculated mass correspond-ing to secondary anthropogenic processes (de Gouw et al., 2005), which refer to reactions involving either biogenic or anthropogenic VOCs with secondary anthropogenic oxidants (ozone or nitrate radical) or with hydroxyl radical in the presence of high nitrogen oxide concentrations. Although the concentrations of monoterpenes and isoprene (shown in Fig. 5b of de Gouw et al., 2003) declined during the morn-ing on 25 July (1000 to 14:00 UTC or 6:00 to 12:00 local time), the isoprene source concentrations remained high for several hours, characteristic of an increased loss rate of the monoterpenes and isoprene from photochemistry as the air passed over the water to the ship rather than decreasing emis-sions or a change of air mass, as can be seen from Fig. 13a of de Gouw et al. (2005) showing the ship track and wind direction during this sampling period. Category 4 and to a lesser degree categories 3 and 5 correlate with the monoter-penes, which is consistent with their spectral similarities with
α-pinene oxidation products as shown in Fig. 5. Whereas
the rise of category 3 is simultaneous with the rise of the monoterpenes, its decline is delayed, which might be indica-tive of category 3 consisting of more oxidized, longer-lived monoterpene oxidation products that become relatively more abundant than category 4 and 5 species with increasing ex-posure to sunlight. Category 2 correlates better with the iso-prene source concentrations, corroborating its characteriza-tion as isoprene oxidacharacteriza-tion products. Note that the isoprene source term is determined from the first generation oxidation products (methacrolein and methyl vinyl ketone). Including the second generation products as well as the first genera-tion monoterpene products (such as pinonaldehyde) might show other trends. Shipboard measurements from 10:00 to 15:00 UTC indicate that the surface winds were from the same direction after sunrise, the wind speeds were approx-imately 5 knots, the ship moved much more slowly, and its track roughly paralleled the coast where the emissions were relatively constant. Hence, the time since emission for the air mass sampled from 10:00 to 15:00 UTC was approxi-mately 6 h. Therefore, the air sampled had left the coast dur-ing the night and was exposed to increasdur-ing levels of sunlight as the day progressed. Considering the quite constant wind direction, the increase of the organic mass and the rise of category 1 at 12:00 UTC are rather due to enhanced gas-to-particle conversion with the onset of solar illumination than with a change of air mass source region, implying that from 12:00 to 15:00 UTC the particulate organic mass rep-resented by category 1 could have biogenic sources. Minor
levels of primary anthropogenic contributions are confirmed by the toluene gas phase concentration (shown in Fig. 5a of de Gouw et al., 2003) which was less than 0.2 ppbv prior to 12:00 UTC and further declined when category 1 started to rise at 12:00 UTC. The correlations between the various bio-genic gas phase species and categories 2–5 are strong during the time period depicted in Fig. 11 when the anthropogenic VOC concentrations were relatively low (iso-propyl nitrate
<6 pptv and toluene <0.2 ppbv compared with plume
val-ues that are 5 times higher, see de Gouw et al., 2003, 2005). These trends (especially those with isoprene) are not as clear in other air masses due to the increased abundance of cate-gory 1 spectra as well as anthropogenic VOCs.
The findings shown here indicate that some of the organic material originated from biogenic species that may have been oxidized in the presence of anthropogenic pollution via ei-ther ozone, hydroxyl radicals, or nitrate radicals in the pres-ence of nitrogen oxides. Categories 2–5 appear to be char-acteristic of biogenic secondary organic aerosols (Figs. 5 and 6) and their occurrence is correlated with biogenic gas phase species (Fig. 11). Categories 2–5 are not as oxidized as category 1 spectra (Fig. 3) and they decrease in occur-rence during the middle of the day when category 1 was prominent (Fig. 9). The lack of correlation for category 1 with biogenic species does not preclude its organic material from being biogenic. Indeed, during 23 July from 15:30 to 18:00 UTC (11:30 to 14:00 local time) when 60–70% of the ozone is attributed to biogenic hydrocarbons as determined from the peroxycarboxylic nitric anhydrides (Williams et al., 1997; Marchewka et al., 2006), 75% of the AMS spectra are placed in category 1 and 25% are placed in category 2. On the basis of the evidence gathered in this study – comparison with reference spectra, delta analysis, incidence as a func-tion of wind direcfunc-tion, and correlafunc-tion with gas phase species – category 1 cannot be conclusively assigned to either bio-genic or anthropobio-genic particulate organic matter. Rather, it might contain anthropogenic and biogenic contributions that are not distinguished with the stopping condition used in the cluster analysis. Aerosol processing leading to similar ox-idation products for anthropogenic and biogenic precursors or strong fragmentation in the mass spectrometer might be reasons for high spectral similarities between anthropogenic and biogenic oxidation products. A high biogenic contribu-tion to category 1 would be in accordance with radiocarbon measurements which show that modern carbon (rather than carbon from fossil fuel) is prevalent in atmospheric aerosols in a variety of urban areas in the U. S. (Klinedinst and Currie, 1999; Lemire et al., 2002; Lewis et al., 2004; E. Edgerton, personal communication) and around the world (Shibata et al., 2004; Szidat et al., 2004).
3.6 Calculated biogenic organic mass from categories 2–5 Assuming all of the organic mass in categories 2–5 is due to biogenic species, the amount of biogenic organic mass can
25 20 15 10 5 0 A M S M as s C onc (ug/ m 3) 7/21 7/26 7/31 8/5 8/10 Date and Time (UTC)
Total Organic Mass
Biogenic Mass from Categories 2-5 Biogenic Mass from
de Gouw et al., 2005
Fig. 12. Time trends of the total organic mass (green), the
bio-genic mass calculated from the mass in categories 2-5 (black), and the biogenic mass calculated from the biogenic fraction of the or-ganic mass determined using the isoprene source concentrations by de Gouw et al., 2005 (yellow).
be calculated by an hourly average of the mass in those cate-gories. On an hourly basis the total organic mass from spec-tra in categories 2–5 was divided by the total organic mass in all categories (the fraction of organic mass in categories 2–5) and multiplied by the average organic mass. The cal-culated biogenic mass from the spectra is shown in Fig. 12 along with the biogenic mass determined from the fraction of organic mass attributed to biogenic processes based on the isoprene source concentrations (de Gouw et al., 2005). The agreement in the calculated biogenic mass is quite good for the second part of the study and during high mass load-ing periods. Durload-ing the time period off the coast of Maine, the biogenic mass from the categories is significantly higher than that from the gas phase parameterization likely because monoterpenes were not included. Because category 1 is the most abundant category during the campaign, an accurate quantification of the contribution of biogenic species to the organic aerosol mass strongly depends on the estimated bio-genic contribution to category 1. If it was significant, the biogenic mass loadings shown in Fig. 12 would be a lower limit. On the other hand, a part of the mass especially in cat-egory 2 but also in categories 3–5 might be anthropogenic. The assumption that the mass in categories 2–5 is totally bio-genic might therefore lead to an overestimate of the biobio-genic organic mass at times when these categories are abundant. With this in mind, the contribution of biogenic species to the total organic mass by categories 2–5 alone averaged 17% for the entire study and 10% (ranging from 0–50%) when the total organic mass was more than 10 µg/m3. These val-ues are comparable to 12% of the organic mass being at-tributed to biogenic sources for the whole dataset by the gas phase method (de Gouw et al., 2005). A scatter plot of bio-genic mass calculated from the AMS data versus that from the gas parameterization is shown in Fig. 13. In order to make this plot, the gas phase data (biogenic mass
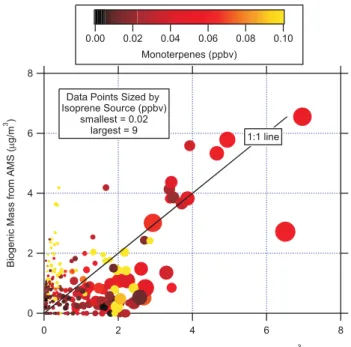
calcula-Fig. 13. A scatter plot of biogenic mass calculated from the AMS
data (black trace in Fig. 12) versus that from the gas parameteriza-tion (yellow trace in Fig. 12, de Gouw et al., 2005).
tion from the gas phase parameterization and the isoprene source concentration) and the monoterpene concentrations were averaged to the AMS hourly average times. The cor-relation of all the data is quite weak (slope=0.77, r2=0.33). The time period depicted in Fig. 11 is represented by the high monoterpene data (yellow points) above the 1:1 line, where the AMS calculation is larger than the gas parameter-ization. This is because the gas parameterization does not include monoterpene compounds whereas the AMS calcula-tion apparently does. Data where the isoprene source con-centrations are low may indicate either low original biogenic emissions or aged biogenic airmasses that have lost MVK and MACR in addition to isoprene. The data with high iso-prene source concentrations (>0.5 ppbv) and low monoter-pene concentrations (<0.08 ppbv) do appear to correlate bet-ter (slope=0.78, r2=0.55). A slope less than 1 may be an in-dication that there is some biogenic contribution to category 1 that is not included in the AMS biogenic mass calculation. Most of the highest biogenic mass calculations (>4 µg/m3)
are comparable with the two methods whereas the lowest bio-genic mass calculations differ by less than 4 µg/m3. Further-more, the highest “biogenic” mass concentrations occurred for isoprene rather than monoterpene biogenic species. 3.7 Categories with a large peak at m/z 30
Mass spectrometer signals at m/z 30 and 46 can arise from many species, yet the most prevalent in atmospheric submi-cron particles are ammonium nitrate and organic nitrate. In
5 4 3 2 1 0 Re la ti ve O ccu rr e n c e (% ) 00:00 06:00 12:00 18:00 00:00 Time of Day (UTC)
Category 7 Category 13 20 15 10 5 0 Re la ti ve O c cu rr e n c e (% ) 50 40 30 20 10 0 Photochemical Age (hrs) Category 7 Category 13
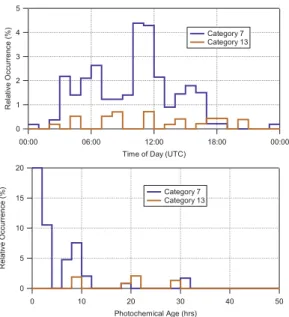
Fig. 14. Relative occurrence for categories 7 and 13 as a function
of time of day (top panel) and photochemical age (bottom panel).
the NEAQS 2002 study, the average mole ratio of ammo-nium to sulphate was 1.7 from the AMS data and 1.5 from the PILS data, which indicates that on average not all of the sulphate was completely neutralized with ammonium. Since sulphate needs to be neutralized in order for signifi-cant amounts of ammonium nitrate to form, it is not surpris-ing that the average nitrate levels for the entire study were low (Quinn and Bates, 2003; Brown et al., 2004; Bates et al., 2005). Mass m/z 30 could also arise from sodium nitrate formed in the atmosphere by reactions of nitrogen oxides with sea salt (e.g., Beichert and Finlayson-Pitts, 1996; Noble and Prather, 1997). Sodium nitrate has been detected in at-mospheric particles with an AMS operating at 850◦C, which is a fairly high vaporization temperature necessary to detect sea salt (Allan et al., 2004b). Indeed, sodium nitrate was present during short periods of the NEAQS study when sub-micron sodium and nitrate were detected by the PILS instru-ment. However, the vaporization temperature of the AMS during NEAQS 2002 was 550◦C (too low to efficiently
va-porize sodium nitrate) and AMS nitrate concentrations were typically low during time periods when submicron sodium nitrate was present.
Both categories 7 and 13 contain large peaks at m/z 30: in category 7 it is the dominant peak whereas it is the sec-ond most common peak after m/z 44 in category 13 (Fig. 3). The two categories are quite similar and their dot product is 0.76; without m/z 44 their dot product is 0.82. Category 7 is mainly observed between 03:00 and 17:00 UTC (23:00 and 13:00 local time), with a significant peak between 10:00 and 12:00 UTC (top panel of Fig. 14). At this time (6:00 to 8:00 local), NO3 and N2O5 are depleted, HNO3 is at a
morning minimum, OH is beginning to increase, and there
are large concentrations of NOxwhich can form HNO3and
organic nitrates (Brown et al., 2004). In contrast, the cate-gory 13 spectra are observed throughout the day (top panel of Fig. 14). Although there are less data points to consider, the category 7 spectra have a strong decreasing trend with photochemical age (bottom panel of Fig. 14) compared to the spectra in categories 1–5 (Fig. 10). Furthermore, category 7 spectra represent over 30% of the freshest air masses sam-pled (ages<4 h). There are only 5 spectra from category 13 with corresponding gas phase data for calculating their pho-tochemical ages; yet they are present in older air masses than the spectra in category 7. Thus, the relative contributions of aerosol “nitrate” at m/z 30 and oxidized organic material at
m/z 44 in these categories appear to be attributable to
differ-ences in photochemical ages of the air masses sampled, with the older air masses (category 13 as well as all the top 5 cat-egories) containing more oxidized organic material than the younger air masses (category 7).
The category 7 spectra appeared when both the AMS and PILS instruments detected significant nitrate levels, the sub-micron sodium mass was less than 0.2 µg/m3, and the or-ganic mass was less than 5 µg/m3. For these spectra, the sulphate mass was always less than 4 µg/m3 and there was generally more ammonium than predicted if the sulphate was completely neutralized. Consequently, the spectra in cate-gory 7 are likely from particles containing ammonium ni-trate.
The organic mass was less than 1 µg/m3and the sulphate mass was nearly always less than 1 µg/m3when category 13 spectra were present. For these spectra, the ammonium mass was below the detection limit (0.7 µg/m3), so the degree of sulphate neutralization could not be determined. Hence, the source of the signal at m/z30 in the category 13 spectra is unclear.
In addition to being in categories 7 and 13, m/z 30 is present at lower levels in the other top 15 categories (Ta-ble 3). Yet on average the sulphate in these particles was slightly acidic and ammonium nitrate did not usually form. The AMS nitrate did not correlate well overall with the PILS nitrate, probably because the PILS detected soluble nitrate (from ammonium and sodium nitrate) and the AMS detected volatile nitrate (from ammonium and organic nitrate). The ratios of m/z 30 to m/z 46 for the NEAQS 2002 data are typ-ically greater than 5, which is larger than the ratio from lab-oratory calibrations of ammonium nitrate particles (around 2). Ratios larger than 4 for these peaks have also been ob-served in oxidation studies where ammonium nitrate was not present (Alfarra et al., 2006; Bahreini et al., 2005). In fact, the reference spectra from isoprene and methacrolein oxidation products (Fig. 4b) have m/z 30 with an intensity that is similar to typical values in the top five categories (Fig. 3) and so m/z 30 could have organic contributions or perhaps nitric acid was produced in the smog chamber stud-ies. Therefore, m/z 30 in many of the NEAQS 2002 spectra could be due to organic nitrate (if relatively more NO+than
NO+2 is formed compared to ammonium nitrate), an oxy-genated organic fragment (CH2O+), and/or an amine
frag-ment (CH4N+). Unless a high resolution mass spectrometer
is used to separate these isomers at m/z 30 (such as described by DeCarlo et al., 2006), the identification of the species con-tributing to this peak remains ambiguous.
3.8 Comparison of cluster analysis with single particle or ensemble data
While the method of generating clusters of mass spectra with single particle data or with ensemble data is similar, the prin-ciple goals of cluster analysis with these two types of data are different. From single particle data, the results of the cluster analysis are indicators of mixing state of individual particles. For example, spectra from individual particles measured in the stratosphere formed major clusters composed of primar-ily sulphate. Some were observed to also contain meteoritic material and trends in these particles were used to determine their source and approximate residence time (Murphy et al., 1998). In the troposphere, a wider variety of distinct par-ticle types have been detected (e.g., Sullivan et al., 2006; Pekney et al., 2006; Ondov et al., 2006). However, most par-ticles in the troposphere are composed of internally-mixed sulphate/carbonaceous material (Murphy et al., 2006). These particles are formed by coagulation, gas-to-particle partition-ing, and particle-to-particle repartitioning (Marcolli et al., 2004) rather than co-emission since sulphate and organic par-ticulate material do not originate from the same source.
In contrast, cluster analysis of ensemble data cannot infer the mixing state of individual particles; spectral signatures of groups of particles can be used to infer “mixing state” of air masses. In this study, most of the organic material in the air masses sampled had similar spectra features and, when com-bined with the gas-phase data, implied that aged air masses may be homogeneous. Furthermore, the AMS data are quan-titative, thus providing an estimate of the biogenic organic mass based on spectra clusters.
For both types of data sets, the relative occur-rence/frequency of various clusters must be weighted with the mass or number concentration to determine their relative importance. In this study, the largest classification of spec-tra (category 1) comprised 75% of the specspec-tra sampled and represented a larger fraction of the organic mass (82%). With the laser-based single particle instrumentation, quantification is difficult to achieve mainly due to irregular ionization ef-ficiencies. Strides in single particle quantification may be possible with the new high-resolution, time-of-flight AMS instruments (DeCarlo et al., 2006; Canagaratna et al., 2006). Cluster analysis works best on data sets with distinct fea-tures, affecting the results from single particle and ensemble data. Those with a continuum can place spectra in different classes yet the variations may be due to differences in relative peak intensities rather than purely different particle composi-tions (Middlebrook et al., 2003). Here we found that the
rela-tive importance of m/z 44 affects the placement of ensemble spectra in different clusters. Nevertheless, cluster analysis has been useful in this application for separating out various spectral features that tended to be indicative of the air masses sampled.
3.9 Comparison of hierarchical clustering with other data analysis methods
Many mass spectra in the analyzed AMS dataset were very uniform with a strong peak at m/z 44 as the main feature. The remaining spectra exhibited considerable variation of spectral characteristics that seemed to be specific for differ-ent sources or aging processes. In a principal compondiffer-ent analysis, such minor numbers of mass spectra could easily be missed, since this method is designed to capture the main variances of a dataset. Moreover, a principal component analysis per se is not able to extract characteristic spectra but produces factors that are not directly comparable with refer-ence spectra. An alternative way of analyzing AMS data is their deconvolution based on mass spectral tracers as demon-strated by Zhang et al. (2005a). This method must anticipate the relevant peaks and might become inconvenient if a high number of tracers were required. In contrast to this tech-nique, the cluster analysis neither needs a preselection of rel-evant peaks nor any additional information such as gas phase concentrations of correlated species or wind directions. The use of the dot product as a similarity criterion for clustering implies that the most intense peaks primarily determine the categorization and are therefore the common features of all spectra in a category. In the investigated dataset, peaks with
m/z below 50 dominate the organic mass signals. Since they
are fragments of larger molecules and indicative of functional groups, they cannot be used to identify the presence of spe-cific organic molecules. Nevertheless, clustering based on these low m/z peaks was able to extract categories that match well the mass spectral signatures of monoterpene and iso-prene oxidation products and identify spectra with contami-nants. Thus, the clusters derived from the hierarchical cluster analysis can be employed to facilitate the further analysis of a dataset, either by comparing with other measurements and source identification or inspecting the representative spectra of each cluster and comparing with reference spectra. This technique may also be useful in probing the ’partly oxidised’ mass spectra, frequently observed by the AMS when sam-pling regional emissions, that conform to neither the model “hydrocarbon-like” or “oxidized” organic aerosol defined by Zhang et al. (2005a).
In the present dataset, 75% of the spectra are assigned to one category without any further discrimination. To retrieve additional information regarding the behaviour within cate-gory 1, the cluster analysis could be repeated with a stricter stopping condition leading to more categories. Repeating the cluster analysis with a whole set of stopping conditions might indeed be beneficial to elaborate specific features of
the dataset. A prior knowledge of air mass history or possible reference spectra might help to optimize the stopping con-dition and thus increase the relevance and specificity of the categories. Alternatively, a dataset could be clustered around a database of references allowing a direct assignment of at least a part of the spectra. Since hierarchical cluster analysis does not resolve spectra of mixtures into their components but just categorizes them according to their dominant fea-tures, it needs air masses that show varying compositions as a function of time to retrieve different aerosol types. This condition was fulfilled for the present dataset collected on a mobile platform. Time series from urban studies where complex mixtures are continuously sampled might show less variation as a function of time. In this case, its ability to iso-late different aerosol types will be limited. The categoriza-tion of each spectrum according to its dominant feature also sets a limitation on the ability of hierarchical cluster anal-ysis to yield quantitative results. Clusters might represent mixtures of sources which can not be further taken apart. Nevertheless, the quantification of the biogenic aerosol frac-tion based on the occurrence of categories 2–5 gave a rea-sonable agreement with the biogenic fraction derived from correlations with gas phase species. Taken together, hierar-chical cluster analysis allows to assess the spectral variabil-ity within an AMS dataset and can serve as a guide for fur-ther analysis. Application of hierarchical cluster analysis to further AMS datasets and comparison with other methods is needed to evaluate the potential of this technique more thor-oughly.
4 Conclusions
Hierarchical cluster analysis was for the first time applied to an AMS dataset. Exclusion of peaks with inorganic contri-butions except for the nitrate peaks allowed us to focus on the organic aerosol fraction. The cluster analysis yielded a series of categories that are distinguishable with respect to their mass spectra and their occurrence as a function of time and wind direction. Furthermore, the spectral signatures of low m/z peaks in the most common categories are similar to reference spectra from field campaigns or generated in laboratory chamber studies. On the basis of the combined information (spectral and trace gas correlations), category 2 contains contributions from isoprene oxidation products and the organic mass in categories 3 through 5 appears to be formed by oxidation of monoterpenes. Taken together, cat-egories 2 through 5 represent up to 5 µg/m3of biogenic or-ganic aerosol mass, averaging 17% of the total oror-ganic mass for the entire study and only 10% of the total organic mass when the total organic mass is greater than 10 µg/m3. In con-trast, the source of the organic mass in the category 1 spectra is unclear, since the spectra were placed in that category be-cause they had a large signal at m/z 44, which is indicative of highly oxidized organic material irrespective of its origin.
This study demonstrates that hierarchical clustering is a use-ful tool to analyze the complex patterns of the organic peaks in bulk aerosol mass spectra from a field study.
Acknowledgements. This work was supported by the Swiss
National Foundation under contract No. 200020-10365/1 and the NOAA Health of the Atmosphere program. We thank T. Peter for making this collaboration possible and the crew of the NOAA research vessel Ronald H. Brown for their assistance during the 2002 NEAQS study. The aerosol group at NOAA PMEL headed by T. Bates and T. Quinn provided the inlet and helpful discussions about the data. Several people provided fruitful discussions about the data acquisition and analysis: M. Aldener, C. Brock, S. Brown, H. Coe, P. DeCarlo, E. Edgerton, C. Eubank, K. Hayden, P. Hudson, J. Jayne, J. Jimenez, J. Kimmel, J. Kroemer, J. Kroll, B. Matthew, P. Murphy, C. Simons, H. Stark, D. Sueper, Q. Zhang, and P. Ziemann. We appreciate receiving unpublished AMS reference spectra from R. Alfarra and S. Murphy. We are especially grateful to J. Allan for developing the AMS data analysis software, Matt Warshawsky for developing the original PALMS clustering algorithm, and D. Murphy for assistance with adapting it for the AMS data.
Edited by: Y. Rudich
References
Alfarra, M. R., Coe, H., Allan, J. D., Bower, K. N., Boudries, H., Canagaratna, M. R., Jimenez, J. L., Jayne, J. T., Garforth, A. A., Li, S. M., and Worsnop, D. R.: Characterization of urban and rural organic particulate in the Lower Fraser Valley using two Aerodyne aerosol mass spectrometers, Atmos. Environ., (Pacific 2001 special issue), 38, 5745–5758, 2004.
Alfarra, M. R., Paulsen, D., Gysel, M., Garforth, A. A., Dommen, J., Prevot, A. S. H., Worsnop, D. R., Baltensperger, U., and Coe, H.: A mass spectrometric study of secondary organic aerosols formed from the photooxidation of anthropogenic and biogenic precursors in a reaction chamber, Atmos. Chem. Phys., 6, 5279– 5293, 2006,
http://www.atmos-chem-phys.net/6/5279/2006/.
Alfarra, M. R.: Insights into atmospheric organic aerosols using an aerosol mass spectrometer, PhD thesis under Prof. H. Coe, Univ. of Manchester, pp. 79–98 and 215–225, 2004.
Allan J. D., Alfarra, M. R., Bower, K. N., Williams, P. I., Gal-lagher, M. W., Jimenez, J. L., McDonald, A. G., Nemitz, E., Canagaratna, M. R., Jayne, J. T., Coe, H., and Worsnop, D. R.: Quantitative sampling using an Aerodyne aerosol mass spec-trometer, 2. Measurements of fine particulate chemical com-position in two U.K. cities, J. Geophys. Res., 108(D3), 4091, doi:10.1029/2002JD002359, 2003b.
Allan J. D., Jimenez, J. L., Williams, P. I., Alfarra, M. R., Bower, K. N., Jayne, J. T., Coe, H., and Worsnop, D. R.: Quantitative sampling using an Aerodyne aerosol mass spectrometer, 1. Tech-niques of data interpretation and error analysis, J. Geophys. Res., 108(D3), 4090, doi: 10.1029/2002JD002358, 2003a.
Allan, J. D., Bower, K. N., Coe, H., Boudries, H., Jayne, J. T., Canagaratna, M. R., Millet, D. B., Goldstein, A. H., Quinn, P. K., Weber, R. J., and Worsnop, D. R.: Submicron aerosol