HAL Id: hal-02367816
https://hal.archives-ouvertes.fr/hal-02367816
Submitted on 18 Nov 2019
HAL is a multi-disciplinary open access
archive for the deposit and dissemination of
sci-entific research documents, whether they are
pub-lished or not. The documents may come from
L’archive ouverte pluridisciplinaire HAL, est
destinée au dépôt et à la diffusion de documents
scientifiques de niveau recherche, publiés ou non,
émanant des établissements d’enseignement et de
An iterative statistical tolerance analysis procedure to
deal with linearized behavior models
Antoine Dumas, Jean-Yves Dantan, Nicolas Gayton, Thomas Bles, Robin
Loebl
To cite this version:
Antoine Dumas, Jean-Yves Dantan, Nicolas Gayton, Thomas Bles, Robin Loebl. An iterative
sta-tistical tolerance analysis procedure to deal with linearized behavior models. Journal of Zhejiang
University-SCIENCE A, 2015, 16 (5), pp.353-360. �hal-02367816�
Journal of Zhejiang University-SCIENCE A
CIRP CAT-079 : An iterative tolerance analysis procedure to deal with linearized
behavior models
--Manuscript
Draft--Manuscript Number:
Full Title: CIRP CAT-079 : An iterative tolerance analysis procedure to deal with linearized behavior models
Article Type: Article
Corresponding Author: Antoine Dumas
Arts et Métiers ParisTech FRANCE
Corresponding Author Secondary Information:
Corresponding Author's Institution: Arts et Métiers ParisTech Corresponding Author's Secondary
Institution:
First Author: Antoine Dumas
First Author Secondary Information:
Order of Authors: Antoine Dumas
Jean-Yves Dantan, Pr. Nicolas Gayton, MCF HdR Thomas Bles
Robin Loebl Order of Authors Secondary Information:
Abstract: Tolerance analysis consists of analyzing the impact of variations on the mechanism behavior due to manufacturing process. The goal is to predict its quality level at the design stage. The technique involves in computing probabilities of failure of the mechanism in a mass production. Analysis methods have to consider components variations as random variables and the worst configuration of gaps for hyperstatic systems. This consideration varies in function of the type of mechanism behavior and are realized by an optimization scheme combined with a Monte Carlo simulation. In order to simplify the optimization, it is required to linearize into several parts the mechanism behavior. This paper aims at analyzing the impact of the linearization strategy on the probability of failure estimation ; a highly hyperstatic mechanism with two pins and five cotters illustrates this study. The purpose is to strike a balance between model error caused by the linearization, computing time and result accuracy. In addition, an iterative procedure is proposed for the assembly requirement in order to provide accurate results without driving the entire Monte Carlo simulation.
An iterative tolerance analysis procedure to deal with linearized
behavior models
Antoine Dumas
a,b,*, Jean-Yves Dantan
a, Nicolas Gayton
b, Thomas Bles
a, Robin Loebl
aaLCFC, Arts et Métiers ParisTech Metz, 4 rue Augustin Fresnel, 57078 METZ CEDEX 3, France bClermont Université, IFMA, UMR 6602, Institut Pascal, BP 10448, F-63000Clermont-Ferrand, France
Abstract
Tolerance analysis consists of analyzing the impact of variations on the mechanism behavior due to manufacturing process. The goal is to predict its quality level at the design stage. The technique involves in computing probabilities of failure of the mechanism in a mass production. Analysis methods have to consider components variations as random variables and the worst configuration of gaps for hyperstatic systems. This consideration varies in function of the type of mechanism behavior and are realized by an optimization scheme combined with a Monte Carlo simulation. In order to simplify the optimization, it is required to linearize into several parts the mechanism behavior. This paper aims at analyzing the impact of the linearization strategy on the probability of failure estimation ; a highly hyperstatic mechanism with two pins and five cotters illustrates this study. The purpose is to strike a balance between model error caused by the linearization, computing time and result accuracy. In addition, an iterative procedure is proposed for the assembly requirement in order to provide accurate results without driving the entire Monte Carlo simulation.
Keywords: tolerance analysis; probability of failure; linearization of behavior model; Monte Carlo simulation; optimization
1. Introductiona
Due to the imprecision associated with manufacturing process, it is not possible to attain the theoretical dimensions in a repetitive manner. It may cause a degradation of the product performance. In order to ensure the desired behavior and the performance of the system in spite of manufacturing imprecisions, the component characteristics are assigned a tolerance zone within which the value of the characteristics i.e. situation and intrinsic lie.
Moreover, technology is always increasing and performance requirements continually tighten. In the same time, the cost and the required precision of assemblies increase. More attention is therefore needed to tolerance design so as to be able to manufacture high-precision assemblies at lower costs. Therefore, tolerance analysis is a key element in industry for improving product quality and decreasing the manufacturing cost.
Tolerance Analysis concerns the verification of functional requirements after tolerances have been specified on each isolated part. Analysis methods are divided into two categories:
Displacement accumulation which goal is to model the influences of the deviations on the geometrical behavior of the mechanism. The relation uses the following form Y = f(X,G) [1], where Y is the response of the system (a characteristic such as a gap or a functional characteristic), X is the vector of deviation values (situation or/and intrinsic deviations) of parts composing the mechanism, and G is the vector of gaps between the parts of the mechanism. The function f represents the deviation accumulation of the mechanism; it can be an explicit analytical expression, an implicit analytical expression or a numerical simulation. The difficulty in determining the function f increases with the complexity of the studied system [2 - 4]. In the case of analytical formulation, the mathematical formulation of the behavior model can be written from topological loop relations of the system as well as constraints to prevent surfaces from penetrating into others. In addition, the analysis method must consider the worst admissible configuration of gaps which is realized using an optimization algorithm. However, non linear analytical models are difficult to handle which is why a linearization of non linear equations is required.
Tolerance accumulation aims at simulating the composition of tolerances i.e. linear tolerance accumulation, 3D accumulation. The admissible deviations are mapped using several vector spaces in a region of hypothetical parametric space. The literature mentions several techniques to represent geometrical tolerances or dimensioning tolerances, among which T-maps [5, 6], gap spaces [7] and deviation domains [8]. All these
Manuscript
Click here to download Manuscript: An iterative tolerance analysis procedure to deal with linearized behavior models.docx
1 2 3 4 5 6 7 8 9 10 11 12 13 14 15 16 17 18 19 20 21 22 23 24 25 26 27 28 29 30 31 32 33 34 35 36 37 38 39 40 41 42 43 44 45 46 47 48 49 50 51 52 53 54 55 56 57
2
methods require mathematical tools such as the Minkowski sums and the intersection of domains so as to compute the quality level of the product. In order to be able to perform these operations, behavior models must be in a linear form.
Both categories need a linearization of the behavior model to compute the quality levels of the product. In fact, tolerance analysis is totally dependent on the models chosen to describe the system behavior.
This paper focuses on the impact of the linearization of the behavior model on the statistical tolerance analysis which is based on the displacement accumulation theory. To manage the probability of out-tolerance products and evaluate the impact of component tolerances on product performance, designers need to simulate the influences of manufacturing imprecisions with respect to the functional requirements. In this case, the goal of tolerance analysis is to predict a quality level during the design stage, the technique consists of computing two probabilities of failure, one relative to the assembly Pfa and one relative to the functionality Pf.
This paper intends to show that the linearization procedure has an impact on the probability of failure accuracy and presents an adaptive algorithm able to compute accurate probability faster than with the classical solution method. The next section of this paper describes the mathematical formulation of a statistical tolerance
analysis problem as well as the solution method to compute the probabilities of failure. Section 3 presents the considered linearization strategies of the behavior model. Section 4 focuses on the adaptive algorithm by detailing the step of the algorithm to be followed. The algorithm is applied on an industrial application and compared to the reference results in Section 5. A conclusion ends the paper.
2. Statistical tolerance analysis of over-constrained mechanisms
We can distinguish three main issues in tolerance analysis: 1. The models for representing the geometrical deviations,
2. A mathematical model for calculating the system behavior with deviations, 3. The development of the analysis methods.
This paper focuses on the impact of the second issue on the third issue. The goal of this section is to describe the current method to solve a tolerance analysis problem, from the formulation to the solution method. Subsection 2.1 deals with the mathematical formulation of a statistical tolerance analysis problem. Subsection 2.2 shows the analysis method used to compute the probabilities of failure.
2.1. Formulation of a tolerance analysis problem
Most of mechanisms have gaps between parts which make the behavior model more complex to be modeled. Gaps are considered as free variables, they depend on the geometrical deviations and on the part configuration of the mechanism. The behavior model must take into account those gaps by limiting their displacement in order to avoid the interpenetration of one surface into another. Boundaries are therefore defined using interface constraints written as follows:
( )
1, , , 0 Ci k i k N C X G (1)where NCi is the number of interface constraints. The mechanical behavior of the mechanism is modeled using
compatibility equations, these are the composition relations of displacements in the various topological loops. The set of equality equations provides a linear system to be satisfied. They are written as follows:
( )
1, , , 0 Cc k c k N C X G (2)where NCc is the number of compatibility equations.
The formulation of both requirements is based on quantifiers. The assembly requirement is given by Qureshi et al. [9]:“For all admissible deviations, there exists a gap configuration such as the assembly requirements and the
behavior constraints are verified”. The assembly probability of failure Pfa is then given in Equation (3). The technique
to compute this probability is to minimize one interface constraint with all compatibility equations and interface constraints to be satisfied. A solution means that the assembly is possible, on the contrary the assembly is impossible if no solution exists. 1 2 3 4 5 6 7 8 9 10 11 12 13 14 15 16 17 18 19 20 21 22 23 24 25 26 27 28 29 30 31 32 33 34 35 36 37 38 39 40 41 42 43 44 45 46 47 48 49 50 51 52 53 54 55 56 57 58 59 60 61 62 63 64 65
| , 0 1 Prob , 0 m c fa i C P C G X G X G (3)The functional requirement is also defined by Qureshi et al. [9]:“For all admissible gap configurations, the
geometrical behavior and the functional requirements are verified”. The functional requirement implies the functional
characteristic Y to not exceed a threshold value Yth. A functional condition is defined, Cf = Yth - Y, a positive value
ensures the mechanism to be functional. However, all configurations do not have to be checked, indeed, in order to compute Pf, it is necessary to find at least one admissible configuration where the functional condition is not
respected:
Prob m| , 0 f adm f P G C X G (4)where Gadm are gaps values verifying all interface constraints and compatibility equations. This corresponds with
finding the worst gap configuration; this configuration provides the worst value of the functional condition. The technique to find the worst admissible configuration of gaps for the functional condition is to minimize Cf with all
constraints, see Equation (5).
min , Prob with , , f f c i C P C C G X G X G X G 0 0 0 (5)2.2. Solution method based on Monte Carlo simulation and optimization
The classic solution method combines a Monte Carlo simulation and an optimization algorithm [9]. The functional condition is linear. In addition, all constraints are linear, if not the linearization procedure proposed in Section 3 is applied. An optimization scheme using a simplex technique is therefore chosen to solve the optimization problems. The different steps of the solution procedure are described below:
1. Define the Monte Carlo population: a set of N samples x = {x(1), ... , x(N)} from the random vector X is created, 2. Launch the optimization algorithm for each sample,
3. Estimate Pfa and/or Pf, the probabilities of failure are estimated using the following equation:
( ) 1 1 Prob N i fa Dfa i P I x N
(6)
( ) 1 1 Prob N i f Df i P I x N
(7)where ID (X) is the indicator function; for the assembly requirement the function is:
1 if no solution can be found. 0 if a solution is found.Dfa I
X (8)
For the functional requirement it is defined as follows:
min
min 1 if , 0 0 if , 0 f Df f C I C X G X X G (9)The number N of samples can be defined in order to yield a coefficient of variation, see Equation (10), lower than an given accuracy, usually lower than at least 10%.
1 2 3 4 5 6 7 8 9 10 11 12 13 14 15 16 17 18 19 20 21 22 23 24 25 26 27 28 29 30 31 32 33 34 35 36 37 38 39 40 41 42 43 44 45 46 47 48 49 50 51 52 53 54 55 56 57
4 1 . . f f P f P C O V NP (10)
3. Illustration of the linearization procedure
This section shows the different considered linearization strategies. Subsection 3.1 presents a simple mechanism in order to show what type of non linear equations needs to be linearized. Subsection 3.2 describes the mathematical linearization procedure on such non linear constraints.
3.1. Illustration on 2D mechanism
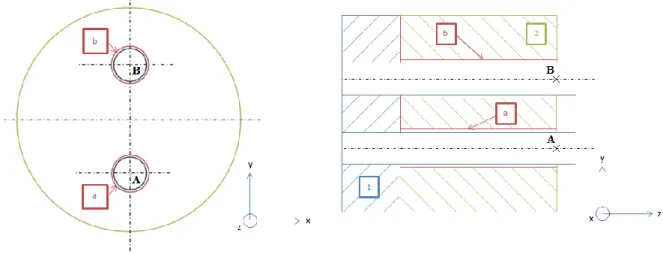
The example, see Fig. 1, is a simplified version in 2D of the industrial mechanism shown in Fig. 6. This mechanism is constituted of two pins, part (1), in relative displacement with part (2). Both pins are fixed in a workpiece.
Geometrical deviations are considered in this mechanism [9]:
Intrinsic deviations: diameters of pins and their pin holes: d1a, d2a, d1b and d2b.
Situation deviations: orientation and position variations of the substitute surfaces a and b with respect to their respective nominal surfaces. The deviation of the substitute surface a of part (1) with respect to its nominal surface is written u1a1 and v1a1 (translation along the x-axis and y-axis) and 1a1 (rotation around the z-axis).
Fig. 1. Representation of the simplified 2D hyperstatic mechanism with a side view.
Small Displacement Torsors [4] are used to represent gaps between the joints of the mechanism. Two torsors are built to model variations in orientation and location of each pin. These torsors are written {G1a/2a}A and {G1b/2b}B
where "1a/2a,A'' means these are the variations of the surface a of part (1) with respect to surface a of part (2) applied to point A, and expressed as follows:
/
a aA a a A a aA a a u G v 1 2 1 2 1 2 1 2 0 (11)The geometrical behavior of this mechanism is made up of 3 compatibility equations Cc(X,G) = 0 and 2 interface
constraints Ci(X,G) ≤ 0 characterizing the non-interpenetration of the pins in their holes. These constraints are given
by the quadratic equations (12) and (13).
2 (1) 2 2 1 2 1 2 1 2 0 2 a a i a aA a aA d d C u v (12) 1 2 3 4 5 6 7 8 9 10 11 12 13 14 15 16 17 18 19 20 21 22 23 24 25 26 27 28 29 30 31 32 33 34 35 36 37 38 39 40 41 42 43 44 45 46 47 48 49 50 51 52 53 54 55 56 57 58 59 60 61 62 63 64 65
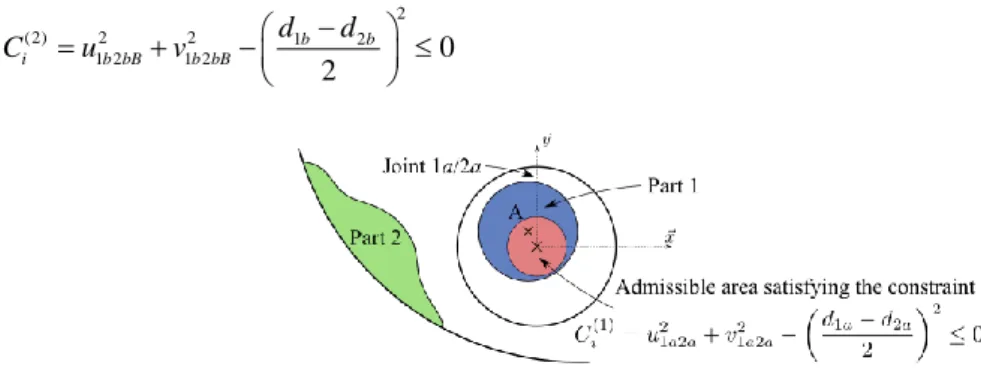
2 (2) 2 2 1 2 1 2 1 2 0 2 b b i b bB b bB d d C u v (13)
Fig. 2. Admissible area of displacement of pin centre A to satisfy the interface constraints of joint 1a/2a.
These inequations specify an admissible displacement area of the centre A and B of pins (2) and (3) in order to not penetrate part (1), see Fig. 2. Linearization has to occur on such constraints in order to simplify the optimization scheme. Indeed, handling non linear constraints is more difficult than linear constraints. In addition, both equations
(11) and (12) are similar, the linearization procedure is therefore illustrated on a reference equation, shown Equation (14).
3.2. Illustration of linearization strategies on constraints
This section describes different strategies for the linearization of the non linear equations. These equations results from a cylinder type joint and provide quadratic interface constraints. For a simple 2D circle, the quadratic equation to be linearized is written as defined Equation (13).
i
C u v u2v2 R2
, (14)
where R is the circle radius difference and u and v represent the displacements along the x-axis and y-axis.
Fig. 3. The 2 types of discretization of the real admissible area of displacement, here with 6 facets.
Linearization corresponds to a discretization of the admissible area of displacement, which is a 2D circle, into a polygon whose number of facets depends on Nd. Several discretization strategies are considered, see Fig. 3. Given
2 2 20
i
C u v, u v R , an interface constraint, the linearization operation provides new inequations depending on the type of linearization:
Type 1: Discretization following an inner polygon:
( ) , cos sin cos 1 0
2
k
i k k
C u v u v R (15)
Type 2: Discretization following an outer polygon:
( ) , cos sin 0 k i k k C u v u v R (16) 1 2 3 4 5 6 7 8 9 10 11 12 13 14 15 16 17 18 19 20 21 22 23 24 25 26 27 28 29 30 31 32 33 34 35 36 37 38 39 40 41 42 43 44 45 46 47 48 49 50 51 52 53 54 55 56 576
where k = 2k / Nd, for k = 1, ... , Nd, is an angle whose parameter Nd enables the number of linearizations to be
adjusted and so 1 = 2 / Nd. One interface constraint becomes Nd interface constraints, increasing significantly the
number of constraints, but these constraints have the advantage of being linear in displacement.
4. Confidence Interval based algorithm for the assembly requirement
In this section, an algorithm is proposed to compute accurate probability faster than with the current solution method. The procedure is based on a Monte Carlo simulation and take advantage of the confidence interval on the probability of failure obtained by combining both linearization strategies for a given number of linearizations. This algorithm is tested and compared with the classical Monte Carlo method in Section 5.
The assembly requirement has two interesting properties that are used in the proposed algorithm. First, considering the inner strategy, if a point allows the mechanism to be assembled with a given number of linearizations Nd1, then it
will always be the case with a greater number of linearizations Nd2 > Nd1 on condition that edges of each polygon
coincides, seeFig. 4. So to improve the probability accuracy with this strategy, it is sufficient to evaluate again with a greater number of linearizations only non assembly points. As for the second property, for a given number of linearizations Nd, the entire set of non assembly points with the outer strategy is included in the set of the non
assembly points with the inner strategy. It means that to compute the probability of failure with the outer strategy, it is sufficient to only evaluate non assembly points with the inner strategy.
Fig. 4. Two inner polygons with different number of linearizations: Nd1 = 6, Nd2 = 18.
Furthermore, all non assembly points found with the outer strategy will always be whatever a greater value Nd. Fig.
5 shows a linearization of a real area of displacement with both strategies, uncertain points can therefore be defined: these are points between the inner and the outer polygon.
Fig. 5. Two polygons with the inner and outer strategies for the same number of linearizations.
The goal of the algorithm is to achieve a classical Monte Carlo simulation with a small number of linearizations Nd.
The probability of failure with the inner strategy is first computed. By computing again only non assembly points from the previous simulation with the outer strategy, the probability of failure for this case can be quickly known. The relative confidence interval, see Equation (17), between both probabilities can be computed; if this interval is small enough, then the procedure ends otherwise the number of linearizations is increased and the procedure is launched again only on uncertain points. The algorithm steps are described below:
1. Set a small number of linearizations, e.g. Nd0 = 4.
2. Achieve a Monte Carlo simulation with the inner strategy: compute Pfa_inner.
3. Save non assembly points from the Monte Carlo simulation (points outside the inner polygon). 4. Perform a Monte Carlo with the previous saved points with the outer strategy: compute Pfa_outer. 1 2 3 4 5 6 7 8 9 10 11 12 13 14 15 16 17 18 19 20 21 22 23 24 25 26 27 28 29 30 31 32 33 34 35 36 37 38 39 40 41 42 43 44 45 46 47 48 49 50 51 52 53 54 55 56 57 58 59 60 61 62 63 64 65
5. Save uncertain points: non assembly points with the inner strategy and assembly points with the outer strategy (points outside the inner polygon and into the outer polygon).
6. Compute the relative confidence interval:
_ _ _ fa inner fa outer fa inner P P rCI P (17)
7. Compare rCI to a precision criterion, e.g. 5%. If rCI is greater than the criterion, then start the while loop with a greater number of linearizations Nd:
Nd1 = 2Nd0.
8. While loop using the uncertain points.
8.1. Compute Pfa_inner and save non assembly points among the uncertain points.
8.2. Compute Pfa_outer and update the list of uncertain points.
8.3. Compute rCI.
8.4. If rCI < 5%, then stop, else Ndk+1 = 2Ndk.
This algorithm is tested in the next section on an industrial application.
5. Estimation of the probability of assembly failure on an industrial mechanism
The study of the impact and the application of the proposed procedure is applied on a test case based on a RADIALL electrical connector, see Fig. 6. The mechanism is composed of two parts which must be assembled, they are positioned by 5 cotters and 2 pins which makes the mechanism highly hyperstatic. The behavior model is not detailed in this paper because of too many equations:
66 compatibility equations,
40 linear interface constraints,
4 quadratic interface constraints,
76 random variables,
72 gap variables.
All parameter values: dimensions, means, standard deviations and probability laws, are necessary for tolerance analysis. However, for confidentiality reasons, tolerances and values are changed from the real values for this study. Random variables are defined following a normal distribution. For this test case, only the assembly requirement is evaluated. The probability Pfa will only be computed.
A range of linearization number is defined and Monte Carlo simulations are performed on each case. The number of samples N is chosen in order to yield a coefficient of variation on the probability of failure (see Equation (10) lower than 5 %.
Fig. 6. Illustration of the Radiall connector.
Results, given in Table 1, show that the number of linearizations Nd and the strategy influence the probability of
failure values. Strategies provide different results which converge toward the same value, validating the linearization equations. Considering a target probability to be reached, the inner polygon strategy provides conservative results (only valid for the assembly case). In this case, even if the result is an approximation, the real probability value will not be underestimated because this strategy overestimates the probability. Furthermore, the combination of the inner and outer polygon strategies provides a confidence interval for the true failure probability value. The greater the number of linearizations, the smaller the confidence interval.
1 2 3 4 5 6 7 8 9 10 11 12 13 14 15 16 17 18 19 20 21 22 23 24 25 26 27 28 29 30 31 32 33 34 35 36 37 38 39 40 41 42 43 44 45 46 47 48 49 50 51 52 53 54 55 56 57
8
The computing time increases with the number of linearizations. In addition, it is not possible to know a priori for which linearization number value the probability of failure has converged. In order to not doing blinded simulations, it is very important to dispose of a procedure able to provide accurate result as fast as possible. The proposed procedure in Section 4 solves this problematic, indeed, the procedure is an adaptive algorithm which stops when the result is accurate enough whatever the required number of linearizations to yield a converged result.
Table 1. Probabilities of failure values for the assembly requirement obtained with the Monte Carlo simulation and the proposed procedure.
Nsamples 105 C.O.V. 2.7 % 95% C.I. (x10-2) 0.14 Nd 4 8 16 32 Pfa Inner (x10-2) 4.17 1.55 1.28 1.26 Pfa Outer (x10-2) 0.1 6.54 1.07 1.2
Computing time MC (hours) 4.7 4.8 4.9 5
Computing time procedure (hours) 2.7
rCI (%) 97 57 16 4.5
This algorithm is performed on the RADIALL test case and the results are shown in the bottom part of Table 1. Actually, probability values are equals to those obtained with the Monte Carlo simulation because the same set of samples of the random variables was used. The procedure stopped with a number of linearizations equal to 32. This procedure allows to be sure that such a number is sufficient to yield a result accurate enough which is not the case with a simple Monte Carlo simulation. In addition, the computing time to reach an accurate result is reduced (2.7h) compared to the time needed with the classical Monte Carlo simulation (a total of 19.4h). The proposed procedure computes all values in only one simulation whereas the Monte Carlo simulation only provides one result at a time.
6. Conclusion
The functionality of a product is influenced by design tolerances. Evaluating the quality level of a product at its design stage is therefore a key element, enabling an improvement of the functional quality of the product while reducing the manufacturing cost. This requires methods such as tolerance analysis to quantify the impact of tolerances on mechanism quality. To evaluate the quality level of the product, a mathematical model is required, which must represent its behavior as well as possible. However, the behavior model may be approximated. This approximation leads to provide inaccurate quality level which is required to be able to manage.
The paper proposed by Qureshi et al. [9] provides a tolerance analysis formulation able to deal with non-linear behaviors. Although the mathematical formulation enables this kind of problem to be solved, a difficulty appears when calling the optimization scheme with non-linear constraints, making the result unreliable. The present paper is dedicated to defining linearization strategies for the non-linear constraints in order to solve this problem. It appears that the linearization of non-linear constraints has a real impact on the probability of failure of the mechanism; the obtained result may underestimate the real value, hence over-estimating the quality level. The linearization procedure must be chosen carefully in order to obtain conservative results. Indeed, depending on the type of requirement (assembly or functional), the conservative strategy is different. In addition, an interesting procedure consists of defining a confidence interval of the true probability of failure using two linearization strategies: outer and inner polygon.
The classical solution method, the Monte Carlo simulation, is not able to provide results for which the chosen number of linearizations is sufficient to yield accurate probabilities of failure. An adaptive procedure is therefore proposed in order to obtain a confidence interval small enough of the probability. Hence, whatever the studied mechanism, it is possible to obtain a good accuracy of the result whatever the required number of linearizations.
Acknowledgements
The authors would like to acknowledge the support of ANR “AHTOLA”project (ANR-11- MONU-013).
1 2 3 4 5 6 7 8 9 10 11 12 13 14 15 16 17 18 19 20 21 22 23 24 25 26 27 28 29 30 31 32 33 34 35 36 37 38 39 40 41 42 43 44 45 46 47 48 49 50 51 52 53 54 55 56 57 58 59 60 61 62 63 64 65
References
[1] Nigam, S., Turner, J., 1995. Review of statistical approaches of tolerance analysis, Computer Aided Design 27, p. 6-15.
[2] Ballu, A., Plantec, J.-Y., Mathieu, L., 2009. Geometrical reliability of overconstrained mechanisms with gaps, CIRP Annals: Manufacturing Technology 57, p. 159–162.
[3] Dantan, J.-Y., Qureshi, J., 2009. Worse case and statistical tolerance analysis based on quantified constraint satisfaction problems and monte carlo simulation,Computer Aided Design 41 (1), p. 1–12.
[4] Bourdet, P., Clément, A., 1976. Controlling a complex surface with a 3 axis measuring machine, Annals of the CIRP 25, p. 359–364.
[5] Davidson, J., Shah, J., 2012. Modeling of geometric variations for line-profiles,Journal of Computing and Information Science in Engineering 12, p. 1–10.
[6] Davidson, J., Mujezinovic, A., Shah, J., 2002. A new mathematical model for geometric tolerances as applied to round faces, Journal of Mechanical Design124, p. 609–622.
[7] Zou, Z., Morse, E., 2003. Applications of the gapspace model for multidimensional mechanical assemblies, Journal of Computing and Information Science inEngineering 12, p. 22–30.
[8] Giordano, M., Duret, D., Clearance space and deviation space: Applicationto three-dimensional chain of dimensions and positions, 3rd CIRP DesignSeminar on Computer-Aided Tolerancing.
[9] Qureshi, J., Dantan, J.-Y., Sabri, V., Beaucaire, P., Gayton, N., 2012. A statistical tolerance analysis approach for over-constrained mechanism based on optimization and monte carlo simulation, Computer Aided Design 44, p.132–142.
1 2 3 4 5 6 7 8 9 10 11 12 13 14 15 16 17 18 19 20 21 22 23 24 25 26 27 28 29 30 31 32 33 34 35 36 37 38 39 40 41 42 43 44 45 46 47 48 49 50 51 52 53 54 55 56 57