DOI 10.1007/s00027-006-0841-6 © Eawag, Dübendorf, 2007
Aquatic Sciences
Research Article
Application of the weight-of-evidence approach to assess the
decline of brown trout (Salmo trutta) in Swiss rivers
Patricia Burkhardt-Holm1,*
and Karin Scheurer2 1
Man-Society-Environment (MGU), University of Basel, Vesalgasse 1, CH-4051 Basel, Switzerland
2
Eawag, Überlandstr. 133, P.O. Box 611, CH-8600 Dübendorf, Switzerland Received: 1 November 2005; revised manuscript accepted: 28 June 2006
Abstract. To assess potential causes for the decline in
catch of brown trout and their impaired health status in Switzerland, a 5-year multidisciplinary research project was conducted. Multiple causal hypotheses were postu-lated and investigated in a variety of laboratory and fi eld studies. We present here the application of a weight-of-evidence analysis to evaluate the results of these studies and to assess the causes for decline in brown trout abun-dance. Based on human health epidemiological criteria, the method considers the exposure situation, the correla-tion between causes and effects, specifi city of effects, and amelioration due to removal. For our evaluation, we concentrated on four test rivers and included data on fi sh health and population density, water quality, and habitat
parameters. Our results showed that proliferative kidney disease (PKD) caused by a parasite and clinical outbreak supported by other factors is a very probable single pa-rameter for the decline of brown trout abundance at the sites of the test rivers where it occurs. Elevated levels of nitrogen compounds may also be posing a serious risk at several sites, in particular those downstream of sewage treatment plants. Several habitat parameters, such as large width, low percentage of riffl es or elevated winter temperatures, were identifi ed as factors likely contribut-ing to impaired health, recruitment, and abundance at single sites. At most sites, more than one factor must be acting jointly to cause the observed decline in brown trout abundance.
*
Corresponding author phone: +41 61 267 04 02; fax: +41 61 267 04 09; e-mail: patricia.holm@unibas.ch Published Online First: March 2, 2007
Introduction
Brown trout (Salmo trutta) populations in Switzerland are seriously at risk. Angler catch records indicate a de-crease of up to 50 % since the beginning of the 1980s (Friedl, 1999). This catch decline has been observed to be geographically widely distributed and are most probably a sign for a decrease in population (Fischnetz, 2004). In parallel with the indications of decreasing catch, fi sh health studies have yielded evidence of an impaired
health status. Brown trout with both macroscopic lesions and histopathological alterations of liver, kidney and gills were documented in a number of rivers and streams (Ber-net et al., 2000; Schmidt-Posthaus et al., 2001).
The causes of the widespread health problems and decreased catch are not readily apparent, due to the vari-ety of human activities in the affected regions. To docu-ment the spatial and temporal patterns of catch decline and impaired fi sh health and to demonstrate a general population decline, identify the most important causal factors and suggest measures for improvement, the fi ve-year, nationwide project “Fischnetz” (Netzwerk Fisch-rückgang Schweiz: project on declining fi sh catch in Switzerland) was conducted (Burkhardt-Holm et al., 2002). As a part of a systematic and structured search for
possible causes, multiple causal hypotheses were postu-lated. These included poor water quality, altered habitat, increased fi ne sediment inputs, infectious diseases, in-creased water temperature, altered hydrological regime, as well as changed angler behaviour and fi sheries man-agement (Burkhardt-Holm et al., 2005).
A variety of fi eld and laboratory studies were conduc-ted to assess the importance of the various possible caus-al factors. With the recent completion of these studies (Fischnetz, 2004), methods are required to integrate the results in a manner useful for causal assessment and as a basis for further development of management options. Because of the historical nature of the fi sh catch decline problem, retrospective evaluations are also necessary.
Here we present the application of a weight-of-evi-dence approach (WOE) as a semi-quantitative method for identifying causal factors that are likely to explain ad-verse effects occurring in investigated ecosystems (Forbes and Calow, 2002; Goede and Barton, 1990; Suter et al., 2002). This method is useful because it makes the proc-ess of assproc-essment more transparent, systematic and logi-cal as well as facilitates the summarizing and communi-cation of results. Nevertheless, the approach can never be absolutely decisive, as it is post-hoc. Therefore, although it is unrealistic to expect this method to be defi nitive in terms of ascribing causation, it does allow defi ning fac-tors as being more or less likely and allows for informed management and regulatory decisions based on the pre-ponderance of evidence. The approach is based on hu-man health epidemiological criteria and includes the con-sideration of several basic questions and an assessment of the likelihood of the potential causal factors. The relevant questions deal with issues such as the exposure situation, the correlation between causes and effects, specifi city of effects and amelioration due to removal of agents.
The weight of evidence approach outlined above can also be referred to as retrospective ecological risk assess-ment (Forbes and Calow, 2002) or ecoepidemiology (Suter and Bartell, 1993; Adams, 2003). We adopted the model of Forbes and Calow (2002), modifi ed it to our specifi c conditions, and applied it to assess the infl uence of potential factors involved in the catch decline and im-paired health of Swiss brown trout.
A judgement and assessment of the likelihood of po-tential causal factors is facilitated by using studies in which selected river basins were investigated with respect to identical variables over the same time period and with identical methods. Such a study was performed over two years in four river basins (further on called “test areas”) with differing characteristics that represent the range of conditions found in the Swiss midlands. Here, we inves-tigated health parameters, reproduction, recruitment, ecomorphological characteristics, physico-chemical pa-rameters, water quality variables, and the hydrological regime. In each river, three reaches were selected and
in-vestigated in detail. As the fi nal endpoint of the weight-of-evidence analyses, we selected the brown trout abun-dance. Decline in catch was observed over the last two decades, but was not selected as an endpoint in this study because spatial resolution of this data is not suffi ciently detailed to differentiate between individual sites at the test areas.
Methods
Weight-of-evidence approach
The evidence available to assess the potential causes of ecological impairments is often complex and widely vari-able. Even well performed scientifi c studies can be am-biguous. Suffi cient quantitative data are usually not avail-able for all potential factors. Similarly, evidence for the involvement of putative factors may only be of a correla-tive nature. In addition, there are confounding factors which might be either unknown (e.g. unidentifi ed infec-tious agents) or uncontrollable (e.g. weather, fl ood events, predators). Therefore, rarely is one line of evidence suffi -cient to demonstrate causation. Rather, only by assembling and evaluating all of the evidence can some factors be ruled out and others maintained for further action or analy-sis. What follows is a series of key questions developed by Forbes and Calow (2002) with which to challenge the available evidence. For the present work, the key ques-tions of Forbes and Calow (2002) have been slightly mod-ifi ed to better refl ect the situation of fi sh declines in Swit-zerland. In particular, causative agents represent the range of potential factors addressed by the hypotheses of Fischnetz, in addition to the classical physical, chemical, and biological stressors. The method is case-specifi c, so most questions relate to a particular fi sh population while others relate to the transfer of knowledge gained from other locations or from the literature. We have also reor-dered the questions of Forbes and Calow to better refl ect their importance in ascribing causation. For example, we believe that the plausibility question should be applied fi rst, as a screening criterion to determine the causes that should be considered for further analysis. Additionally, unlike Forbes and Calow (2002), we think that most of the criteria can be applied sequentially, rather than simultane-ously as they do for fi ve of the seven questions. A decision diagram shows the order and conclusions resulting from the seven questions we apply (Fig. 1).
1) Does the proposed causal relationship make sense logically and scientifi cally?
This question seeks to document the plausibility of the causal relationship. The intent is to preclude con-sideration of relations that clearly have a spurious ba-sis. Documentation may include the description of a specifi c causal mechanism linking the stressor and the adverse effect, a comparison of the hypothesized
relationship to other well-established cases, and a re-view of relevant studies reported in the scientifi c lit-erature. The answer to this question will invariably require some scientifi c judgement.
2) Is there evidence that the fi sh population is, or has been, exposed to the causal factor?
This site-specifi c question encourages documentation of exposure levels of a population to a stressor. There may be situations where exposure is suspected but has not actually been demonstrated at the study site in question. For most potential causes, evidence of ex-posure will come from monitoring programs, site sur-veys, or historical data. The answer to this question should be as detailed and quantitative as possible. However, often not more than pure incidental obser-vations are available.
3) Is there evidence for association between adverse ef-fects in the population and presence of the causal fac-tor, either in time or space?
The objective of this question is to provide evidence that the candidate cause and the effect are generally observed together at the same time and/or place and that when the cause is not observed, neither is the ef-fect. In contrast to criterion 2, a biological gradient or
any kind of formal relation between adverse effect and the stressor is asked for. Ideally, the answer to this question will involve a statistical correlation or re-gression analysis and therefore may rely on data from a number of different sites. For some causal factors, suffi cient data may not be available, and only a sub-jective judgement of trends is possible. In this study a correlation was stated for the downstream sites if the causal factor changed in accordance to the adverse effect when compared to the reference site in the same river. Of course, even strong correlation does not prove a cause-effect relationship, especially in the presence of confounding variables. However, this is one important line of evidence.
4) Do the measured or predicted exposure levels exceed quality criteria or biologically meaningful thresh-olds?
It is assumed that most stressors have a threshold lev-el, below which adverse effects on a population are unlikely. Therefore, it is important to determine whether the site-specifi c values stated in answer to question 2 exceed critical values. For some stressors, such as chemical pollutants, environmental quality standards (EQS) and predicted no effect concentra-tions (PNEC) exist. We used the PNEC as a critical level and calculated risk quotients for fi sh according to the formula (Risk = effect concentration/PNEC fi sh) with a risk value above 1.0 still might be as-sumed to cause an adverse effect. However, for non-chemical factors, other indices (such as critical food benthos biomass in g/m2) are required. It is also
pos-sible that the population may be exhibiting adverse effects resulting from past exposures at critical levels that are no longer present. This possibility should be considered, and, if possible, historical data should also be evaluated.
5) Is there an effect in the population known to be spe-cifi cally caused by exposure to the stressor?
Some stressors are known to elicit very specifi c re-sponses in the target populations. Some diseases have very specifi c symptoms and were diagnosed in our study (Zimmerli et al., 2007). For example, vitello-genin is a yolk precursor protein specifi cally synthe-sized in male vertebrates after exposure to (xeno)estrogens. Most responses are often referred to as “biomarkers of exposure”. Because of the possibil-ity of non-identifi cation of biomarkers, their presence in a population has greater weight as causal evidence than their absence. It should also be noted that spe-cifi c responses are not only the result of chemical ex-posure or disease.
6) Have the results from controlled experiments in the fi eld or laboratory led to similar effects?
This question seeks to document situations in which the stressor has been applied in a controlled way in Figure 1. Flow diagram to decide on the 7 questions of the
weight-of-evidence analysis (see text) and the resulting assessments.
Plausibility (1)?
Exposure (2)? Yes No
No Yes(if no data, no conclusion is possible)
Correlation (3)? Yes (if no data, the
likely/very likely
conclusions that follow become possible) No unlikely unlikely unlikely Threshold (4)? No Yes or no data Specificity (5)?
very likely Yes No or no data Experiment (6)? Removal (7)? Yes, for both Yes, for one No, for both n.d.
very likely likely possible unlikely
the river basins are typical in that three of them exhibit a multitude of potential causal factors. In each basin, the brown trout population was studied at three sites. These sites were either separated by barriers or the distance be-tween the sites was great enough that migration was con-sidered to be of minor importance.
The Emme river has its headwater in a steep pre-alpine region considerably infl uenced by spring snow-melt and seasonal fl ow fl uctuation. Downstream, histori-cally high occurrence of fl oods prompted intense river management activities in the nineteenth and twentieth centuries. The construction of dams and weirs has re sulted in isolation of tributaries. Additionally, poor riparian con ditions and high water extractions strongly infl uence the hydrology in the two downstream sites. Natural trout habitats are mostly found in the upper reach. Land use in the Emme basin (963 km2) consists of 35 %
extensive agriculture (mostly downstream), 15 % inten-sive agriculture, 40 % forest, and 6 % developed land. Two large wastewater treatment plants (WWTPs ) dis-charge into the downstream Emme, while a number of smaller WWTPs discharge into the river’s tributaries. Catch of brown trout has declined by approximately 60 % since 1990.
The Liechtensteiner Binnenkanal (LBK) is a channel constructed in the 1930s for fl ood protection and land conversion. The fl ow is rather constant, and the only prominent barrier, at the mouth of the channel, was re-moved in 2000. Restrictions of natural habitat are mainly due to channelization leading to low variability in width and depth and a monotonous fl ow. This, together with input of fi nes from agriculture, settlements and roads has resulted in high levels of fi ne sediment and stream bed clogging. One WWTP treating about 4,500 person-equiv-alents discharges into the LBK. The LBK basin (138 km2)
is dominated by forest (50 %) with only 18 % agriculture. Catch levels of trout (rainbow trout and brown trout) have real fi eld situations or in appropriately designed
labo-ratory experiments. Because such studies are made under controlled conditions they will be given more weight than the correlative observations described in answer to question 3. Site-specifi c studies are most relevant, but experiments performed under similar conditions are also informative.
7) Has removal of the stressor led to an amelioration of effects in the population?
If possible factors are known or suspected, their in-tentional removal may provide an opportunity to help identifying an associated effect. Such situations may result from a controlled experimental program or the implementation of a management measure. It is im-portant to remember, however, that recovery of a pop-ulation is rarely immediate. Therefore, while amelio-ration following removal of a stressor provides useful evidence and confi dence for its previous importance, lack of amelioration does not disprove its importance. Careful judgement must be applied in considering negative results from such manipulations. However, general rules on the rates of recovery of different eco-logical target following removal of various factors do not exist.
Some of the questions (2, 3, 4) are answered by the re-sults of the site-specifi c studies, while others (1, 5, 6, 7) are mainly answered by data available from other investi-gations. Forbes and Calow (2002) suggest organizing the weight of evidence assessment as a table, with the pro-posed causal factors along one margin of the table and the seven questions along the other margin. Answers to each question for each factor are then given in the cells of the table. A decision diagram (Fig. 1) can then be used to apply the information in the table to an overall determi-nation of the relative likelihood of the various causes. In this way, the potential factors can be easily classifi ed as “very likely”, “likely”, “possible”, or “unlikely”. If data are not suffi cient to assess a parameter in question, it is held for further consideration as “possible”. In contrast, when judged as “unlikely” the factor is excluded from further assessment due to the lack of exposure, correla-tion, exceedance of the threshold or negative results of both types of experiments.
Case study locations
Four river basins, the Emme, Liechtensteiner Bin-nenkanal, Necker, and Venoge were chosen to represent the range of conditions in Switzerland and Liechtenstein (Fig. 2). Selection criteria for the river basins included evidence of a signifi cant brown trout catch decline over the preceding two decades and the discontinuation of stocking for the two years under study in order to be able to assess the natural recruitment potential. In addition,
Figure 2. Location of test rivers in Switzerland with size of their
declined by more than 90 % since the mid 1980s (and 85 % since the 1970s).
The Necker is a pre-alpine river with natural, season-ally fl uctuating fl ow. River morphology is only mildly disturbed, providing varied habitat for all life stages of brown trout. Primary land use in the basin (123 km2)
con-sists of 35 % agriculture and 38 % forest. A small amount of wastewater is discharged into the Necker (input of four small WWTP, with treated waste of fewer than 10,000 people), but input of fi nes and stream bed clogging may be a problem. Angler catch has decreased by more than half since the mid 1980s.
The Venoge is located in the west of the Swiss plateau and fl ows into Lake Geneva. Habitat quality seems ade-quate in the upper reach but poor in the lower section. The area of the basin is 231 km2 and land use includes
47 % agriculture and 34 % forest. Eighteen mostly small
(2: 10,000–50,000 people, others ⱕ 10,000 people)
WWTPs discharge to the Venoge or its tributaries. Catch of brown trout in the Venoge has decreased less than in the other studied rivers (approximately 25 % since the late 1980s). However, the largest decreases occurred be-fore data on brown trout catch was raised separately for this river.
Data for the case studies
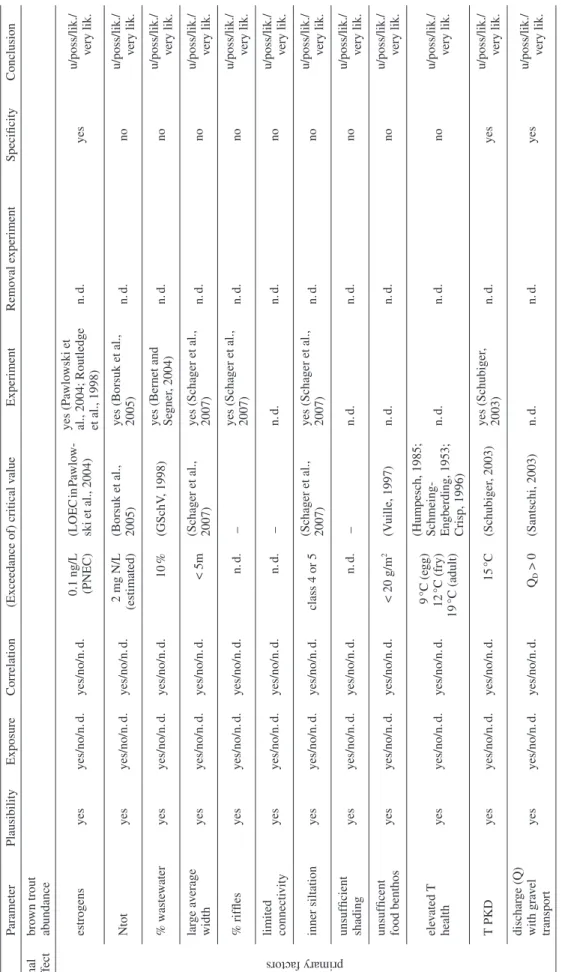
Twenty six parameters were selected as potential causes or intermediate indicators and used in weight-of-evidence tests. In the following sections, these parameters and their measurement methods are shortly described. More details can be found in the cited references (cf also Table 1).
Biological data. One basic question was, whether the
as-sumption of a decline in fi sh stocks in the four catchment areas can be made from the observed catch declines over the last two decades. Anglers in Switzerland have to record and submit the species, number, size, location and date of all fi sh caught and retained to the appropriate can-ton. However, since the number of unsuccessful trips and the duration of trips are not generally recorded, total ef-fort and catch per unit efef-fort cannot be calculated. Fur-thermore, stocking measures and fi sheries management differing from canton to canton infl uences fi sh stocks ad-ditionally in an unforeseeable way. Population data of quantitative measurements were too scarce and methodo-logically diffi cult to interpret for suffi ciently supporting the basic assumption of stock declines (Fischnetz, 2004). Although changes in fi shery management and angling behaviour (e.g. changed recreational activities) contrib-uted to the catch decline, data on trends in angler permits and catch data allow to conclude that a real reduction of fi sh stocks occurred: Between 1980 and 2000, the number of angling permits sold for rivers and streams decreased by 23 %. A representative survey of anglers fi shing in
riv-ers and streams showed that the number of angling trips per permit declined from an average of 27 (1980) to 22 (2000) (Fischnetz, 2004). Nevertheless, the ratio of suc-cessful angling trips declined from 78 % to 24 %, while the trip duration remained the same. Since successful trips and total annual catch per angler (reduction from 49 fi sh in 1980 to 25 fi sh in 2000) dropped much more than the number of permits and trips per permit, we concluded that there is a real reduction of the fi sh stock and that this decline forced the anglers to adapt their behaviour.
The biological surveys in this study included investi-gation of population abundance, recruitment, reproduc-tive impairment and health indicators.
Population abundance was measured and
re-calcu-lated as the total number of brown trout per hectare and was performed by quantitative electrofi shing, with two consecutive passes with lock nets at upper and lower ends (De Lury, 1947; Schager and Peter, 2004). Abundance data were classifi ed according to comparable data from reference streams in Swiss midlands and local conditions such as altitude, steepness and hydrological regime into the classes 1 = very good; 2 = good; 3 = suffi cient; 4 = insuffi cient; 5 = poor according to the modular stepwise procedure for comprehensive assessment of streams in Switzerland, step F, for fi sh (Schager and Peter, 2003; Schager and Peter, 2004).
Surveys over 100–200 m stretches were carried out at each site in spring (April/May), summer (Jul/Aug) and autumn (Oct/Nov/Dec) of 2002 and in summer (Jul/Aug) and autumn (Oct/Nov) of 2003. Due to the very low abundance in the river Emme, sites D1 and D2 were fi shed only at specifi c structures (Schager and Peter, 2004). Destructive biomarkers were measured only dur-ing the summer sampldur-ing dates, when 20 juvenile brown trout were collected at each site by electrofi shing and sacrifi ced. A sample of 20 fi sh was not possible at Emme D1 (n = 19) and D2 (n = 6) in 2002, at Emme D1 (n = 14), Necker HW (n = 14), D2 (n = 16) and LBK HW (n = 19), D1 (n = 13), D2 (n = 15) in 2003 and no fi sh were caught for sampling at Emme D2 in 2003, LBK D2 in 2002 and Venoge HW in 2003.
As an indicator of recruitment, late summer fry or “young-of-the-year” abundance (age 0+) was analyzed
separately from the other life stages and is compared with the relationship age 0/>1. The classifi cation was done ac-cording to the modular stepwise procedure for compre-hensive assessment of streams in Switzerland, step F, for fi sh (Schager and Peter, 2004; Schager et al., 2007) and data were ranked in a 5-step classifi cation scheme, with “5” the poorest, and therefore, insuffi cient recruitment success (personal communication, E. Schager, Eawag). Density at this life stage can be related to egg and young-of-the-year survival as well as habitat limitations (Elliott, 1994) although these relations can be complicated by density dependence (Borsuk et al., 2005).
T
able 1.
All primary and intermediate parameters used for the weight-of-e
vidence approach and the possible answers on the se
v
en questio
ns. Some of the questions (e
xposure, correlation, threshold)
are answered by the results of the site-specifi
c studies, while others (plausability
, specifi
city
, e
xperiment, remo
v
al) are mainly answered by data a
v
ailable from other in
v estigations. P arameter Plausibility Exposure Correlation
(Exceedance of) critical v
alue Experiment Remo v al e xperiment Specifi city Conclusion fi nal ef fect bro wn trout ab undance intermediate factors recruit ment yes yes/no/n. d. yes/no/n. d. class 5 (Schager , persn. commun.) yes (f. re vie w: Elliott, 1994; Crisp, 2000) yes (dito) no u/poss/lik./ ve ry lik. ELS-survi v al rates yes yes/no/n. d. yes/no/n. d. < 80 %
(Bernet and Segner
, 2004)
yes (Bernet and Se
gner , 2004; Ko bler , 2004) n. d. no u/poss/lik./ ve ry lik. VTG-induced yes yes/no/n. d. yes/no/n. d. 1000 ng/L (V ethaak et al., 2002) yes (1) (P awlo wski et al., 2004) n. d. no u/poss/lik./ ve ry lik. condition factor yes yes/no/n. d. yes/no/n. d. 0.8 < Median < 1.2
(Bernet and Segner
, 2004) n. d. n. d. no u/poss/lik./ ve ry lik. HSI-ele v ated yes yes/no/n. d. yes/no/n. d. sign. abo v e reference (Zimmerli et al., 2007) yes (Bernet and Se
gner , 2004) n. d. no u/poss/lik./ ve ry lik. hist. li v er inde x yes yes/no/n. d. yes/no/n. d. > 10
(Bernet and Segner
, 2004) yes (Fischnetz, 2004) n. d. no u/poss/lik./ ve ry lik. ER OD yes yes/no/n. d. yes/no/n. d. 50 pmol/mg/ min (Zimmerli et al., 2007) yes (f. re vie w: Whyte et al., 2000) n. d. no u/poss/lik./ ve ry lik. PKD yes yes/no/n. d. yes/no/n. d. positi v e (Clifton-Hadle y et al., 1987) yes (Schubiger , 2003) n. d. yes u/poss/lik./ ve ry lik. primary factors NH 4 -N yes yes/no/n. d. yes/no/n. d. 0.2 mg N/L (GSchV , 1998)
yes (Burton and Pitt, 2002)
n. d. no u/poss/lik./ ve ry lik. NO 2 -N yes yes/no/n. d. yes/no/n. d. 0.0015 mg N/L (PNEC) (LOEC in Russo, 1985) yes (Russo, 1985) yes
(Rodriguez- Moreno and Tarazona, 1994)
no u/poss/lik./ ve ry lik. Atrazin yes yes/no/n. d. yes/no/n. d. 20,000 ng/L (PNEC) (Götz et al., 2003) yes (2) n. d. no u/poss/lik./ ve ry lik. Diazinon yes yes/no/n. d. yes/no/n. d. 900 ng/L (PNEC) (Götz et al., 2003) yes (3) no (Bre wer et al., 2001) no u/poss/lik./ ve ry lik. NH 4 -N yes yes/no/n. d. yes/no/n. d. 3340 ng/L (PNEC) (Götz et al., 2003) yes (3) n. d. no u/poss/lik./ ve ry lik. Te b utam yes yes/no/n. d. yes/no/n. d. 187 ng/L (PNEC) (Götz et al., 2003) yes (3) n. d. no u/poss/lik./ ve ry lik. PBDE yes yes/no/n. d. yes/no/n. d. n. d. – n. d. n. d. no u/poss/lik./ ve ry lik.
T able 1. Continued P arameter Plausibility Exposure Correlation
(Exceedance of) critical v
alue Experiment Remo v al e xperiment Specifi city Conclusion fi nal ef fect bro wn trout ab undance primary factors estrogens yes yes/no/n. d. yes/no/n. d. 0.1 ng/L (PNEC) (LOEC in P awlo w-ski et al., 2004) yes (P awlo wski et
al., 2004; Routledge et al., 1998)
n. d. yes u/poss/lik./ v ery lik. Ntot yes yes/no/n. d. yes/no/n. d. 2 mg N/L (estimated) (Borsuk et al., 2005) yes (Borsuk et al., 2005)
n. d. no u/poss/lik./ v ery lik. % w aste w ater yes yes/no/n. d. yes/no/n. d. 10 % (GSchV , 1998)
yes (Bernet and Se
gner , 2004) n. d. no u/poss/lik./ v ery lik. lar ge a v erage width yes yes/no/n. d. yes/no/n. d. < 5m (Schager et al., 2007) yes (Schager et al., 2007)
n. d. no u/poss/lik./ v ery lik. % riffl es yes yes/no/n. d. yes/no/n. d. n. d. –
yes (Schager et al., 2007)
n. d. no u/poss/lik./ v ery lik. limited connecti vity yes yes/no/n. d. yes/no/n. d. n. d. – n. d. n. d. no u/poss/lik./ v ery lik. inner siltation yes yes/no/n. d. yes/no/n. d. class 4 or 5 (Schager et al., 2007) yes (Schager et al., 2007)
n. d. no u/poss/lik./ v ery lik. unsuffi cient shading yes yes/no/n. d. yes/no/n. d. n. d. – n. d. n. d. no u/poss/lik./ v ery lik. unsuffi cent food benthos yes yes/no/n. d. yes/no/n. d. < 20 g/m 2 (V uille, 1997) n. d. n. d. no u/poss/lik./ v ery lik. ele v ated T health yes yes/no/n. d. yes/no/n. d. 9 °C (e gg) 12 °C (fry) 19 °C (adult)
(Humpesch, 1985; Schmeing- Engberding, 1953; Crisp, 1996)
n. d. n. d. no u/poss/lik./ v ery lik. T PKD yes yes/no/n. d. yes/no/n. d. 15 °C (Schubiger , 2003) yes (Schubiger , 2003) n. d. yes u/poss/lik./ v ery lik. dischar ge (Q) with gra v el transport yes yes/no/n. d. yes/no/n. d. QD > 0 (Santschi, 2003) n. d. n. d. yes u/poss/lik./ v ery lik. n.
d.= not determined; u.= unlik
ely; poss. = possible; lik. = lik
ely; v
ery lik. = v
ery lik
ely
(1) only coincidence, no causal relationsships were up to no
w described. (2) http://www .epa.go v/ppsrrd1/rere gistration/atrazine; Aquire: www .epa.go v/ecotox/; agritox: www .inra.fr/agritox/; T omelin, 19 97; UB A, 1998. (3) A Q UIRE: www .epa.go v/ecotox/; A GRIT O X: www .inra.fr/agritox/; Umweltb undesamt., 1998. Anhörung zu Zielv or gaben für Pfl anzenschutzmittel wirkstof
fe. Intern Bericht.
T
omelin,
1997.
The Pesticide Manual. British Crop Protection Council, F
Reproductive impairment was assessed by two
pa-rameters: vitellogenin induction and experimental early life stage (ELS) tests of eggs and embryos. Plasma
vitel-logenin (VTG) was analyzed by means of a competitive
brown trout VTG enzyme linked immunosorbent assay (bt-VTG ELISA) according to Körner and coauthors (2007). VTG is considered to be elevated when it is above 1,000 ng/mL in males or juveniles (Vethaak et al., 2002).
Early life stage (ELS) tests were designed as egg
incu-bation experiments with brown trout eggs incubated ei-ther in Vibert-boxes (in Necker in winter 2002/03) or on-gravel exposed plates (in Venoge and Emme in winter 2001/02; (Kobler, 2004; Schager and Peter, 2004; Roos, personal communication). Survival rates were measured as both the percentage of eggs reaching the eying stage and those which hatch. An adverse effect is considered to be an egg or embryo mortality exceeding 20 % (Bernet and Segner, 2004).
As individual health indicators, we measured the condition factor, the hepatosomatic index, the histological liver index, 7-ethoxyresorufi n-O-deethylase (EROD) ac-tivity and proliferative kidney disease (PKD) infection.
The condition factor is calculated from length and weight data as CF = (weight × 100)/length3. Decline in
condition factor has been observed in fi sh subjected to stress from a variety of adverse environmental condi-tions, including low food abundance (for review: Goede and Barton, 1990). A CF below 0.8 and above 1.2 indi-cates a deviation from the normal status (Bernet and Segner, 2004).
The hepatosomatic index, refl ecting energy storage capacity, is calculated as HSI = 100 × liver weight/(body weight – liver weight). Data were measured and the index was calculated by Zimmerli and co-authors (Zimmerli et al., 2007). As a threshold, a signifi cant elevation or de-crease compared to the reference value of the given river was used.
For the histological liver index, female and male indi-viduals from each site and season were investigated (Zim-merli et al., 2007) and the pathological changes were clas-sifi ed according to Bernet and coauthors (Bernet et al., 1999). A score of 10 was selected as the threshold above which alterations were deemed to have adverse effects.
The activity of one key detoxifying enzyme, the
7-ethoxyresorufi n-O-deethylase (EROD) activity was
measured in the liver to indicate exposure to dioxin-like xenobiotics, including dioxins and furanes, polychlorin-ated biphenyls (PCB’s) as well as polycyclic aromatic hydrocarbons (PAH’s) (Whyte et al., 2000). According to the available literature for brown trout under non-exposed (control) conditions activity, values below 50 pmol/mg/ min were reported (Whyte et al., 2000; Behrens and Seg-ner, 2005), though 50 pmol/mg/min was taken as the threshold indicating induction of EROD expression (Zim-merli et al., 2007).
Proliferative kidney disease (PKD) is the most
com-mon infection disease affecting feral brown trout in Swit-zerland and leads to substantial mortalities (Wahli et al., 2002). It is caused by a myxozoan parasite
Tetracapsu-loides bryosalmonae. A cumulative mortality associated
with a clinical outbreak of PKD of more than 95 % was reached in brown trout after the water temperature re-mained at least two weeks over 15 °C (Schubiger, 2003). Young-of-year fi sh are especially vulnerable to PKD be-cause they are exposed to the parasite for the fi rst time (Wahli et al., 2002). A diagnosis of PKD infection was based on macroscopical, histological and immunhisto-chemical evaluations of the kidney (Zimmerli et al., 2007).
Physico-chemical data. During 2002, chemical analyses
of river water samples were measured monthly in can-tonal laboratories (Environmental Protection Offi ce Can-ton St. Gallen; Environmental Protection Offi ce Liech-tenstein; Water and Soil Protection Laboratory of the Canton Bern; Water and Soil Protection Laboratory of the Canton Waadt). The parameters analysed included: dissolved organic carbon, nitrate, nitrite, ammonium, chloride, orthophosphate and total phosphorus. The wa-ter temperature was measured by means of data loggers at each site once or twice per hour during the entire year (data provided by E. Schager, Eawag).
The toxicity and proportion of ammonium/ammonia (NH4-N/NH3-N) is primarily dependent on the pH level.
The recommended pH-dependent water quality criteria for ammonium (average concentration 30 days) at a pH of 9 is 0.25 mg NH4-N/L (Burton and Pitt, 2002). The
quality aims for NH4-N in running waters according to
the Swiss water pollution decree lies even below this value (0.2 mg N/L; (GSchV, 1998) and was used as a threshold.
Environmental nitrite concentrations of 0.015 mg/L NO2-N increase methemoglobin levels in rainbow trout
blood (Russo, 1985). The PNEC of 0.0015 mg NO2-N/L
was defi ned, considering a security factor of 10. Toxicity of NO2-N can be reduced by chloride, depending on its
concentration (Russo, 1985). Accordingly a doubling of the Cl-concentration increased the LC50 (4d)-level by a
factor of 2. Although it was reported that the Cl-concen-tration only delays NO2-N toxicity (Bartlett and
Neu-mann, 1998), the thresholds were adjusted for each site according to the 80 % of the measured Cl-concentrations (0–5 mg Cl/L or n. d. – 0.0015 mg NO2-N -N/L, 5–10 mg
Cl/L –0.003 mg NO2-N -N/L, 10–15 mg Cl/L – 0.0045 mg
NO2-N -N/L, 15–20 mg Cl/L – 0.006 mg NO2-N -N/L).
The pesticides atrazine, desethylatrazine, diazinon, diuron, dimethenamide, isoproturon, metolachlor, teb-utam, dicamba, (4-chloro-2-methylphenoxy)acetic acid (MCPA), mecoprop and sulcotrion were measured at D2 of each river from one to six times monthly during the
connectivity, riverbed siltation, and shade. Width, % rif-fl es and riverbed siltation are reported to inrif-fl uence re-cruitment (Schager and Peter, 2007). Siltation was scored using the 5-level method of Schälchli et al. (2002) where levels 4 and 5 are assumed to have a signifi cant impact (Schager and Peter, 2007; Schlager, personal communi-cation). Other habitat parameters were measured on a continuous scale, as described by Schager and Peter (2004).
Data on the availability of benthic prey resources in the study areas were obtained by literature review (Scheu-rer, 2004). Whereas some studies dealt with macrozoob-enthos as indicators for water quality, only sources where quantitative macrozoobenthos data were raised were tak-en into account [Emme: (Vuille, 1997); LBK: n. d.; Neck-er: (Frutiger, 1979; Imhof, 1994); Venoge: n. d.]. Vuille (1997) suggested that a prey density below 20 g/m2 is
critical. Besides benthic food availability, external inputs also play an important role in some seasons, and the per-centage shade was used as an indicator for this type food availability (Schager and Peter, 2004 ). Macroinverte-brate biomass and fi sh biomass are lowest in heavily shaded areas and in open channels without riparian veg-etation, but highest in ecotones with intermediate com-plexity (Zalewski et al., 1998).
The resident brown trout is a cold-water salmonid and many studies were published on temperature preferences of the different life-stages which also depend from the investigated population and acclimation (compiled in Crisp, 1996). Roughly, the preferred temperature range is between 4 °C and 19 °C for adults. Eggs are very tem-perature sensitive, and the optimal temtem-perature for their development is around 5 °C, with increased mortality be-low 1 °Cand above 9 °C (Humpesch, 1985). As a conse-quence, a threshold of 9 °C was selected for egg develop-ment and 19 °C for adverse effects on adults. Besides direct effects, indirect effects on food organisms or on the health status are of concern. A clinical outbreak of the proliferative kidney disease (PKD) occurs when am-bient water temperature surpasses 15 °C for more than 2 weeks and can cause mortalities of more than 95 % (Schubiger, 2003). Consequently, temperature data were checked for the number of weeks in which water tem-perature surpasses the threshold of 15 °C.
The hydrologic regime can have an important infl u-ence on egg incubation and fry survival and, therefore, on recruitment. High fl ows during the winter intra-gravel period can cause egg pocket washout. For a par-ticular streambed, the fl ow magnitude at which egg washout occurs can be estimated using river width, bed slope and gravel size (Santschi, 2003). The frequency of exceedances of this discharge then provides a rele-vant measure of impact. We used the results of Santschi (2003) for the corresponding case study sites as inputs for our analysis.
fi ve months in and after the main application seasons of spring and summer (Götz et al., 2003). Only data for pes-ticides with a risk quotient > 1 are given in Table 2. We considered the PNEC and risk quotients calculated by Götz et al. (Götz et al., 2003, based on AQUIRE: www. epa.gov/ecotox/; AGRITOX: www.inra.fr/agritox/).
Flame retardants PBDE were measured in the liver and bile of brown trout, captured between April and May 2002 at the sampling sites in the test areas (n= 3-21 fi sh). The given values (Table 2) represent the average concen-tration of all samples per site (Hartmann et al., 2006). At present, no toxicity or effect levels are known for PBDE.
Estrogen levels were calculated as estradiol equiva-lents from the number of inhabitants and their theoretical intake, degradation in WWTP and discharge (Strehler and Scheurer, 2003). It includes the known co-occurrence and concentration additivity of E1, E2, and EE2 and their reported relations of 10:1:0.5 (Johnson et al., 2000). The lowest effect level (LOEC) for fi sh found in the literature is 1 ng ethinylestradiol/L and a NOEC of 0.1 ng/L is re-ported (Pawlowski et al., 2004). Accordingly, the PNEC is 0.01 ng/L, considering a security factor of 10. Howev-er, 17-beta estradiol is at least 10x less potent than ethi-nylestradiol in inducing VTG (Thorpe et al., 2003), re-sulting in a PNEC of 0.1 ng/L and a hazard might exist above this threshold. Nonylphenol (NP) and nonylpheno-lethoxylates (NP1EO, NP2EO) were also calculated but did not contribute noteworthy (M. J.-F. Suter, Eawag, written communication).
As an integrated measure of point source pollution, the percentage of river fl ow comprised of wastewater was calculated from the number of inhabitants served by the discharging treatment plants and the low fl ow value of the river, according to Körner et al. (2005):
Percent effl uent = QT/(QT+Q347), where QT is the
aver-age dry weather treatment plant discharge and Q347 is the river discharge which is equalled or exceeded for 347 days of the year. Wastewater percentages greater than 10 % were considered to be critical (GSchV, 1998). As a measure of combined point and non-point source pollu-tion, we used the results of Zobrist and Reichert (2006), who found that mean annual concentrations of total nitro-gen, nitrate, phosphate, chloride, and potassium could be predicted from basin land use and population size. We used their results to calculate the predicted mean annual total nitrogen concentration at each survey site. This is the same method that was used by Borsuk et al. (2005) whose results indicate that 2.0 mg N/L can be used as an approximate threshold for ELS effects.
Habitat data. Habitat and streambed quality were scored
according to data raised by several investigators (Schager and Peter, 2003; 2004; Scheurer, 2004). Among the pa-rameters considered were: width, % riffl es, longitudinal
T
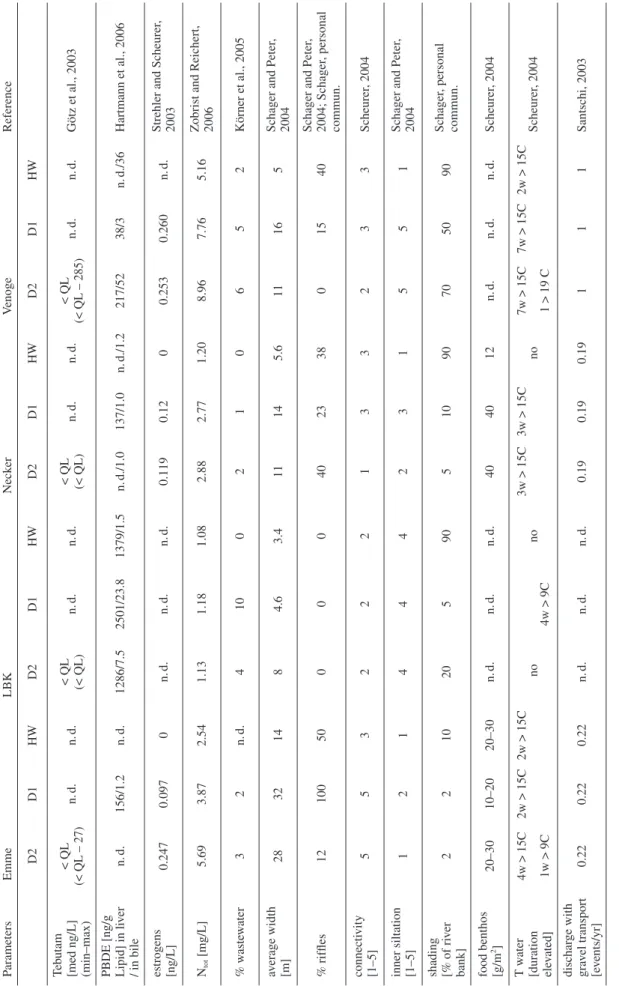
able 2.
Data of potential f
actors considered for the weight-of-e
vidence approach. See te
xt for further e xplanations. HW : headw ater , D1: do
wnstream site 1 (middle stream reach), D2: do
wnstream site 2 (further do
wnstream of D1). P arameters Emme LBK Neck er V enoge Reference D2 D1 HW D2 D1 HW D2 D1 HW D2 D1 HW bro wn trout ab undance [1–5] 55 3 5 5 1 4.6 3 3 n. d. n. d. 2.3
Schager and Peter
, 2004 Mean of 2–5 samplings recruitment [1–5] 54 55 5 2.5 4.5 3.25 4.7 n. d. n. d. 5
Schager and Peter
, 2004 Mean of 2–5 samplings ELS -survi v al rate [%] 13 70 n. d. n. d. n. d. n. d. 0 0 92 0 9 84
Schager and Peter
, 2004 VTG induced no no no no no no no no no no no no Körner et al., 2007 condition f actor abo v e/belo w threshold no no no no no abo v e no no no no no no Körner et al., 2007 HSI ele v ated yes no no no no no no no no yes yes no Zimmerli et al., 2007 histological liv er inde x 18 16 13 21 20 13 16 18 14 16 15 18 Zimmerli et al., 2007 ER OD abo v e threshold no no no yes yes no no no no yes no no Zimmerli et al., 2007 PKD abo v e threshold yes yes no no no no no no no yes yes no Zimmerli et al., 2007 NH 4 -N [mg/L ] 0.31 0.09 0.01 0.02 0.45 0.08 0.03 0.03 <0.01 0.16 0.09 0.02 1 NO 2 -N [mg/L ] 0.033 0.022 0.001 0.007 0.020 <0.001 0.007 0.008 0.001 0.046 0.036 0.011 1 Cl [mg/L] n. d. n. d. n. d. 3.2 10.8 2.9 3.8 3.6 1.3 20.8 17.7 8.1 1 Atrazine [med ng/L ] (min–max) 13 (7–728) n. d. n. d. 2 (< QL – 11) n. d. n. d. 5 (< QL – 11) n. d. n. d. 80 (23–764) n. d. n. d. Götz et al., 2003 Diazinon [med ng/L ] (min–max) 4 (< QL – 26) n. d. n. d. < QL (< QL – 27) n. d. n. d. < QL (< QL – 5) n. d. n. d. 8 (1–16) n. d. n. d. Götz et al., 2003 Diuron [med ng/L ] (min–max) < QL (< QL – 113) n. d. n. d. < QL (< QL – 19) n. d. n. d. < QL (< QL – 5) n. d. n. d. 11 (4–103) n. d. n. d. Götz et al., 2003
P arameters Emme LBK Neck er V enoge Reference D2 D1 HW D2 D1 HW D2 D1 HW D2 D1 HW Te b utam [med ng/L] (min–max) < QL (< QL – 27) n. d. n. d. < QL (< QL) n. d. n. d. < QL (< QL) n. d. n. d. < QL (< QL – 285) n. d. n. d. Götz et al., 2003 PBDE [ng/g Lipid] in li v er / in bile n. d. 156/1.2 n. d. 1286/7.5 2501/23.8 1379/1.5 n. d./1.0 137/1.0 n. d./1.2 217/52 38/3 n. d./36 Hartmann et al., 2006 estrogens [ng/L] 0.247 0.097 0 n. d. n. d. n. d. 0.119 0.12 0 0.253 0.260 n. d.
Strehler and Scheurer
, 2003 Ntot [mg/L] 5.69 3.87 2.54 1.13 1.18 1.08 2.88 2.77 1.20 8.96 7.76 5.16
Zobrist and Reichert, 2006
% w aste w ater 3 2 n. d. 4 1 0 0 2 1 0 6 5 2 Körner et al., 2005 av erage width [m] 28 32 14 8 4.6 3.4 11 14 5.6 11 16 5
Schager and Peter
, 2004 % riffl es 12 100 50 0 0 0 4 0 2 3 3 8 0 15 40
Schager and Peter
, 2004; Schager , personal commun. connecti vity [1–5] 55 32 22 13 32 33 Scheurer , 2004 inner siltation [1–5] 12 1 4 4 4 2 3 155 1
Schager and Peter
, 2004 shading [% of ri v er bank] 22 1 0 20 5 9 0 5 10 90 70 50 90 Schager , personal commun. food benthos [g/m 2] 20–30 10–20 20–30 n. d. n. d. n. d. 40 40 12 n. d. n. d. n. d. Scheurer , 2004 T w ater [duration ele v ated] 4w > 15C 1w > 9C 2w > 15C 2w > 15C no 4w > 9C no 3w > 15C 3w > 15C no 7w > 15C 1 > 19 C 7w > 15C 2w > 15C Scheurer , 2004 dischar ge with gra v el transport [e v ents/yr] 0.22 0.22 0.22 n. d. n. d. n. d. 0.19 0.19 0.19 1 1 1 Santschi, 2003 1 V
alues are presented as 80
th percentile of monthly measured samples in 2002. Data kindly pro
vided by cantonal authorities
VD, BE and SG and of the Principa
lity of Liechtenstein.
T
able 2.
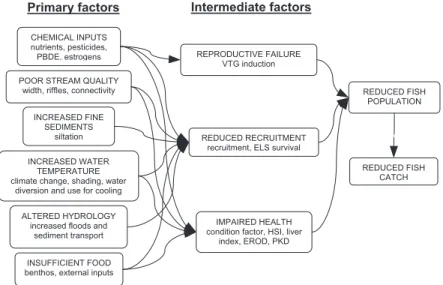
Primary vs. intermediate factors
Of the twenty causal factors we investigated, some can be considered to be primary causes because they are closely linked to anthropogenic impacts, while others should be treated as intermediate in nature because they cannot be controlled directly but are actually the effects of the pri-mary causes (Fig. 3). For the latter factors, which are gen-erally related to health and reproduction, data were raised in different forms; we transformed them to the qualitative levels of “good”, “medium” or “poor”. In particular, re-cruitment data were raised and classifi ed in 5 classes (Schager and Peter, 2004; Schager et al., 2007); these classes were transformed to “good” (class 1 and 2), “me-dium” (Class 3) and “poor” (class 4 and 5); for the ELS, the raised percentage values were classifi ed in 5 classes (Bernet and Segner, 2004) and we adapted them again to the 3-step classifi cation as outlined for recruitment data. For the histological liver index, a value above a score of 10 was assessed as slightly impaired (“medium”) and above 20 as impaired (“poor”), as suggested by Bernet and Segner (2004). This corresponds to the importance of this parameter proposed by Zimmerli et al. (2007). In the case of VTG induction, the situation was assessed as poor (i.e. indicating a previous exposure to (xeno)estrogens) when the mean of the group sampled at a specifi c site was signifi cantly elevated (Körner et al., 2007). Additionally, conditions above the threshold for EROD (50 pmol/mg/ min) were assessed as “poor” (Zimmerli et al., 2007).
To apply the weight-of-evidence procedure, we linked the primary causes to the adverse, intermediate effect. Often it was necessary to decide which of the possible relations between primary factor and intermediate factor is the most obvious and relevant, since some causes may infl uence more than one intermediate factor and several primary factors may infl uence the same intermediate fac-tor. For example, some chemical factors are known (or
suspected) to affect health (Götz et al., 2003; Bernet and Segner, 2004; Zimmerli et al., 2007). More specifi cally, NO2-N was shown to affect liver structure (Michael et al.,
1987). Accordingly, NO2-N was related to the
histologi-cal liver index. However, effects of NO2-N on several
en-zymatic activities of blood and various tissues also have been demonstrated (Das et al., 2004), which would have justifi ed a link between NO2-N and general condition as
well. Nevertheless, we decided to link NO2-N to the liver
histology since this effect is more specifi c than general condition. Exact links used in the analysis are shown in Table 3.
Results
In the following, the seven questions to which the weight-of-evidence analysis was applied were answered based on the data available.
Plausibility question (1)
Experts in fi sheries, environmental chemistry, fi sh biolo-gy and patholobiolo-gy determined the causative factors to be plausible and worth investigating during the fi rst stage of the Fischnetz project (Burkhardt-Holm et al., 2002; Burkhardt-Holm, 2006). Therefore, in terms of WOE, they passed the plausibility test. In the process of provid-ing the literature basis for all the various research projects, the theoretical plausibility of the investigated factors was further confi rmed.
Site specifi c questions (2–4)
Site specifi c values of all considered primary and inter-mediate causes are shown in Table 2. Starting with the
CHEMICAL INPUTS nutrients, pesticides, PBDE, estrogens POOR STREAM QUALITY
width, riffles, connectivity
IMPAIRED HEALTH condition factor, HSI, liver
index, EROD, PKD INSUFFICIENT FOOD
benthos, external inputs ALTERED HYDROLOGY
increased floods and sediment transport INCREASED WATER
TEMPERATURE climate change, shading, water
diversion and use for cooling INCREASED FINE SEDIMENTS siltation REPRODUCTIVE FAILURE VTG induction REDUCED RECRUITMENT recruitment, ELS survival
REDUCED FISH POPULATION
REDUCED FISH CATCH
Primary factors Intermediate factors
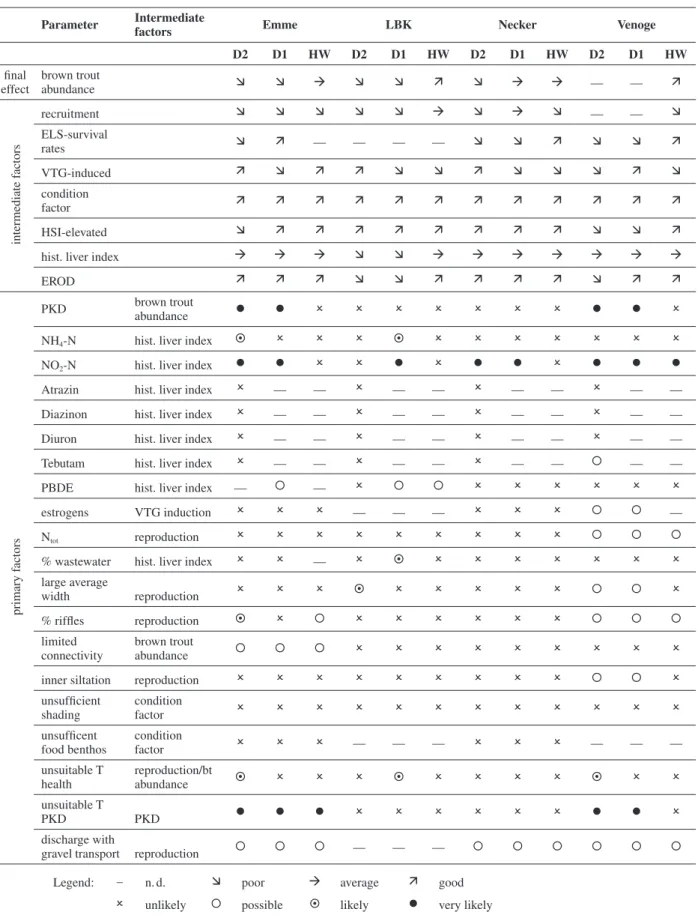
Table 3. Results of the weight-of-evidence assessments. Column 2 presents parameters investigated affecting either the brown trout
abun-dance as such (intermediate factors) or, in the lower part, primary factors which affect intermediate factors. Example: insuffi cient recruitment results in low trout abundance. Nitrite results in an increased histological liver index which indicates a bad health status and might indirectly lead to low trout abundance. Note: intermediate factors were not considered for the WOE but assessed according to their general trend at this site of the river. HW: Headwater, D1: downstream site 1 (middle stream reach), D2: downstream site 2 (further downstream of D1).
Parameter Intermediate
factors Emme LBK Necker Venoge
D2 D1 HW D2 D1 HW D2 D1 HW D2 D1 HW fi nal effect brown trout abundance Ê Ê ‡ Ê Ê ‰ Ê ‡ ‡ — — ‰ intermediate f actors recruitment Ê Ê Ê Ê Ê ‡ Ê ‡ Ê — — Ê ELS-survival rates Ê ‰ — — — — Ê Ê ‰ Ê Ê ‰ VTG-induced ‰ Ê ‰ ‰ Ê Ê ‰ Ê Ê Ê ‰ Ê condition factor ‰ ‰ ‰ ‰ ‰ ‰ ‰ ‰ ‰ ‰ ‰ ‰ HSI-elevated Ê ‰ ‰ ‰ ‰ ‰ ‰ ‰ ‰ Ê Ê ‰
hist. liver index ‡ ‡ ‡ Ê Ê ‡ ‡ ‡ ‡ ‡ ‡ ‡
EROD ‰ ‰ ‰ Ê Ê ‰ ‰ ‰ ‰ Ê ‰ ‰
primary f
actors
PKD brown trout
abundance l l O O O O O O O l l O
NH4-N hist. liver index § O O O § O O O O O O O
NO2-N hist. liver index l l O O l O l l O l l l
Atrazin hist. liver index O — — O — — O — — O — —
Diazinon hist. liver index O — — O — — O — — O — —
Diuron hist. liver index O — — O — — O — — O — —
Tebutam hist. liver index O — — O — — O — — ° — —
PBDE hist. liver index — ° — O ° ° O O O O O O
estrogens VTG induction O O O — — — O O O ° ° —
Ntot reproduction O O O O O O O O O ° ° °
% wastewater hist. liver index O O — O § O O O O O O O
large average width reproduction O O O § O O O O O ° ° O % riffl es reproduction § O ° O O O O O O ° ° ° limited connectivity brown trout abundance ° ° ° O O O O O O O O O
inner siltation reproduction O O O O O O O O O ° ° O
unsuffi cient shading condition factor O O O O O O O O O O O O unsuffi cent food benthos condition factor O O O –– –– — O O O — — — unsuitable T health reproduction/bt abundance § O O O § O O O O § O O unsuitable T PKD PKD l l l O O O O O O l l O discharge with
gravel transport reproduction ° ° ° — — — ° ° ° ° ° °
Legend: – n. d. Ê poor ‡ average ‰ good
intermediate causes, it can be seen from the table that the downstream populations are generally subject to low re-productive success, as indicated by critically low ELS survival. However, VTG was only elevated in 10 out of 197 males analysed and the average was not elevated at any of the sites (Körner et al., 2007).
Recruitment, as determined by the abundance of late summer young-of-the-year, was found to be impaired in all rivers and at all sites. However, a downstream gradient was only observed at the LBK. Brown trout abundance was very good to moderate at the headwater site and de-teriorated downstream in all rivers.
Condition factor was never below the threshold value of 0.9, and therefore provides no positive causal evidence. Downstream sites at the Emme and Venoge showed ele-vated HSI, and the two downstream sites at LBK and D2 at the Venoge showed elevated values for EROD. The lat-ter sites and D1 at the Venoge were the only ones with evidence of PKD infection. As these were also locations with very low abundance, a positive correlation is con-cluded. Water temperatures which favour PKD outbreak were also found at these sites.
Water quality parameters indicated high levels of nitro-gen compounds at all of the Venoge sites, and the two most downstream sites in the Emme and the Necker. Addition-ally, ammonium and nitrite appeared to be elevated at the LBK D1 site. These observations were generally consistent with wastewater percentages greater than 1 % at this site.
According to the ecotoxicological measurements and assessments, there was exposure of fi sh to tebutam only during a short time period in Venoge, whereas for all other of the measured pesticides and for the other rivers, critical pesticide exposure to fi sh was not identifi ed. When critical effect levels for aquatic biota other than fi sh are considered, a risk is indicated for diazinon in Emme and Venoge and, for the latter river, also for di-uron, since the measured median concentrations of these compounds in the river water are in the range of the envi-ronmental quality standard (EQS). When considering maximal instead of median concentrations, additionally atrazine, diuron and metolachlor in Emme and Venoge, and diazinon and diuron in LBK and Necker raise a po-tential risk. Since measurements were made only at the most downstream sites, no correlations with the histo-logical liver index were possible. The site-specifi c as-sessment of PBDE was hampered by the lack of thresh-olds, though detectable levels were found at all LBK sites, Emme D1, Necker D1, and Venoge D1 and D2.
Estrogenic potentials were at levels of concern at nearly all the sites where data were recorded, except for those headwater sites where there are no wastewater in-puts. A hypothesized correlation with VTG induction is not supported by the data.
Habitat quality is generally quite high at the Emme HW site, all Necker sites, and the two downstream
Venoge sites, but at least partially impaired at the most upstream LBK and the most upstream Venoge locations (Schager and Peter, 2004). Siltation may be a concern in the LBK and two downstream Venoge sites. Other loca-tions have relatively poor morphology. There is only evi-dence of food limitation at the Necker HW and Emme D1, but for the other two rivers there are no data and a correlation with condition factor is not apparent.
In the rivers Emme and Necker, gravel transport is initiated by winter fl oods approximately every 5 years. In contrast, the river Venoge experiences extended gravel transport nearly every winter season. Accordingly, in all these rivers, high winter fl oods with gravel transport are possible factors that impair reproduction of brown trout. Data are not available on this factor for LBK.
Questions to be answered by literature data (5–7)
PKD, estrogenic exposure, and gravel bed washout by fl oods are the only causative factors that cause specifi c
effects. These effects can, however, be modulated in their
strength by environmental confounding factors. PKD is an infectious disease of salmonids caused by the myxo-zoan parasite Tetracapsuloides bryosalmonae which can be specifi cally identifi ed by a serial combination of three different methods (Wahli et al., 2007). High water tem-perature, as well as slow-fl owing water and high amount of organic pollutants can also favour the settlement, dis-tribution and proliferation of fi lter-feeding bryozoans, which serve as intermediate host for the parasite (Gay et al., 2001). Accordingly, these factors may favour the dis-tribution of the parasite. River water temperatures in-creased in the last 25 years in Swiss rivers (Hari et al., 2006). This led to a shift in brown trout habitat up-river and contributed to an increase in PKD incidence at the habitat’s lower boundaries (Hari et al., 2006).
Estrogens are of key importance for reproductive fi t-ness, and VTG induction in male fi sh is established as a specifi c biomarker of exposure to environmental estro-gens (e.g. Sumpter and Jobling, 1995). As a consequence, VTG induction specifi cally indicates a preceding expo-sure to estrogens – but no statements on the duration of this exposure and concentration of estrogens can be made. Signifi cant inductions were not found at the test areas (Körner et al., 2007). However, it has to be kept in mind that VTG response can be modulated by tempera-ture infl uence and stress parameters (King et al., 2003; Berg et al., 2004).
Large spates with movement of gravel may cause washout of salmonid eggs and fry, or physically damage them, leading subsequently to their death (Crisp, 2000; Massa, 2000). Massa (2000) showed that even small gravel transport can lead to damage of offspring. There-fore, populations with abnormally low numbers of young-of-the-year are likely to have been exposed to washout.
Experimental and observational results can be used
as evidence for causation for many of the intermediate and primary factors (Table 1). For example, a severe dis-turbance of embryonic recruitment of brown trout due to fi ne sediment particles and siltation was described by several authors (Turnpenny and Williams, 1980; Lucken-bach et al., 2001; Kobler, 2004). In a multiple stepwise regression analysis, (Eklöv et al., 1999) showed that stream size was the most important component for den-sity of age 0 brown trout with higher densities found in smaller streams. Shading was also strongly associated with high densities of age 0 brown trout (Eklöv et al., 1999). Shading is important for the regulation of the wa-ter temperature and in consequence might decrease stress. Vegetation at river banks is also known as a source for allochthonous food input into the rivers. In small rivers, up to 80 % of gastric contents of brown trout is composed of terrestrial input (Gisler, 1991). In addition, river banks with extensive vegetation build a barrier for sediment in-put. However, too heavy shading causes a decrease in productivity of a river (Zalewski et al., 1998). In conse-quence, shading is important not only for age 0, but indi-rectly for the fi tness of all age classes and was therefore related to the adverse effect of hepatosomatic index. The productivity of an ecosystem is often expressed in amount of food benthos, and a threshold of 20 g/m2 was defi ned
(Vuille, 1997). The amount of food contributes to the health and fi tness of fi sh, one of the resulting indicators is the condition factor. In addition, the percentage of riffl es and the connectivity are further parameters used to de-scribe the state of the physical habitat and limit the abun-dance of brown trout, if insuffi cient. In respect to con-nectivity, spawning areas are mostly located in headwaters and small tributaries from where the juveniles could mi-grate to main streams if connectivity is provided (Bagliniere and Maisse, 2002; Schager et al., 2007).
Removal of the stressor leading to the amelioration of
the situation could be used as supporting evidence for a cause-effect relation according to question 7. For our study, only few data, were available. An experimental re-moval of nitrite lead to a recovery of several physiologi-cal parameters (Azevedo et al., 2004; Rodriguez-Moreno and Tarazona, 1994) and nitrite is detoxifi cated by trout hepatocytes (Doblander and Lackner, 1996). Accordingly a regeneration of liver structure can be assumed as well. In contrast, after removal of diazinon, no recovery was observed (Brewer et al., 2001). For the other factors, no appropriate data could be found to evaluate the effects of removal.
Weight of evidence conclusions
The weight of evidence suggests that PKD is a very like-ly factor for the low abundance at the two most down-stream sites of Venoge and Emme.
Further, nitrite, partly in addition with ammonia or the wastewater percentage as described in the method section: “physio-chemical data”, are very likely causes of adverse effects on the liver index at the two downstream sites of Emme and Necker, the D1 site at LBK and all sites in Venoge.
Of the micropollutants, only tebutam was assessed as a possible factor at the downstream site of the Venoge and PBDE at D1 in Emme as well as at D1 and HS of LBK.
Of the parameters characterizing habitat, the river bed in LBK D2 and in Venoge D1 and D2 the average width is assessed as a likely or possible factor infl uencing re-cruitment. Also, likely contributing to this adverse effect is the low percentage of riffl es in Emme D2, which is possibly contributing in Emme HW and all sites in Venoge. The limited connectivity is a possible factor for insuffi cient brown trout abundance at all sites in the Emme, whereas siltation might possibly affect the re-cruitment in the two downstream sites of Venoge. Insuf-fi cient shading is a possible factor at all sites of Venoge for an adverse effect on the hepatosomatic index.
The elevated water temperature in winter above 9 °C at LBK D1 and Emme D2, as well as in Venoge D2 where water temperature surpasses the optimal temperature threshold for growth of 19 °C leads to an assessment of these factors as likely.
Discharge with gravel transport in winter possibly af-fects successful recruitment in all rivers except LBK.
Discussion
This study was designed to identify the most likely fac-tors for the low abundance of brown trout in the four test areas. Data on the brown trout population, water quality and habitat in the investigated rivers were different enough to defi ne distinct patterns of impairments. How-ever, many stressors overlapped in their temporal and spatial occurrence. Since extrapolation from effects on lower levels of the biological hierarchy (e.g. individual parameters) to the population level is diffi cult, this evalu-ation differentiated between primary factors (anthropo-genic or natural stressors) and their effects on intermedi-ate factors. Clearly, we have to differentiintermedi-ate between primary factors which affect, for example the intermedi-ate factor recruitment only (such as unsuitable tempera-ture for eggs) and those affecting the population as a whole. We looked at the single primary factors and evalu-ated them for their relation to the most direct and domi-nant adverse effects only. However, other relations could also exist, but their investigation is hampered by lack of knowledge on the interactions between factors. For ex-ample, synthetic chemicals might also affect food organ-isms of fi sh and as a consequence, lead to insuffi cient nutritional status of fi sh. However, too little is known on
this effect under natural conditions to investigate these relations with the weight-of-evidence approach.
In all rivers, the headwater sites were characterized by the occurrence of the least number of stressors, sup-porting our decision to apply the gradient approach and to select these sites as reference conditions.
Additionally, in all rivers at least two of the studied parameters were identifi ed as candidate causes contribut-ing to the observed low brown trout abundance. The ap-plication of the WOE was successful in making the avail-able evidence transparent and improves the likelihood that causes are identifi ed.
We identifi ed nine candidate causes for the river Emme with their number increasing along the down-stream gradient. At all sites, the summer temperature re-gime can contribute to PKD infection at all sites, and the high correlation with the low abundance and the low cruitment at these sites make this factor very likely re-sponsible for the decline in brown trout abundance. Evi-dence for PKD as a causative agent for decline in fi sh abundance is supported by the study of Schubiger (2003). However, this disease was not identifi ed at the headwater site. This is probably due to the migration barriers and the great distance between D1 and HW. The slightly ele-vated histological liver index could be due to water tion, as indicated by nitrogen compounds. Water pollu-tion is known to affect fi sh liver structure (Bernet et al., 2000; Bernet and Segner, 2004) and, for example, nitrite and ammonia can induce a range of liver pathological al-terations (Michael et al., 1987). Stress, due to insuffi cient habitat parameters could also contribute to increase in liver alterations. The very poor morphology of the two downstream sites, the uniform habitat structure and con-nectivity to the tributaries aggravate the situation, in par-ticular for the offspring. Especially in case of spate in winter, the probability of devastating effects on eggs or recently emerged fry is high and certainly contributes to low recruitment success and low trout abundance.
The river LBK was characterized by the poor situa-tion at the site D1, where high concentrasitua-tions of ammo-nia, nitrite and high percentage of wastewater, together with unsuitable winter temperature affecting survival of offspring all contribute to poor health and brown trout abundance. Additionally, at this site, the highest concentrations of fl ame retardents were measured in fi sh. Since concentrations are low in the WWTP effl uent, in-puts from agriculture or atmospheric deposition have to be considered (Hartmann et al., 2006). Possibly, the high histological liver index at this (and the further down-stream site) is due to this poor water quality. Increased histological liver and kidney indices, together with the occurrence of liver tumours were reported in previous studies (Bassi et al., 2001; Schneeberger, 1995).
PKD was not diagnosed at LBK and the water tem-perature never surpassed 15 °C during both years of
in-vestigation. However, in former years, PKD was identi-fi ed (Bassi et al., 2001) and could have contributed to the reported fi sh decline in LBK. The total fi sh abundance was stated as high along the whole river (Schager and Peter, 2004), with a high predominance of rainbow trout at the two downstream sites where the brown trout abun-dance was poor. A competition for spawning sites and feed can lead to a decrease in brown trout abundance (Scott and Irvine, 2000). The inner siltation could have aggravated the situation. The consideration of the river-specifi c context led us to conclude, more comprehensive-ly, that the combination of poor health status and compe-tition possibly has led to the decrease in brown trout abundance and recruitment in LBK.
Fish decline in the Necker was most diffi cult to ex-plain by the factors investigated. Whereas in most rivers, elevated nitrogen compounds are accompanied by other stressors, high nitrite concentrations are the only very likely water quality factor at the two downstream sites in the Necker. Our experiments revealed poor early life-stage survival rates at these sites. Together with the pos-sible contribution of discharge with gravel transport in the winter, which may cause the total loss of an age-group on average every fi fth year, nitrite concentrations might have led to poor recruitment in the Necker. PKD was never diagnosed.
In the Venoge, 12 factors were identifi ed as possible, likely or very likely contributing to reduced abundance, recruitment or impaired fi sh health. It is striking that all these factors occur at the most downstream site, 9 are still present at the middle site, and even at the most upstream site, 4 factors contribute. This is even more astonishing since data for two very important parameters, recruitment and brown trout abundance could not be raised due to mixing of the population with migrating sea trout at the two downstream sites. Hence the weight of evidence analysis was compromised and likely underestimates the contributing factors.
The results at the Venoge refl ect the intensive agricul-ture and the inputs of numerous, although small, sewage treatment plants. Tebutam possibly poses a risk for fi sh health. Considering the not-identifi ed peak concentra-tions, the not measured sites more upstream in the agri-cultural zone as well as the not covered critical time win-dows, pesticide concentrations might still be high enough to affect brown trout. For example, the organophospho-rous pesticide, diazinon, led to a decline in estradiol lev-els in bluegill sunfi sh, was suggested to disrupt the hor-monal pathways and, as a consequence can affect the reproductive capacity (Maxwell and Dutta, 2005). Simi-larily, the algicide diuron, acts as an anti-androgenic compound in bioassays (Bauer et al., 1998). Receptor mediated effects have generally a very low threshold and evidence for such effects should be regarded seriously. PKD is very likely a prominent cause for the reduced