Safety climate and its association with office
type and team involvement in primary care
KATRIN GEHRING1, DAVID L.B. SCHWAPPACH1,2, MARKUS BATTAGLIA3, ROMAN BUFF4, FELIX HUBER5,PETER SAUTER6AND MARKUS WIESER7
1
Swiss Patient Safety Foundation, Asylstr. 77, Zuerich 8032, Switzerland,2Institute of Social and Preventive Medicine (ISPM), University of Bern, Bern, Switzerland,3Praxis Bubenberg, Bubenbergplatz 11, Bern 3011, Switzerland,4Medizinisches Zentrum Arbon, Schlossgasse 4, 9320 Arbon, Switzerland,5mediX Gruppenpraxis, Rotbuchstrasse 46, Zuerich 8037, Switzerland,6eastcare AG, Ikarusstrasse 9, St.Gallen-Winkeln 9015, Switzerland, and7hawadoc AG, Garnmarkt 1, Winterthur 8400, Switzerland
Address reprint requests to: Katrin Gehring, Swiss Patient Safety Foundation. Asylstr. 77. 8032 Zuerich, Switzerland. Tel: +41-43-2437670; Fax: +41-43-243-7671; E-mail: [email protected]
Accepted for publication 17 March 2013
Abstract
Objective. To assess differences in safety climate perceptions between occupational groups and types of office organization in primary care.
Methods. Primary care physicians and nurses working in outpatient offices were surveyed about safety climate. Explorative factor analysis was performed to determine the factorial structure. Differences in mean climate scores between staff groups and types of office were tested. Logistic regression analysis was conducted to determine predictors for a ‘favorable’ safety climate. Results. 630 individuals returned the survey (response rate, 50%). Differences between occupational groups were observed in the means of the ‘team-based error prevention’-scale (physician 4.0 vs. nurse 3.8, P < 0.001). Medical centers scored higher compared with single-handed offices and joint practices on the ‘team-based error prevention’-scale (4.3 vs. 3.8 vs. 3.9, P < 0.001) but less favorable on the‘rules and risks’-scale (3.5 vs. 3.9 vs. 3.7, P < 0.001). Characteristics on the individual and office level predicted favorable ‘team-based error prevention’-scores. Physicians (OR = 0.4, P = 0.01) and less experienced staff (OR 0.52, P = 0.04) were less likely to provide favorable scores. Individuals working at medical centers were more likely to provide positive scores compared with single-handed offices (OR 3.33, P = 0.001). The largest positive effect was associated with at least monthly team meetings (OR 6.2, P < 0.001) and participation in quality circles (OR 4.49, P < 0.001).
Conclusions. Results indicate that frequent quality circle participation and team meetings involving all team members are effect-ive ways to strengthen safety climate in terms of team-based strategies and activities in error prevention.
Keywords: patient safety, safety climate, medical errors, primary care
Introduction
Safety of health care has gained increasing attention in the past years. While most research has been conducted in hospital care, the available studies suggest that patients are at consider-able risk in the outpatient care setting as well. The incidence of medical errors in primary care ranges from 5 to 80 per 100 000 consultations as Sanders and Esmail report [1]. In particular, preventable adverse drug events are frequent among patients in outpatient care [2,3]. Gurwitz et al. report an overall rate of adverse drug events among older patients in the ambulatory setting of 50.1/1000 person-years, of which 28% were considered preventable [4]. Sarkar et al. recently esti-mated that ∼4.5 million ambulatory visits related to adverse drug events occur each year in the US [5]. Studies based on staff members’ incident reports in the UK yielded an error report rate of 75/1000 patient contacts in outpatient care [6].
In a similar study conducted in the US, errors and preventable adverse events were reported after 24% of outpatient visits [7]. In Australia, the incidence of error reported to an anonymous reporting system by general practitioners was 0.24% per patient seen per year [8].
Safety culture has been identified as a fundamental charac-teristic of and requirement for organizations that value and promote patient safety [9, 10]. It has been described as ‘the product of individual and group values, attitudes, perceptions, competencies and patterns of behaviour that determine the commitment to, and the style and proficiency of, an organiza-tion’s health and safety management’ [11]. Safety climate, the measurable manifestation of safety culture, has been defined as the‘surface features of the safety culture from attitudes and perceptions of individuals at a given point in time’ [12]. Safety climate is usually assessed with self-administered staff survey instruments, of which a number have been developed in the
last years [13, 14]. Moderate positive associations of safety climate with safety performance and health outcomes have been reported previously [15, 16]. Research conducted in hospitals suggests that safety climate perceptions differ between occupa-tional groups, specialty, function and, in particular, proximity to clinical care [17–21]. However, little research has been con-ducted to investigate differences in safety climate perceptions in primary care. In outpatient primary care, different occupational groups work often together in small teams, and it is unclear whether different perceptions of safety climate exist in these teams. There is also a large variety in the organizational type of primary care offices ranging from small single-handed offices in which the physician is also owner of the office and employer, over joint practices with two or more physicians, to large medical centers with employed physicians. These differences in office organization may also determine how team-based learn-ing from and prevention of errors is established. The aim of this study was to assess safety climate in outpatient primary care. We investigated differences between occupational groups and types of medical office organization and analyzed the association of office organization with office teams’ strategies for prevention and management of errors.
Methods
Survey
In a cross sectional study, primary care physicians and nurses working in outpatient offices were surveyed about the safety climate in their offices by questionnaire. The survey also asked participants to report the frequency of occurrence of specific safety incidents in their offices and the harm resulting from these incidents (data not reported here) [22]. The safety climate items were adapted from the SAQ (ambulatory office version), the PC-QUEST and the FRASIK (Frankfurt Patient Safety Climate Questionnaire), a German language safety climate survey for general practice [23–25]. English language items were translated into German forward and backward by two independent translators. All items were adapted to the Swiss health care system, culture and context. Nine items were newly developed, and 22 were derived from existing instruments. Thefinal survey included 30 items relating to teamwork, stress recognition, job satisfaction, working conditions, perception of management, safety systems and climate. One additional item asked for a global rating of safety in the office. Respondents rated their agreement with each item using a 5-point Likert scale ranging from 1 (disagree strongly) to 5 (agree strongly). Background information on the respondent and their working environment were also obtained. The questionnaire was tested it-eratively with eight practitioners. We focused on the comprehen-sion of the single items and reduced ambiguous or unclear wordings. The questionnaire was adapted accordingly.
Sample
The sample consists of all primary care physicians (n = 627 physicians) and 627 nurses formally organized in four large
physician networks (labeled A–D hereinafter) and included 472 offices. The physician networks were selected because they cover a broad range of office types and regions in the German-speaking part of Switzerland including two metropol-itan areas, smaller cities as well as rural regions. Two networks (C and D) oblige their members to adhere to guidelines and quality of care standards (e.g. participation in quality circles) and have medical network directors. Networks A and B pre-dominantly collaborate in organizational andfinancial issues. In addition to the heterogeneity of affiliated offices, we chose to approach networks because network affiliation of physicians facilitated organization of data collection. The physicians were mailed the questionnaire together with a cover letter and pre-paid envelope. Each physician received two complete survey sets. The physician was instructed to pass the set labeled‘nurse’ to one nurse according to the alphabetic pos-ition of thefirst letter of the last names of all nurses working in the office. The nurses of each participating office were sent a letter to inform about the study, announce the survey and explain how they would receive the questionnaire by the phys-ician. The survey was completely anonymous. A reminder in-cluding an identical set of questionnaires was sent after two weeks to the entire sample.
Data analysis
Returned questionnaires were digitally scanned. Negatively worded items were reverse-coded. All items were considered to have equal weighting. Explorative factor analysis (EFA) was performed by principal-component analysis with oblique rota-tion to determine the factorial structure of the instrument. Factors were selected based on a scree plot and eigenvalues. Following the criterion that the eigenvalues of the new factors should be >1 (Kaiser–Guttmann criterion), a four-factor solu-tion is suggested. Elbow criteria tended to favor afive-factor solution, but thisfifth factor represented no meaningful con-stellation. The four-factor solution showed the best interpret-ation of the data. Items that showed loadings <0.40 or nearly identical loadings on two or more factors (high cross-loadings) were excluded from analysis and are not considered in thefinal factor solution. Internal consistency of the remaining items in the scales was measured using Cronbach’s Alpha. For the final factor composition, item loadings <0.40 were not considered. For each identified scale, scale scores were calculated by summing the item scores for each scale and dividing it by the number of completed items of the scale. The scale score thus ranges from 1 to 5. Higher scores represent a more positive at-titude. For each respondent, a mean score of≥4 for the items in a particular factor implies a‘positive safety attitude’ for that factor. To ease interpretation of results and comparison with other safety climate survey studies, the percentage of respon-ders with a‘positive’ safety climate response was calculated by dichotomizing scores <4 as ‘unfavorable’ and scores ≥4 as ‘favorable’ [23,26]. T-tests and analyses of variance were con-ducted to test for differences in mean scale scores, single item measures of safety climate and overall ratings of patient safety between occupational groups ( physicians vs. nurses) and types of office (single handed vs. joint practice vs. medical center).
Logistic regression analysis was conducted to determine predictors for a‘favorable’ safety climate (dependent variable). To systematically include a broad range of potential influential factors, we used variables from the individual, the office, and the network level to predict safety climate scores: respondents’ characteristics (age, occupational group, years of professional experience, years of staff membership in this office), office characteristics (type of medical office, number of staff in the office, office location, whether there is a staff member in charge of quality assurance, whether there are regular team meetings with the entire office team, participation in quality circles) and network affiliation were entered as independent variables. We also estimated a linear multiple regression model with climate scores as dependent variable. However, this model yielded essentially the same results. To study the joint effects of respondent and office characteristics, the logistic regression model was then used to predict probabilities for a favorable (≥4) ‘team-based error prevention’-score by occupational group, type of office and frequency of team meetings and quality circle participation. Finally, we investigated the level of inter-rater agreement in climate scores by office type and network to assess whether individuals’ agreement was stronger on the office or the network level. We estimated rwg, an index of inter-rater agreement for groups defined by office type and network affiliation [27, 28]. All tests were two-sided, and a P-value < 0.05 was regarded significant.
Results
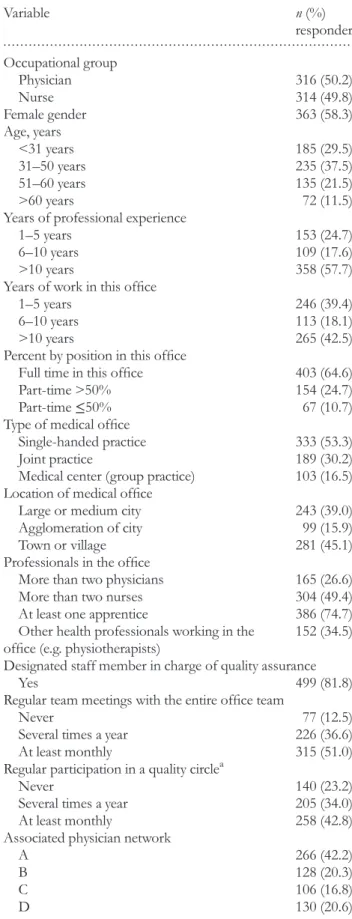
Of the 1254 invited individuals, 630 (50.2% physicians, 49.8% nurses) returned the questionnaire (response rate in both groups: 50%). Details of responders and the offices are pro-vided in Table1.
Explorative factor analysis
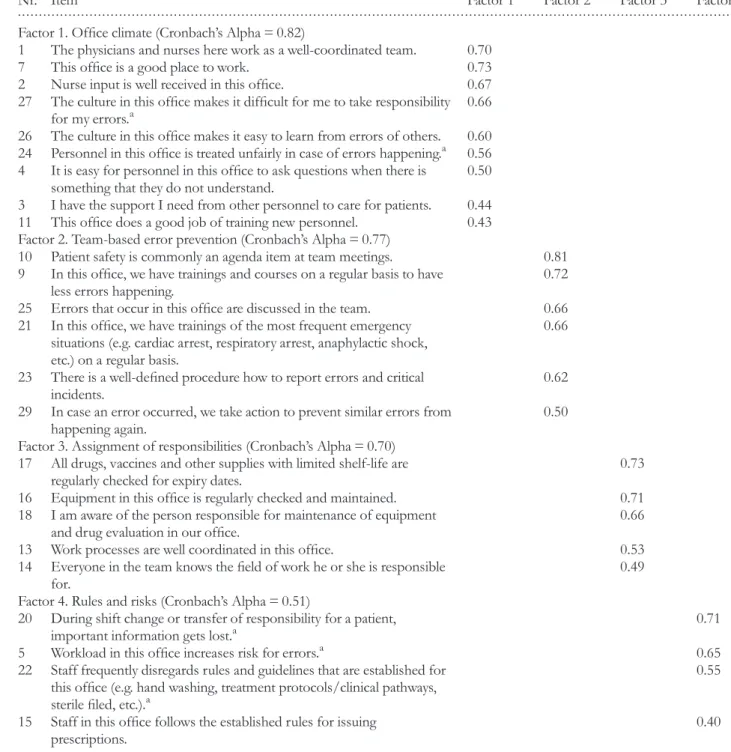
Kaiser–Meyer–Olkin measure for sampling adequacy (KMO = 0.89) and Bartlett’s Test of sphericity (Chi-square = 3406.31; P< 0.001) confirmed that the data are suitable for factor ana-lysis. The exploratory factor analysis yielded a four-factor solu-tion for 24 items. Six items were excluded from thefinal factor composition. The four factors were labeled based on the items contained in the cluster: office climate (nine items, Cronbach’s Alpha = 0.82), team-based error prevention (seven items, Cronbach’s Alpha = 0.77), assignment of responsibilities (five items, Cronbach’s Alpha = 0.70) and rules and risks (four items, Cronbach’s Alpha = 0.51). Cronbach’s Alpha of the entire instrument was 0.85. Results of the factor analysis are presented in Table2. The four-factor structure explained 47% of the total variance.
Safety climate scores
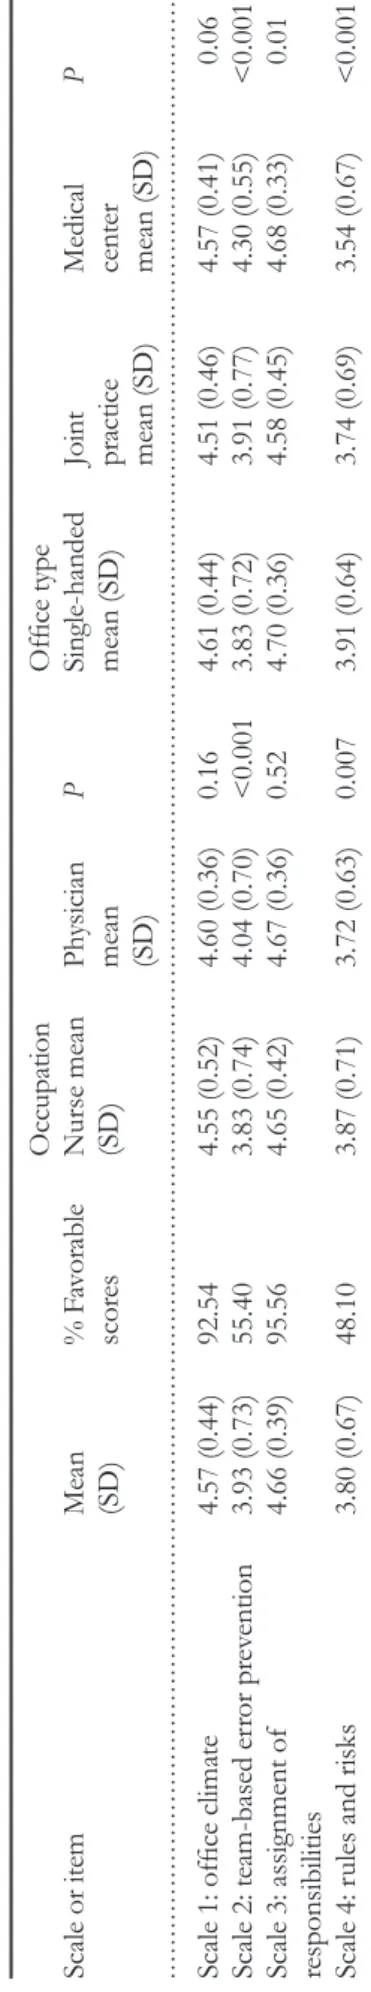
The percentage of participants with a positive climate response (‘favorable score’ ≥4) differs strongly between the safety-climate scales (range, 97–48%, Table 3). The ‘team-based error prevention’-scale and the ‘rules and risks’-scale have the
. . . . Table 1 Characteristics of responders and their work environment (n = 630 responders) Variable n(%) responders Occupational group Physician 316 (50.2) Nurse 314 (49.8) Female gender 363 (58.3) Age, years <31 years 185 (29.5) 31–50 years 235 (37.5) 51–60 years 135 (21.5) >60 years 72 (11.5)
Years of professional experience
1–5 years 153 (24.7)
6–10 years 109 (17.6)
>10 years 358 (57.7)
Years of work in this office
1–5 years 246 (39.4)
6–10 years 113 (18.1)
>10 years 265 (42.5)
Percent by position in this office
Full time in this office 403 (64.6) Part-time >50% 154 (24.7)
Part-time≤50% 67 (10.7)
Type of medical office
Single-handed practice 333 (53.3)
Joint practice 189 (30.2)
Medical center (group practice) 103 (16.5) Location of medical office
Large or medium city 243 (39.0) Agglomeration of city 99 (15.9) Town or village 281 (45.1) Professionals in the office
More than two physicians 165 (26.6) More than two nurses 304 (49.4) At least one apprentice 386 (74.7) Other health professionals working in the
office (e.g. physiotherapists) 152 (34.5) Designated staff member in charge of quality assurance
Yes 499 (81.8)
Regular team meetings with the entire office team
Never 77 (12.5)
Several times a year 226 (36.6) At least monthly 315 (51.0) Regular participation in a quality circlea
Never 140 (23.2)
Several times a year 205 (34.0) At least monthly 258 (42.8) Associated physician network
A 266 (42.2)
B 128 (20.3)
C 106 (16.8)
D 130 (20.6)
They are organized for nurses and physicians separately.
a
lowest percentages of favorable scores (55 and 48%, respect-ively). The mean of the global safety climate item was 4.64 (SD = 0.59) across all offices. Ninety-seven percent of respon-ders provided a favorable response to this item.
Differences between occupational groups and medical office type
Significant differences between occupational groups were observed in the means of the‘team-based error prevention’-. prevention’-. prevention’-. prevention’-. prevention’-. prevention’-. prevention’-. prevention’-. prevention’-. prevention’-. prevention’-. prevention’-. prevention’-. prevention’-. prevention’-. prevention’-. prevention’-. prevention’-. prevention’-. prevention’-. prevention’-. prevention’-. prevention’-. prevention’-. prevention’-. prevention’-. prevention’-. prevention’-. prevention’-. prevention’-. prevention’-. prevention’-. prevention’-. prevention’-. prevention’-. prevention’-. prevention’-. prevention’-. prevention’-. prevention’-. prevention’-. prevention’-. prevention’-. prevention’-. prevention’-. prevention’-. prevention’-. prevention’-. prevention’-. prevention’-. prevention’-. prevention’-. prevention’-. prevention’-. prevention’-. prevention’-. prevention’-. prevention’-. prevention’-. prevention’-. prevention’-. prevention’-. prevention’-. prevention’-. prevention’-. prevention’-. prevention’-. prevention’-. prevention’-. prevention’-. prevention’-. prevention’-. prevention’-. prevention’-. prevention’-. prevention’-. prevention’-. prevention’-. prevention’-. prevention’-. prevention’-. prevention’-. prevention’-. prevention’-. prevention’-. prevention’-. prevention’-. prevention’-. prevention’-. prevention’-. prevention’-. prevention’-. prevention’-. prevention’-. prevention’-. prevention’-. prevention’-. prevention’-. prevention’-. prevention’-. prevention’-. prevention’-. prevention’-. prevention’-. prevention’-. prevention’-. prevention’-. prevention’-. prevention’-. prevention’-. prevention’-. prevention’-. prevention’-. prevention’-. prevention’-. prevention’-. prevention’-. prevention’-. prevention’-. prevention’-. prevention’-. prevention’-. prevention’-. prevention’-. prevention’-. prevention’-. prevention’-. prevention’-. prevention’-. prevention’-. prevention’-. prevention’-. prevention’-. prevention’-. prevention’-. prevention’-. prevention’-. prevention’-. prevention’-. prevention’-. prevention’-. prevention’-. prevention’-. prevention’-. prevention’-. prevention’-. prevention’-. prevention’-. prevention’-. prevention’-. prevention’-. prevention’-. prevention’-. prevention’-. prevention’-. prevention’-. prevention’-. prevention’-. prevention’-. prevention’-. prevention’-. prevention’-. prevention’-. prevention’-. prevention’-. prevention’-. prevention’-. prevention’-. prevention’-. prevention’-. prevention’-. prevention’-. prevention’-. Table 2 Factor loadings for explanatory factor analysis (principal-component analysis with oblique rotation) and Cronbach’s Alpha for each factor (n = 515 with no missing data)
Nr. Item Factor 1 Factor 2 Factor 3 Factor 4
Factor 1. Office climate (Cronbach’s Alpha = 0.82)
1 The physicians and nurses here work as a well-coordinated team. 0.70 7 This office is a good place to work. 0.73 2 Nurse input is well received in this office. 0.67 27 The culture in this office makes it difficult for me to take responsibility
for my errors.a
0.66 26 The culture in this office makes it easy to learn from errors of others. 0.60 24 Personnel in this office is treated unfairly in case of errors happening.a 0.56 4 It is easy for personnel in this office to ask questions when there is
something that they do not understand.
0.50 3 I have the support I need from other personnel to care for patients. 0.44 11 This office does a good job of training new personnel. 0.43 Factor 2. Team-based error prevention (Cronbach’s Alpha = 0.77)
10 Patient safety is commonly an agenda item at team meetings. 0.81 9 In this office, we have trainings and courses on a regular basis to have
less errors happening.
0.72 25 Errors that occur in this office are discussed in the team. 0.66 21 In this office, we have trainings of the most frequent emergency
situations (e.g. cardiac arrest, respiratory arrest, anaphylactic shock, etc.) on a regular basis.
0.66
23 There is a well-defined procedure how to report errors and critical incidents.
0.62 29 In case an error occurred, we take action to prevent similar errors from
happening again.
0.50 Factor 3. Assignment of responsibilities (Cronbach’s Alpha = 0.70)
17 All drugs, vaccines and other supplies with limited shelf-life are regularly checked for expiry dates.
0.73 16 Equipment in this office is regularly checked and maintained. 0.71 18 I am aware of the person responsible for maintenance of equipment
and drug evaluation in our office.
0.66 13 Work processes are well coordinated in this office. 0.53 14 Everyone in the team knows thefield of work he or she is responsible
for.
0.49 Factor 4. Rules and risks (Cronbach’s Alpha = 0.51)
20 During shift change or transfer of responsibility for a patient, important information gets lost.a
0.71 5 Workload in this office increases risk for errors.a 0.65 22 Staff frequently disregards rules and guidelines that are established for
this office (e.g. hand washing, treatment protocols/clinical pathways, sterilefiled, etc.).a
0.55
15 Staff in this office follows the established rules for issuing prescriptions.
0.40
Factor loadings <0.40 are not presented.
a
scale and the ‘rules and risks’-scale. Significant differences between office types were observed for means of scale 2 (‘team-based error prevention’), scale 3 (‘assignment of re-sponsibilities’) and scale 4 (‘rules and risks’). Medical centers scored higher compared with single-handed offices and joint practices on the‘team-based prevention of error’-scale but less favorable on work load and compliance with rules (‘rules and risks’-scale).
Predictors for a favorable‘team-based error prevention’ climate
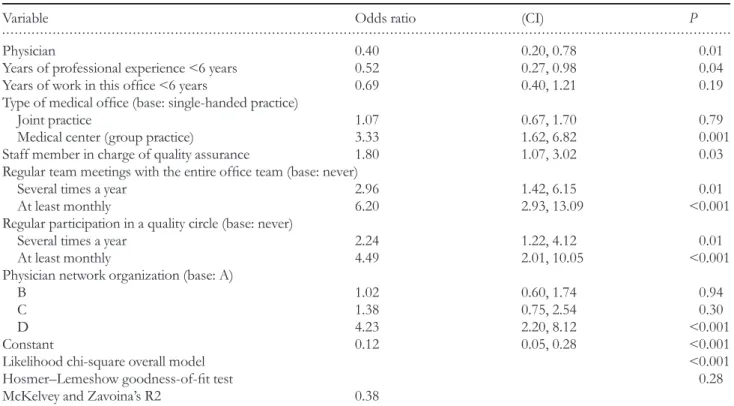
Table4presents results of the logistic regression model on the dichotomized scale score of the‘team-based error prevention’-scale. The Hosmer–Lemeshow test (chi-square 9.77, P= 0.282) indicates that the estimates of the modelfit the data well. Characteristics on the individual, the office and the network level predicted favorable‘team-based error prevention’-scores. Physicians and less-experienced individuals were less likely to provide favorable scores. Individuals working at medical centers were three times more likely to provide positive scores compared with single-handed offices. The largest positive effect is associated with at least monthly team meetings and par-ticipation in quality circles. Affiliates of network D were also more likely to provide favorable scores.
The joint effects of respondent and office-level characteris-tics on the likelihood of a favorable ‘team-based error prevention’-score are displayed in Fig.1. Irrespective of occu-pational group and type of office, team meetings and quality circle participation at least monthly result in a high probability of favorable scores (P > 0.5). In single-handed and joint offices, team meetings and quality circle participation several times a year (but less than monthly) yield positive scores in nurses, but not in physicians. The highest likelihood of a favor-able ‘team-based error prevention’-score is observed for nurses and physicians in medical centers with team meetings and quality circle participation at least monthly (P = 0.89). Level of agreement among responders
in‘team-based error prevention’ climate
To illuminate whether agreement among responders was higher on the office type or network level, we estimated rwg, an index of inter-rater agreement for the ‘team-based error prevention’-scale (scale 2) by office type and network. All scores exceeded the recommended 0.7 threshold (rwg range, 0.79–0.90), suggesting a good level of inter-rater agreement. However, there were no substantial and systematic differences in rwgbetween office types and networks. The highest level of agreement among responders was found for medical centers (rwg,0.89) and network D affiliates (rwg,0.90).
Discussion
Summary of main findings
In this study, we report about an instrument to assess different dimensions of safety climate and its application to Swiss
.. .... ... ... .. ... ... ... .. ... ... .. ... ... ... .. ... ... ... .. ... ... ... .. ... ... ... .. ... ... ... .. ... ... .. ... ... ... .. ... ... ... .. ... ... ... .. ... ... ... .. ... ... ... .. ... ... ... .. ... ... .. ... ... ... .. ... ... ... .. ... ... ... .. ... ... ... .. ... ... ... .. ... ... .. .. T able 3 Mean, standard devia tion per centag e o f fa vor able scor es (≥ 4) and g roup differ ences (occupa tional g roup ,type of of fice) for the sa fety clima te scales Occupa tion Of fice type Scale or item Mean (SD) % F av or able scor es Nurse mean (SD) Ph ysician mean (SD) P Single-handed mean (SD)
Joint practice mean
(SD)
Medical center mean
(SD) P Scale 1: of fice clima te 4.57 (0.44) 92.54 4.55 (0.52) 4.60 (0.36) 0.16 4.61 (0.44) 4.51 (0.46) 4.57 (0.41) 0.06 Scale 2: team-based er ro r p re vention 3.93 (0.73) 55.40 3.83 (0.74) 4.04 (0.70) <0.001 3.83 (0.72) 3.91 (0.77) 4.30 (0.55) <0.001 Scale 3: assignment of responsibilities 4.66 (0.39) 95.56 4.65 (0.42) 4.67 (0.36) 0.52 4.70 (0.36) 4.58 (0.45) 4.68 (0.33) 0.01 Scale 4: rules and risks 3.80 (0.67) 48.10 3.87 (0.71) 3.72 (0.63) 0.007 3.91 (0.64) 3.74 (0.69) 3.54 (0.67) <0.001
primary care offices. Nurses scored significantly higher than physicians on the‘rules and risks’-scale (scale 4), and significant-ly lower on the ‘team-based error prevention’-scale (scale 2).
The comparison of the office types shows highest scores for single-handed offices on ‘office climate’ (scale 1), ‘rules and risks’ (scale 4) and ‘assignment of responsibilities’ (scale 3). . . . . Table 4 Results of logistic regression on favorable scores on the‘team-based error prevention’-scale (n = 567 with no missing data)
Variable Odds ratio (CI) P
Physician 0.40 0.20, 0.78 0.01
Years of professional experience <6 years 0.52 0.27, 0.98 0.04 Years of work in this office <6 years 0.69 0.40, 1.21 0.19 Type of medical office (base: single-handed practice)
Joint practice 1.07 0.67, 1.70 0.79
Medical center (group practice) 3.33 1.62, 6.82 0.001
Staff member in charge of quality assurance 1.80 1.07, 3.02 0.03 Regular team meetings with the entire office team (base: never)
Several times a year 2.96 1.42, 6.15 0.01
At least monthly 6.20 2.93, 13.09 <0.001
Regular participation in a quality circle (base: never)
Several times a year 2.24 1.22, 4.12 0.01
At least monthly 4.49 2.01, 10.05 <0.001
Physician network organization (base: A)
B 1.02 0.60, 1.74 0.94
C 1.38 0.75, 2.54 0.30
D 4.23 2.20, 8.12 <0.001
Constant 0.12 0.05, 0.28 <0.001
Likelihood chi-square overall model <0.001
Hosmer–Lemeshow goodness-of-fit test 0.28
McKelvey and Zavoina’s R2 0.38
Figure 1 Predicted probabilities of a favorable (≥4) team-based error prevention score (scale 2) by occupational group (individual level), type of office and frequency of team meetings and quality circle participation (office level). All other variables set constant at their median. The red dashed line indicates the threshold probability of 0.5.
Contrary, medical centers scored significantly higher on the ‘team-based error prevention’-scale (scale 2) compared with single and joint offices. We found large variability in safety climate scores in the team-based error prevention dimension. Items in this scale represent procedures and standards in the office that support a shared understanding of all team members regarding office processes on safety.
Favorable scores on the team-based error prevention di-mension were significantly determined by predictors on the in-dividual level, the office level as well as the affiliated network level. The largest fraction of variance in ‘team-based error prevention’-scores can be attributed to non-individual charac-teristics, namely the type of medical office, practice procedures (regular team meetings, quality circle participation) and the af-filiation to a specific network. The relevant practice procedures ( participation in team meetings and quality circles) focus on team processes and emphasize the importance of joint activ-ities and exchange amongst professionals in the prevention, management and work-up of errors in the offices. The effect of network association can in part be explained by the obliga-tions these networks place on associated physicians in terms of quality management and certification. For example, network D fosters quality circles for nurses. Network affili-ation may also cover latent, unmeasured office and staff char-acteristics.
Strengths and limitations of the study
The main strengths of this study are the large sample size and the nearly equal participation of physicians and nurses. We were able to relate differences in perceived safety climate to in-dividual and office characteristics. We acknowledge the limita-tions of our study: first, we sampled only offices associated with a physician network organization that limits the generaliz-ability of our results. Network organizations place specific requirements on their members, which leads to rather high standards in these networks [29]. In addition, we cannot rule out response bias. Unfortunately, no data are available to allow comparison of responders with non-responders, or even our sample with national or regional data of offices on relevant characteristics. Second, due to the small number of cases in some cells, we could not explore associations of staff and office characteristics with office climate (scale 1) and assign-ment of responsibilities (scale 3). Third, the internal consist-ency of scale 4 (rules and risks) was rather moderate. As Cronbach’s Alpha is affected by the number of items in a scale, which is small in scale 4, we accepted the limited internal consistency of this factor. Future research in other samples is needed however to explore other factor solutions and confirm or disregard our four-factor model. Finally, we do not know whether scores on our safety climate instrument are in fact related to patient safety. Recent research suggests that SAQ safety climate scores are moderately associated with mortality and length-of-stay in intensive care [16]. In general, however, there is yet little strong evidence that safety climate is linked to clinical outcomes [30].
Comparison with existing literature
In our study, safety climate, especially team-based safety activ-ities, was determined by individual-, office- and network-level characteristics. Our analyses of inter-rater agreement suggest that staff working at medical centers and affiliates of network D share a high level of agreement in evaluating team-based error prevention climate. However, our results do not indicate which of the two characteristics (office type and network) are more relevant. Thus, to understand differences in safety climate and their origin, these different levels have to be con-sidered. This mirrors results from the hospital setting: Deilkas et al. report that variance in safety culture scores is related to both, the ward level, at which teams are constituted, and the department level [31]. Thus, to study variations and potentially improve safety climate, the hospital level may not be the most relevant organizational unit to be addressed. In analogy, in primary care, analyses on the office level may not suffice. Rather, the consideration of higher organizational levels, such as network affiliation, may provide additional valuable insight into safety climate. This may become even more relevant as primary care will be increasingly organized within managed care frameworks.
In our study, office type was an important predictor of fa-vorable team-based error prevention climate scores. Gaal et al. report that there is an effect of practice size on patient safety management features in primary care. Larger offices with three and more physicians scored higher, e.g. in medication safety management, practice building safety, incident reporting or medical record keeping [32]. Larger primary care offices seem to put stronger emphasis on team involvement into error prevention activities as well as in the implementation of specif-ic measures of patient safety management. Obviously, with higher numbers of staff involved and more complex struc-tures, there is more need for rules and team-based procedures. Our results add to that evidence that monthly team meetings with the entire office team are an important feature, irrespect-ive of the specific office type. Non-compliance and overriding of rules was reported more frequently among larger offices compared with single-handed offices. However, this effect may simply be due to the fact that larger offices may establish rules for behaviors under risk (that can then be broken), while smaller offices do not. In other words, the observed difference does not necessarily reflect a higher frequency of rule-breaking, and thus risky behavior in larger offices but a higher degree of self-perceived non-compliance with imple-mented rules.
Implications for future research or clinical practice Our study provides important findings on safety climate in primary care and its organizational precursors. Despite the limitations due to the correlational nature of our data, the results suggest that primary care offices can benefit from regular team meetings involving nurses and physicians and from rather frequent participation in quality circles. These positive effects of quality circles and team meetings were
observed for all types of offices and in both professional groups. This implies that perceptions of team-based error pre-vention climate are influenced by processes and structures implemented at the office level. However, quality circles are mainly implemented for physicians whereas quality circles for nurses and entire teams are still rare. Future research is clearly needed regarding the optimal frequency and configuration of team-based activities and their effects on safety culture and safety incidents. It will also be valuable to examine whether team-based activities decrease differences between safety per-ceptions of different groups of staff and foster a shared under-standing of safety in the medical office. Our study also revealed that single offices, joint offices and medical centers differ in strengths and weaknesses regarding safety climate. This suggests that safety climate in primary care should be analyzed and dis-cussed relative to office type rather than ‘lumping together’ all primary care offices. Moreover, research is needed to gain a more detailed understanding of the relationship between office size and the different dimensions of safety climate.
Acknowledgements
The authors thank all physicians and nurses who participated in the study and completed the survey. Advice by several experts on prior versions of the survey is highly appreciated.
Funding
This work was supported by the Swiss Medical Association (FMH). The funding source had no influence on study design; collection, analysis, and interpretation of the data; writing of the manuscript; and decision to submit the manuscript for publication. The views expressed and any errors or omissions are the sole responsibility of the authors.
Ethical approval
Ethical approval is not required for this study in Switzerland.
REFERENCES
1. Sandars J, Esmail A. The frequency and nature of medical error in primary care: understanding the diversity across studies. Fam Pract2003;20:231–6.
2. Thomsen LA, Winterstein AG, Sondergaard B et al. Systematic review of the incidence and characteristics of preventable adverse drug events in ambulatory care. Ann Pharmacother 2007;41:1411–26.
3. Miller GC, Britth HC, Valenti L. Adverse drug events in general practice patients in Australia. Med J Aust 2006;184:321–4. 4. Gurwitz JH, Field TS, Harrold LR et al. Incidence and
prevent-ability of adverse drug events among older persons in the ambu-latory setting. JAMA 2003;289:1107–16.
5. Sarkar U, López A, Maselli JH et al. Adverse drug events in US adult ambulatory medical care. Health Serv Res 2011;46:1517–33.
6. Rubin G, George A, Chinn DJ et al. Errors in general practice: development of an error classification and pilot study of a method for detecting errors. Qual Saf Health Care 2003;12:443–7. 7. Elder NC, Meulen MV, Cassedy A. The identification of medical
errors by family physicians during outpatient visits. Ann Fam Med 2004;2:125–9.
8. Makeham MA, Kidd MR, Saltman DC et al. The Threats to Australian Patient Safety (TAPS) study: incidence of reported errors in general practice. Med J Aust 2006;185:95–8.
9. Institute of Medicine. To Err is Human. Building a Safer Health System. Washington, DC: National Academy Press;2000. 10. Nieva VF, Sorra J. Safety culture assessment: a tool for improving
patient safety in healthcare organizations. Qual Saf Health Care 2003;12:ii17–ii23.
11. Health and Safety Commission (HSC). Third Report: Organizing for Safety. ACSNI Study Group on Human Factors. London: HMSO; 1993.
12. Halligan M, Zecevic A. Safety culture in healthcare: a review of concepts, dimensions, measures and progress. BMJ Quality & Safety2011;20:338–43.
13. Colla JB, Bracken AC, Kinney LM et al. Measuring patient safety climate: a review of surveys. Qual Saf Health Care 2005;14: 364–6.
14. Flin R, Burns C, Mearns K et al. Measuring safety climate in health care. Qual Saf Health Care 2006;15:109–15.
15. Singer S, Lin S, Falwell A et al. Relationship of safety climate and safety performance in hospitals. Health Serv Res 2009;44:399–421. 16. Huang DT, Clermont G, Kong L et al. Intensive care unit safety culture and outcomes: a US multicenter study. Int J Qual Health Care2010;22:151–61.
17. Huang DT, Clermont G, Sexton JB et al. Perceptions of safety culture vary across the intensive care units of a single institution. Crit Care Med2007;35:165–76.
18. Pronovost PJ, Weast B, Holzmueller CG et al. Evaluation of the culture of safety: survey of clinicians and managers in an academ-ic medacadem-ical center. Qual Saf Health Care 2003;12:405–10.
19. Singer SJ, Gaba DM, Falwell A et al. Patient safety climate in 92 US hospitals: differences by work area and discipline. Med Care 2009;47:23–31.
20. Singer SJ, Falwell A, Gaba DM et al. Patient safety climate in US hospitals: variation by management level. Med Care 2008;46:1149–56.
21. Shaw KN, Ruddy RM, Olsen CS et al. Pediatric patient safety in emergency departments: unit characteristics and staff percep-tions. Pediatrics 2009;124:485–93.
22. Gehring K, Schwappach DLB, Battaglia M et al. Frequency of and harm associated with primary care safety incidents. Am J Manag Care2012;18:e323–e37.
23. Modak I, Sexton JB, Lux TR et al. Measuring safety culture in the ambulatory setting: the safety attitudes questionnaire –ambu-latory version. J Gen Intern Med 2007;22:1–5.
24. de Wet C, Spence W, Mash R et al. The development and psycho-metric evaluation of a safety climate measure for primary care. Qual Saf Health Care2010;19:578–84.
25. Hoffmann B, Domanska OM, Albay Z et al. The Frankfurt Patient Safety Climate Questionnaire for General Practices (FraSiK): analysis of psychometric properties. BMJ Quality & Safety2011;20:797–805.
26. Sexton J, Helmreich R, Neilands T et al. The Safety Attitudes Questionnaire: psychometric properties, benchmarking data, and emerging research. BMC Health Serv Res 2006;6:44.
27. James LR, Demaree RG, Wolf G. Estimating within-group inter-rater reliability with and without response bias. J Appl Psychol 1984;69:85–98.
28. James LR, Demaree RG, Wolf G. rwg: an assessment of
within-group interrater agreement. J Appl Psychol 1993;78:306–9.
29. Czerwenka W, Metzger K, Fritschi K. Erste Quali-med-net Erhebung. Hoher Qualitätsstand in Schweizer Ärztenetzen. Schweizerische Ärztezeitung2010;91:1856–8.
30. Rosen AK, Singer S, Zhao S et al. Hospital safety climate and safety outcomes: is there a relationship in the VA?. Med Care Res Rev2010;67:590–608.
31. Deilkas E, Hofoss D. Patient safety culture lives in departments and wards: multilevel partitioning of variance in patient safety culture. BMC Health Serv Res 2010;10:85.
32. Gaal S, van den Hombergh P, Verstappen W et al. Patient safety features are more present in larger primary care practices. Health Policy2010;97:87–91.