DOI 10.1007/s00027-006-0844-3 © Eawag, Dübendorf, 2007
Aquatic Sciences
Research Article
Assessment of fi sh health status in four Swiss rivers showing
a decline of brown trout catches
Simone Zimmerli1 , Daniel Bernet1 , Patricia Burkhardt-Holm2 , Heike Schmidt-Posthaus1 , Pascal Vonlanthen1 , Thomas Wahli1
and Helmut Segner1,*
1
Centre for Fish and Wildlife Health, University of Bern, P.O. Box 8466, CH-3001 Bern, Switzerland
2
Program Man-Society-Environment (MGU), University of Basel, Vesalgasse 1, CH-4051 Basel, Switzerland Received: 9 November 2005; revised manuscript accepted: 30 April 2006
Abstract. A pronounced decline in catch of brown trout
(Salmo trutta L.) over the last 10–20 years has been reported for many rivers in Switzerland. Impaired health status of the fi shes has been suggested as one possible cause of the decline. The present study investigated the health status of juvenile brown trout from four Swiss rivers which experienced reductions of brown trout catches during the last two decades: Emme, Liechtensteiner Binnenkanal (LBK), Necker and Venoge. A gradient approach was applied, studying at each river a headwater (HW), midstream (D1) and downstream site (D2). Fish health was assessed by the following indices: hepatic 7-ethoxyresorufi n-O-deethylase (EROD) activity, organ (liver, kidney) histopathology, and gross biometric indices (condition factor, hepatosomatic index). Hepatic EROD activities were generally low without showing
signifi cant within- or between-stream differences. His-topathological alterations of the liver displayed a moderate downstream increase in the Emme, LBK and Necker, but not in the Venoge. Between-stream differ-ences of liver pathology were small. Kidney histopathol-ogy was not different between upstream and downstream sites, except for Emme and Venoge, where fi shes at the downstream sites were infected with the parasite
Tetra-capsuloides bryosalmonae, the cause of the proliferative
kidney disease (PKD). The fi ndings from this study point to an association of within-stream gradients in water quality, PKD prevalence, fi sh health and brown trout bio-mass, whereas between-stream differences of actual fi sh health status refl ecting the different levels of catch clines observed in the four rivers during the last two de-cades are not evident.
*
Corresponding author phone: +41-31 631 2441;
fax: +41-31 631 2611; e-mail: helmut.segner@itpa.unibe.ch Published Online First: March 2, 2007
Key words: Brown trout; EROD; histopathology; kidney; liver; proliferative kidney disease; fi sh health; bio marker.
Introduction
Over the past few decades several lines of evidence indi-cated that brown trout (Salmo trutta) populations in Swit-zerland are at risk. On average, catch of brown trout has declined by approximately 40–50% over the last 10–20 years (Burkhardt-Holm et al., 2002). In parallel, brown
trout with macroscopic lesions and histopathological al-terations have been observed in a number of Swiss rivers, pointing to an impaired health status of the fi sh (Bernet et al., 2000; Schmidt-Posthaus et al., 2001). Based on such observations, the project “Fischnetz” (“Fish net” – na-tional project on declining fi sh catch) was initiated which aimed to evaluate possible causes of the fi sh catch de-cline in Swiss rivers (Burkhardt-Holm et al., 2002; Fischnetz, 2004; Burkhardt-Holm et al., 2005).
“Fischnetz” formulated several hypotheses on the possible causes of the impairment of brown trout
popula-tions in Switzerland, including, among others, poor water quality, altered habitat structure, increased loads of fi ne sediments, increased water temperature, or altered angler behaviour and fi sheries management (see Burkhardt-Holm et al., 2002; 2005). The present study addresses the hypothesis that an impaired health status of brown trout in Swiss rivers contributes to the observed catch decline. Factors such as pathogens, insuffi cient food resources, or environmental stressors such as high water temperature or toxicant exposure infl uence fi sh health, possibly leading to altered fi sh survival, recruitment, and, ultimately, popu-lation growth. Since a retrospective assessment of fi sh health over the last 10 to 20 years when catches of brown trout were declining was not possible, we investigated the actual health status of brown trout in four Swiss rivers which have experienced different levels of catch reduc-tion during the last 20 years. Further, for each of the four rivers an instream gradient was studied (Downes et al., 2002), i.e. comparing fi sh health at upstream, midstream and downstream reaches which were characterised by dif-ferent abundances of brown trout. This within-stream and between-streams comparison provides the option to cor-relate variations of fi sh abundance, fi sh health and possi-ble causative factors such as pathogens or water quality.
Four river basins were selected for health assessment of brown trout: the Emme, the Liechtensteiner Bin-nenkanal (LBK), the Necker and the Venoge. During the last 20 years, catches of the main resident fi sh species in these four streams, the brown trout (Salmo trutta), de-clined by 25 to 90%. Since fi sh health is a multi-paramet-ric endpoint, we used a combination of several, both spe-cifi c and integrative health indices (cf. Adams et al., 1989; Triebskorn et al., 2001; Broeg et al., 2005): 7-ethoxyre-sorufi n-O-deethylase (EROD) activity was measured to indicate exposure of brown trout to dioxin-like xenobiot-ics and polycyclic aromatic hydrocarbons (PAH). These contaminants have been involved in several cases of de-clining fi sh populations (Fairbrother et al., 1999; Rolland, 2000; Whyte et al., 2000; van der Oost et al., 2003). Or-gan histopathology was examined since histopathological changes integrate the impact of a variety of stressors in-cluding pathogens, toxic compounds or unfavourable nu-tritional and temperature conditions and for this are valu-able markers of environmental stress (Hinton et al., 1992; Segner and Braunbeck, 1988, 1990; Schmidt-Posthaus et al., 2001; Au, 2004). In addition, impaired organ structure and function can directly affect survival, growth and re-production of the organism (Chavin, 1973; Stebbing, 1985; Segner and Braunbeck, 1988; Teh et al., 1997; Wahli, 2002). Finally, gross indices such as condition fac-tor (CF) and hepatosomatic index (HSI) were determined since they represent integrative indicators of fi sh condi-tion (Mayer et al., 1992). The study was performed over a two-year-period in order to estimate the year-to-year vari-ability of the investigated parameters.
Materials and methods Sampling
In each of the four rivers, fi sh were sampled at three sites, one headwater site (HW) near the river source which was in three of four rivers not impacted by wastewater effl u-ents from sewage treatment plants (STPs), and two more anthropogenically infl uenced sites downstream of the river: midstream site (D1) and downstream site (D2). In the Emme, Necker and upper Venoge, the sites were ei-ther separated by barriers or the distance between the sites was large enough to consider fi sh migration negligi-ble. In the lower Venoge and LBK, however, some migra-tion may occur. Sampling was done in August 2002 and in August 2003. At each site in each river, 20 juvenile brown trout (total length from 8.4 to 22.4 cm) were col-lected. Due to the decline of the brown trout populations in the four rivers, a sample size of 20 fi sh could not be achieved at each site: in the river Emme, at D2 (n = 6), at D1 (n =19) in 2002, and in the following year, at D1 (n = 14) and no fi sh at all at D2; in the Necker, in 2003 only 16 at D2 and 14 at HW; in LBK, at D2, 15 fi sh, at D1, 13 fi sh and at HW19 fi sh in 2003, no fi sh at D2 in 2002. In the Venoge, a drought made sampling impossible at the HW site in 2003.
Determination of water quality parameters at the sampling sites was done by cantonal laboratories (Envi-ronmental Protection Offi ce St. Gallen, Envi(Envi-ronmental Protection Offi ce Liechtenstein, Water and Soil Protec-tion Laboratory of Bern, Water and Soil ProtecProtec-tion Labo-ratory of Vaud) which analysed once per month the fol-lowing parameters: dissolved organic carbon, nitrate, nitrite, ammonium, orthophosphate and total phospho-rus. The water temperature was measured by means of data loggers (Minilog) at each site once or twice per hour during the whole year (Schager and Peter, 2004).
Analytical procedures
Fish were caught by electrofi shing. After capture, length and weight (total weight, including viscera) of the fi shes were measured. Then, the fi shes were sacrifi ced by an overdose of MS 222 (tricaine methane-sulfonate 250 mg/ l). A standard necropsy was performed and sex of the fi shes was recorded. Liver and kidney were removed and the liver was weighted to determine the hepatosomatic index (HSI). The condition factor CF was calculated as K = 100 * W/L 3, where W = body weight (g) and L =
length (cm). The HSI was calculated as ratio of liver mass to body mass.
Hepatic EROD activity was measured using the ki-netic enzyme assay based on the protocol of Behrens and Segner (2001). Briefl y, the cranial part of the liver was shock-frozen in liquid nitrogen before storage at –80 °C until use. After thawing, liver tissue (0.1 g) was
nized on ice using a Elvehjem potter in 1 ml of homoge-nisation buffer (50 mM Tris, 2 M saccharose, 2 mM Na2
-EDTA, 150 mM KCl, 0.2 mM dithiothreitol, 0.2 mM phenylmethylsulfonylfl uoride; pH 7.6). The homogenate was centrifuged at 10,000 g at 4 °C for 20 min. The super-natant was carefully removed and centrifuged for 1 h at 100,000 g at 4 °C in an ultracentrifuge. The pellet con-taining the microsomal fraction was resuspended in 200 µl phosphate buffer (80 mM Na2HPO4, 20 mM
KH2PO4, 150 mM KCl; pH 7.6). Directly before the
measurement of the EROD activity, the resuspended mi-crosomes were diluted 1:5 with phosphate buffer. EROD activities were measured in a fl uorescence plate reader (Multilable Counter 1420-011 VICTOR2). In the wells of opaque microtiter plates, 300 µl phosphate buffer con-taining 47 µM NADPH and 0.5 µM ethoxyresorufi n were mixed with 5 µl sample and the amount of resorufi n pro-duced during 300 s at 21 °C was determined at the excita-tion wavelength of 544 nm and at the emission wave-length of 590 nm. The reaction velocity was calculated from the linear portion of the reaction curve and was transformed into pmol resorufi n by means of a resorufi n standard curve. The standard curve was established by determining the fl uorescence of serial resorufi n concen-trations (62.5–500 nM). EROD activity was expressed as pmol of resorufi n formed per min per mg microsomal protein. Each sample was measured in duplicate. The mean value was used for subsequent calculations. Micro-somal protein was determined by Bio-Rad DC protein assay.
For histological and immunohistological examina-tions, pieces of the kidney and of the caudal part of the liver from all fi sh were fi xed in buffered 4% formalin, embedded in paraffi n wax and sectioned according to routine histological protocols. The 5 µm sections were stained with hematoxylin and eosin (HE). Glass slides were code-labelled and were examined “blind”.
Histological responses were semi-quantitatively evaluated according to a protocol proposed by Bernet et al. (1999). For each organ investigated, the pathological changes were classifi ed into fi ve reaction patterns: Circu-latory disturbances (C), regressive changes (R), progres-sive changes (P), infl ammation (I) and neoplasms (N). For liver and kidney, an index was calculated for each reaction pattern, e.g. for the liver: Circulatory liver index (IL-C), regressive liver index (IL-R), infl ammatory liver index (IL-I) and neoplastic liver index (IL-N). The sum of these indices yields the total organ index: IL for the liver and IK for the kidney. These indices are indicative for the extent and intensity of histological alteration in the respective tissue and convert qualitative observations on alterations in tissue morphology into a quantitative value.
In order to separate in the semi-quantitative evalua-tion fi sh with pathologically altered organs from those
with non-altered organs, we developed a scoring scheme for liver (IL) and kidney (IK). This scheme is based on scorings obtained from the histopathological organ indi-ces of brown trout reared in either tap water (“non-stressed control conditon”) or collected from strongly polluted water (“strongly pathological condition”):
•
Histological index <10: normal/healthy structure; tis-sue architecture and histology are well developed and show no impairments or pathological changes•
Histological index 11–20: slight modifi cations of nor-mal tissue architecture and morphology (e.g. change in cell size) are present.•
Histological index 21–30: moderate modifi cations of normal tissue architecture and morphology are present.•
Histological index 31–40: pronounced modifi cations of normal tissue architecture and morphology are present.•
Histological index >40: severe alterations of normal tissue architecture and morphology.In Emme and Venoge, brown trout populations are in-fected with the parasite Tetracapsuloides bryosalmonae causing the proliferative kidney disease (PKD) (see Wahli et al., 2002). This disease can induce a pronounced infl ammatory response of kidney tissue; the diagnosis of PKD-infected fi sh is therefore essential in the histopatho-logical evaluation of the kidney. Diagnosis of PKD was accomplished on the one hand by histological identifi ca-tion of the PKD-causing parasite Tetracapsuloides
bryo-salmonae in HE-stained sections of the kidney tissue, and
on the other hand by immunohistochemical staining of the parasite (see Schubiger, 2003). Differential identifi -cation of the kidney parasite, Sphaerospora sp., was based on histological and immunohistochemical obser-vations.
Statistics
Biometrical, biochemical and histological data was ini-tially tested for normality using the Kolmogorov-Smir-nov test. Most data showed non-normal distribution. The Kruskal-Wallis test, Bonferroni corrected, was used to compare mean values beween sites. Correlations were determined using Sperman’s test of correlations. The level of signifi cance of all statistical tests was set at 5%. All statistical analyses were calculated using the NCSS programm version 2001.
Results
Study sites (Tables 1, 2)
The Emme is a mid-sized river of 80 km length extending from the foothills of the Alps to the Swiss midlands. Catch of brown trout has declined by approximately 60%
since 1990 (Scheurer, 2004; Burkhardt-Holm et al., 2006). During the study period (2002–2003), brown trout biomass differed strongly between upstream and down-stream sites (Table 1, Schager and Peter, 2004). The river
Table 1. Description of the two downstream (D1, D2) and the up-stream (HW) sampling sites at the four rivers, Emme, Necker, Liechtensteiner Binnenkanal (LBK), and Venoge.
Emme D2 D1 HW
Stream kilometre 59 56.2 9.3
Size (population equi- valents) of STP closest to
sampling site 40,000 26,000 no STP Distance of sampling site
to STP (km) 4 3 no STP
% effl uent in river water
at sampling site 2 3 no STP
Brown trout biomass:
kg/haa (2002/2003) 0/0.5 0/11.8 42.9/119.6
LBK D2 D1 HW
Stream kilometre 18 8 4
Size (population equi-valents) of STP closest to
sampling site no STP 4,500 no STP Distance of sampling
site to STP (km) no STP 1 no STP % effl uent in river water
at sampling site no STP 10 no STP Brown trout biomass:
kg/haa (2002/2003) 15.9/13.7 79.3/31.3 91.7/81.3
Necker D2 D1 HW
Stream kilometre 27 21 6
Size (population equi-valents) of STP closest to
sampling site 4,500 1,500 no STP Distance of sampling site
to STP (km) 3 1 no STP
% effl uent in river water
at sampling site 2 1 no STP
Brown trout biomass: kg/haa
(2002/2003) 5.7/11.6 34.3/35.6 24.5/47.6
Venoge D2 D1 HW
Stream kilometre 44 (Venoge) 39 (Venoge) 8 (Veyron) Size (population
equi-valents) of STP closest to
sampling site 21,250 10,200 1,750 Distance of sampling site
to STP (km) 2 1 6
% effl uent in river water
at sampling site 10.2 15 2
Brown trout biomass: 15.7/6.3 38.9/32.3 311.2/no
kg/haa (2002/2003) samplingb
a Fish abundance was determined by means of electrofi shing by
Dr. Eva Schager, Swiss Federal Institute for Environmental Sci-ence and Technology (Eawag), Kastanienbaum. A more detailed description of the fi sh population status at the study sites is given in Schager and Peter, 2004.
b
No fi sh sampling possible in summer 2003 due to drought STP: sewage treatment plant.
Table 2. Water quality parameters of the downstream (D1, D2) and upstream (HW) sampling sites at the four rivers, Emme, Necker, Liechtensteiner Binnenkanal (LBK) and Venoge.
Emme D2 D1 HW
DOC [mg C/l] 4.22 * 2.86 3.40
NO3-N [mg N/l] 3.76 2.51 0.52
NH4-N [mg N/l] 0.31 0.09 < 0.01
Ptot [mg P/l] 0.11 0.05 0.02
Temperature range July
and August 2002 (°C) 9.2–20.2 11.1–18.4 11.2–23.1 Yearly mean (°C) 2002 10.3 9.1 6.6 Temperature range July
and August 2003 (°C) 13.4–25.2 12.5–21.7 10.5–22.8 Yearly mean (°C) 2003 10.4 9.6 7.0 LBK D2 D1 HW DOC [mg C/l] 1.19 1.30 0.80 NO3-N [mg N/l] 0.89 1.50 1.00 NH4-N [mg N/l] 0.02 0.45* 0.08 Ptot [mg P/l] 0.01 0.03 0.02
Temperature range July
and August 2002 9.3–15.4 10.2–14.6 10.4–13.2 Yearly mean (°C) 2002 8.7 9.8 8.5 Temperature range July
and August 2003 9.5–15.5 10.6–18 11.1–14.9 Yearly mean (°C) 2003 8.9 10.2 8.9 Necker D2 D1 HW DOC [mg C/l] 1.90 1.92 1.30 NO3-N [mg N/l] 1.27 1.24 1.00 NH4-N [mg N/l] 0.03 0.03 <0.01 Ptot [mg P/l] 0.03 0.06 0.02
Temperature range July
and August 2002 n.d. n.d. 9.0–15.8 Yearly mean (°C) 2002 7.6 7.3 6.6 Temperature range July
and August 2003 11.2–25.6 10.2–24.4 9.2–16.8 Yearly mean (°C) 2003 9.0 8.9 6.8 Venoge D2 D1 HW DOC [mg C/l] 3.46 2.88 3.62 NO3-N [mg N/l] 3.95 3.71 2.39 NH4-N [mg N/l] 0.16 0.09 0.02 Ptot [mg P/l] 0.09 0.08 0.04
Temperature range July
and August 2002 12.0–20.2 12.4–18.6 10.4–14.2 Yearly mean (°C) 2002 10.1 9.7 8.1 Temperature range July
and August 2003 16.8–24.4 15.9–24.0 12.1–16.8 Yearly mean (°C) 2003 11.8 11.6 8.8
For dissolved organic carbon (DOC), nitrate, ammonia, and total phosphorus, the 80 percentiles are given for monthly measured samples in 2002.
* = Concentrations that exceeded the quality aims for running water according to the Swiss water pollution control decrete (GSchV, 1998): DOC [mg C/l] < 4, NH4-N [mg N/l] < 0.4.
For the temperature range indicated for July and August, minimum and maximum values during this period are given.
n.d.= not determined.
Chemical analyses were provided by cantonal laboratories (Environmental Pro-tection Offi ce St. Gallen, Environmental ProPro-tection Offi ce Lichtenstein, Water and Soil Protection Laboratory Bern, Water and Soil Protection Laboratory Vaud).
is considerably infl uenced by spring snowmelt and sea-sonal fl ow fl uctuation. The mean fl ow rate varies from 1.1 m3/s at the headwater (HW) site to 14.1 m3/s the most
downstream (D2) site. The construction of small dams and weirs has resulted in fragmentation, isolation of trib-utaries, and poor riparian conditions. Additionally, high water extraction takes place, primarily for agriculture. Natural trout habitats are found mostly in the upper reach. Total catchment area of the Emme is approximately 963 km2and is characterized mainly by forest (40% of the
catchment area), and farmland (35%, mostly down-stream). Buildings and streets take 5% of the area (Streh-ler, 2003). The stream receives effl uents from three larger STPs (Table 1), while a number of smaller STPs dis-charge into the river’s tributaries. The concentrations of the analysed nutrients including NO3-N, NH4-N, and Ptot
show a pronounced downstream increase, while for DOC a consistent trend was not evident (Table 2). In the lower reach of the Emme, several pesticides including atrazine, diuron and diazinon are present, with atrazine reaching maximum concentrations close to the predicted no-effect concentration (PNEC) of 700 ng/L (Götz et al., 2003; Burkhardt-Holm et al., 2006). Water temperature in the Emme during summer can go up to 20 °C and higher (Ta-ble 2), thus exceeding the physiological optimum of brown trout.
The Liechtensteiner Binnenkanal (LBK) is a 29-km-long channel constructed in the 1930s for fl ood protec-tion and land conversion. Catch of brown trout in the LBK has declined by approximately 90% since 1980 (Scheurer, 2004; Burkhardt-Holm et al., 2006). During the study period (2002–2003), brown trout biomass dif-fered strongly between the upstream and the downstream site (Table 1, Schager and Peter, 2004). Importantly, at both downstream sites (D1 and D2), brown trout lives in competition to rainbow trout (Schager and Peter, 2004). The fl ow is rather constant, ranging from a mean fl ow rate of 0.2 m3/s at the HW site to 1.7 m3/s at the D2 site.
The only prominent barrier, at the mouth of the channel, was removed in the year 2000. Restrictions of natural habitats are mainly due to longitudinal constructions leading to low variability in width and a regulated fl ow. This situation has led to high levels of stream bed fi nes and sediment clogging. The catchment area of 138 km2 is
dominated by forest (50%), with only 18% farmland. The area of buildings and streets occupies 10% (Strehler, 2003). There is one STP discharging into the LBK which is located close to D1 (Table 1). Accordingly, the LBK showed highest nutrient values and temperatures at D1 (Table 2), with NH4-N exceeding the Swiss quality aim
for running waters (GSchV, 1998). Further, elevated lev-els of polybrominated diphenyl ethers were found in trout liver sampled at D1 (Hartmann et al., 2006). Water tem-peratures of the LBK usually do not exceed 15 °C, even during summer (Table 2).
The Necker is a pre-alpine river in Northeast Switzer-land, with a length of 31 km. Catch of brown trout in the Necker has declined by more than half since 1980 (Scheurer, 2004; Burkhardt-Holm et al., 2006). During the study period (2002-2003), size of brown trout popula-tions decreased in the downstream direction, particularly between D1 and D2 (Table 1, Schager and Peter, 2004). The mean fl ow rate of the Necker is 0.3 m3/s at the HW
site and 0.6 m3/s at the D2 site. River morphology is only
mildly disturbed, providing varied habitats for all life stages of brown trout. The catchment area is 123 km2,
with 38% covered by forest and 35% used for farmland. Buildings and streets make up 4% of the area (Strehler, 2003). The Necker receives effl uents from three STPs. Most chemical values as well as temperature showed a downstream increase (Table 2). Pesticide concentrations in the Necker are low (Burkhardt-Holm et al., 2006). Summer water temperatures can go beyond 15 °C, at least at the two lower study sites, D1 and D2 (Table 2).
The Venoge represents a mid-sized river in the west midlands of Switzerland and fl ows into Lake Geneva. Catch of brown trout in the Venoge has declined by ap-proximately 25% during the last 20 years (Scheurer, 2004; Burkhardt-Holm et al., 2006). In the Venoge, like in the other rivers, an upstream-downstream gradient in brown trout biomass was present (Table 1, Schager and Peter, 2004). The mean fl ow rate of the Venoge is 0.2 m3/s
at the HW site and 2.5 m3/s at the D2 site. The Venoge
provides many natural or only mildly disturbed habitats, however, several weirs impair fi sh migration. While the two downstream sampling sites (D1, D2) are located at the Venoge, the headwater site is situated at a tributary stream, the creek Le Veyron. Le Veyron is occasionally desiccated (Table 1). Venoge and Le Veyron together have a catchment area of 231 km2 and a length of 70 km.
Land use in the catchment area of Le Veyron includes 56% forest and 40% intensive agriculture, while the drainage area of the Venoge is dominated by agriculture (57%). Buildings and streets take 8.5% of the area (Streh-ler, 2003). The stream is infl uenced by eighteen smaller STPs . Chemical values show a downstream increase, except for DOC (Table 2). The Venoge contains several pesticides and, similarly to the Emme, in the lower reach of the Venoge, atrazine concentrations can reach levels higher than the PNEC of 700 ng/L (Götz et al., 2003, Burkhardt-Holm et al., 2006). Summer water tempera-tures go beyond 15 °C (Table 2).
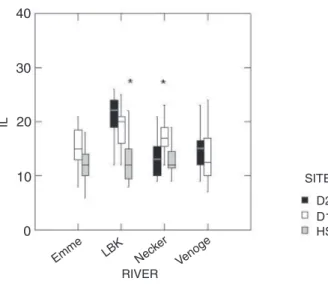
Gross body indices of brown trout
The condition factors (CF) of the fi sh collected in 2002 and 2003 at the 12 sample sites in the four streams are shown in Figures 1a and 1b. While in Emme and LBK, CF values tended to increase (approximately 3–7%) in the downstream direction, no clear-cut trend was evident in Venoge and Necker. When comparing CF values
be-tween the corresponding sampling sites of the four rivers, there existed no signifi cant between-stream differences, with the exception that in 2002, CF values of fi sh at HW of Necker were signifi cantly lower than CF values at HW of LBK (Kruskal-Wallis test, Bonferroni adjusted, nNecker
= 20, nLBK = 25; p < 0.05). Concerning between-year
variation of CF values, for none of the 12 sampling sites signifi cant differences could be observed. CF values of male and female juvenile trout were not signifi cantly dif-ferent, when calculated for all sampling sites, however,
Figure 1a. Condition factor of juvenile brown trout sampled in 2002 at the downstream (D1, D2) and upstream (HW) sites of the four riv-ers, Emme, Liechtensteiner Binnenkanal (LBK), Necker and Venoge. For details of the sampling sites: see text and tables 1 and 2. n-number of sampled fi sh ranged from 6 to 28. Sampling was done in July and August 2002. No samples were available for D2 of the LBK.
*: signifi cant differences between sampling sites per river (Kruskal-Wallis-Test, Bonferroni adjusted; p < 0.05).
1.5 1.3 1.1 0.9 0.7 Emme LBK Necke r Venoge RIVER SITE D2 D1 HS CF
Figure 1b. Condition factor of juvenile brown trout sampled in 2003 at the downstream (D1, D2) and upstream (HW) sites of the four rivers, Emme, Liechtensteiner Binnenkanal (LBK), Necker and Venoge. For details of the sampling sites: see text and tables 1, 2. n-number of sampled fi sh ranged from 13 to 20. Sampling was done in July to August 2003. No samples were available for D2 of Emme and HW of Venoge.
*: signifi cant differences between sampling sites per river (Kruskal-Wallis-Test, Bonferroni adjusted; p < 0.05).
1.5 1.3 1.1 0.9 0.7 Emme LBK Necke r Venoge RIVER SITE D2 D1 HS CF
Figure 2b. Hepatosomatic index (HSI) of juvenile brown trout sam-pled in 2003 at the downstream (D1, D2) and upstream (HW) sites of the four rivers, Emme, Liechtensteiner Binnenkanal (LBK), Necker and Venoge. For details of the sampling sites: see text and tables 1, 2.
n-number of sampled fi sh ranged from 13 to 20. Sampling was done in July and August 2003. No samples were available for D2 of Emme and HW of Venoge.
°: outlier. 3 2 1 0 Emme LBK Nec ker Venoge RIVER SITE D2 D1 HS HSI
Figure 2a. Hepatosomatic index (HSI) of juvenile brown trout sam-pled in 2002 at the downstream (D1, D2) and upstream (HW) sites of the four rivers, Emme, Liechtensteiner Binnenkanal (LBK), Necker and Venoge. For details of the sampling sites: see text and tables 1, 2.
n-number of sampled fi sh ranged from 6 to 28. Sampling was done in July and August 2002. No samples were available for D2 of LBK. *: signifi cant differences between sampling sites per river (Kruskal-Wallis-Test, Bonferroni adjusted; p < 0.05), °: outlier.
3 2 1 0 Emme LBK Nec ker Venoge RIVER SITE D2 D1 HS HSI
signifi cant gender differences were observed at individu-al sites, namely for D1 at LBK in 2003 (mean: mindividu-ales: 1.22; females 0.96, p = 0.016) and for D1 at Necker in 2003 (mean: males 1.01; females 0.96, p = 0.024).
Data on the hepatosomatic index (HSI) of the fi sh col-lected at the 12 sample sites in the four streams is shown in Figures 2a and 2b. Generally, in all four rivers a trend for increasing HSI values in the downstream direction is indicated. This increase ranged between 2 and 24%, and was signifi cant for Emme and Venoge in 2002. Betweenstream differences of HSI values were in no case signifi -cant.
EROD activities
In 2002, the highest values of hepatic EROD activity were observed at the site D1 of LBK and at the site D2 of Venoge (Fig. 3a). The lowest mean value of EROD activ-ity (11 pmol/mg protein/min) was found in fi sh at the site D2 of the Emme. In LBK and Venoge, fi sh from the HW sites showed signifi cantly lower EROD values than fi sh at the more downstream sites, but for Emme and Necker no signifi cant between-site differences existed. In 2003, particularly fi shes from the LBK tended to show higher mean EROD levels (107 to 128 pmol/mg protein/min) than in 2002 (Fig. 3b), however, the differences were not signifi cant. The only sampling site for which a signifi cant between-year difference was noted, was D2 at the Venoge (Kruskal-Wallis test, Bonferroni adjusted, n2002 = 16, n2003
= 15; p < 0.05). As in 2002, also in 2003 EROD values of fi shes from the HW site of the LBK were signifi cantly lower than in fi sh from D1 and D2 of the LBK (in the Venoge, due to draught, sampling of the HW site was not possible in 2003). A general trend for increasing EROD
values in the downstream direction of the four rivers (i.e. in parallel to the increasing load of wastewater and chemicals) was not evident. Only in the LBK and in the Venoge in 2002, downstream fi sh showed increased he-patic EROD activities, while in Emme and Necker, at least in 2003 trout from downstream exhibited signifi -cantly lower EROD activities than fi sh from the upstream site (Fig. 3b). Hepatic EROD values of male and female juvenile trout did not differ signifi cantly.
Liver histopathology
Liver lesions were found at all sites but the prevalence and the severity differed between the sites. Using the his-tomatrix approach of Bernet et al. (1999) (see Material and methods), alterations of hepatic histology were sum-marized into one numerical value, the total liver index (IL). This index is composed of fi ve types of liver le-sions: regressive, progressive, infl ammatory, circulatory and neoplastic changes. Circulatory disturbances and neoplasms were not detected in any of the 415 livers ex-amined. Regressive alterations (quantifi ed as regressive liver index IL-R) contained mainly a change of tissue structure and architecture, such as distended sinusoids, separation of liver cells, hepatocellular and nuclear pleo-morphism, changes in cellular cytoplasm, e.g., strongly eosinophilic or granulated cytoplasm, single cell necro-sis or necrotic foci. Progressive liver alterations (quanti-fi ed as progressive liver index IL-P) consisted mainly of an increased number of mitotic liver parenchymal cells and, occasionally, pericholangiar fi brosis. The infl am-matory index (IL-I) contained changes such as activation of the reticulo-endothelial system, and/or liver infi ltra-tion with lymphocytes and macrophages, either around
Figure 3a. Mean hepatic EROD activities ± standard error of brown trout sampled in 2002 at the downstream (D1, D2) and upstream (HW) sites of the four rivers, Emme, Liechtensteiner Binnenkanal (LBK), Necker and Venoge.
N = number of analyzed fi sh.
For details of the sampling sites: see text and tables 1, 2. Sampling was done in July and August 2002. No samples were available for D2 of LBK.
*: signifi cant differences between sampling sites per river (Kruskal-Wallis-Test, Bonferroni adjusted; p < 0.05).
Figure 3b. Mean hepatic EROD activities ± standard error of brown trout sampled in 2003 at the downstream (D1, D2) and upstream (HW) sites of the four rivers, Emme, Liechtensteiner Binnenkanal (LBK), Necker and Venoge.
N = number of analyzed fi sh.
For details of the sampling sites: see text and tables 1, 2. Sampling was done in July and August 2003. No samples were available for D2 of Emme and HW of Venoge.
*: signifi cant differences between sampling sites per river (Kruskal-Wallis-Test, Bonferroni adjusted; p < 0.05).
180 160 140 120 100 80 60 40 20 0 180 160 140 120 100 80 60 40 20 0 D2 n=5 D1 n=19 HW n=19 D1 n=15 HW n=20 D2 n=19 D1 n=18 HW n=18 D2 n=18 D1 n=21 HW n=20
Emme LBK Necker Venoge Emme LBK Necker Venoge
D1 n=15 HW n=13 D2 n=15 D1 n=13 HW n=15 D2 n=14 D1 n=14 HW n=14 D2 n=15 D1 n=14
bile ducts and ductuli, or randomly distributed in the pa-renchyma.
IL values of individual fi sh differed between 5 and 33 among the 415 livers examined in this study. If classify-ing livers with an IL value of <10 to represent undis-turbed liver structure, 6% of the examined livers were in this range. Among the remaining fi sh, 79% showed livers with slight modifi cations, i.e. an IL between 11–20, 14% of the livers were moderately altered (IL between 21–30) and 1% of the livers showed severe alterations, with IL values of 31 and more. The latter livers regularly showed necrotic foci. Interannual differences of the IL were not signifi cant, with the exception of the Necker where fi sh of the D2 showed signifi cantly lower IL values in 2003 than in 2002 ( Kruskal-Wallis test, Bonferroni adjusted, n2002 = 28, n2003 = 16; p < 0.05).
In the study period 2002, mean IL values of trout from the rivers Emme, LBK and Necker showed a down-stream increase (Fig. 4a). The downdown-stream change was signifi cant for LBK and Necker, but not for Emme. In the Venoge, a downstream increase was not evident. Con-cerning IL-R, IL-P, and IL-I, HW fi sh tended to have lower values, but the differences were not signifi cant, except for the infl ammatory index IL-I, which showed a signifi cant downstream increase in trout sampled in the Emme (Table 3). Comparing between-stream differences, IL values of fi sh from the HW of Venoge were signifi -cantly higher than of fi sh from the HW sites of Emme, LBK and Necker (Kruskal-Wallis test, Bonferroni ad-justed, nVenoge = 26, nEmme = 23, nNecker = 20, nLBK = 25; p >
0.05). In 2003, similar trends of IL values as described for 2002 were observed, with the exception of the Neck-er, where fi sh from the D1 site had signifi cantly higher IL values than fi sh from HW and D2 (Fig. 4b).
Kidney histopathology
The alterations of kidney histology were summarized into one numerical value, the total kidney index (IK). This index is composed of fi ve types of kidney lesions: regressive, progressive, infl ammatory, circulatory and neoplastic. As already observed for the liver, circulatory disturbances and neoplastic changes were not detected in any of the 408 kidneys examined. Regressive alterations (quantifi ed as regressive kidney index IK-R) consisted mainly of single pyknotic nuclei, single necrotic tubular epithelial cells, deposits of desquamating tubular cells, hyalinous casts in the lumina of the tubuli, changes in cytoplasmic appearance of epithelial cells such as eosi-nophilic granulated cytoplasm, deposits in the Bowman’s capsule and altered architecture of the glomeruli. In fi sh infected with the causative agent of the proliferative kid-ney disease (PKD), Tetracapsuloides bryosalmonae, re-gressive changes included multifocal necrosis of intersti-tial tissue and tubuli. Progressive alterations (quantifi ed as progressive kidney index IK-P) consisted mainly of an increased frequency of proliferating tubuli and a prolif-eration of interstitial tissue as being associated with an infection by Tetracapsuloides bryosalmonae. The in-fl ammatory kidney index (IK-I) was characterized mainly by granulomatous infi ltration in PKD-infected fi sh.
Pres-Figure 4a. Histological liver index (IL) of brown trout sampled in 2002 at the downstream (D1, D2) and upstream (HW) sites of the four rivers, Emme, Liechtensteiner Binnenkanal (LBK), Necker and Venoge. For details of the sampling sites: see text and tables 1, 2. n-number of sampled fi sh ranged from 6 to 28. Sampling was done in July and August 2002. No samples were available for D2 of LBK.
*: signifi cant differences between sampling sites per river (Kruskal-Wallis-Test, Bonferroni adjusted; p < 0.05).
Figure 4b. Histological liver index (IL) of brown trout sampled in 2003 at the downstream (D1, D2) and upstream (HW) sites of the four rivers, Emme, Liechtensteiner Binnenkanal (LBK), Necker and Venoge. For details of the sampling sites: see text and tables 1, 2. n-number of sampled fi sh ranged from 13 to 20. Sampling was done in July and August 2003. No samples were available for D2 of LBK.
*: signifi cant differences between sampling sites per river (Kruskal-Wallis-Test, Bonferroni adjusted; p < 0.05).
40 30 10 0 Emme LBK Nec ker Venoge RIVER SITE D2 D1 HS IL 20 40 30 10 0 Emme LBK Nec ker Venoge RIVER SITE D2 D1 HS IL 20
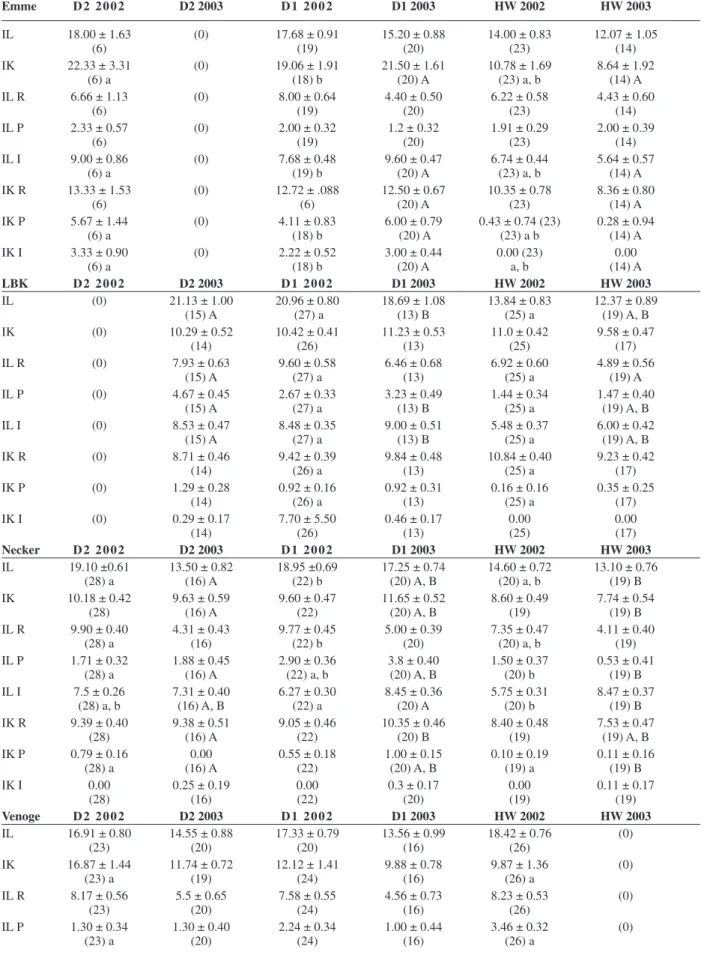
Table 3. Histological indexes (mean ± standard error) of fi shes sampled at downstream (D2), midstream (D1) and upstream (HW) sites of the four rivers Emme, Necker, Liechtensteiner Binnenkanal (LBK) and Venoge in the years 2002 and 2003.
Emme D 2 2 0 0 2 D2 2003 D 1 2 0 0 2 D1 2003 HW 2002 HW 2003 IL 18.00 ± 1.63 (0) 17.68 ± 0.91 15.20 ± 0.88 14.00 ± 0.83 12.07 ± 1.05 (6) (19) (20) (23) (14) IK 22.33 ± 3.31 (0) 19.06 ± 1.91 21.50 ± 1.61 10.78 ± 1.69 8.64 ± 1.92 (6) a (18) b (20) A (23) a, b (14) A IL R 6.66 ± 1.13 (0) 8.00 ± 0.64 4.40 ± 0.50 6.22 ± 0.58 4.43 ± 0.60 (6) (19) (20) (23) (14) IL P 2.33 ± 0.57 (0) 2.00 ± 0.32 1.2 ± 0.32 1.91 ± 0.29 2.00 ± 0.39 (6) (19) (20) (23) (14) IL I 9.00 ± 0.86 (0) 7.68 ± 0.48 9.60 ± 0.47 6.74 ± 0.44 5.64 ± 0.57 (6) a (19) b (20) A (23) a, b (14) A IK R 13.33 ± 1.53 (0) 12.72 ± .088 12.50 ± 0.67 10.35 ± 0.78 8.36 ± 0.80 (6) (6) (20) A (23) (14) A IK P 5.67 ± 1.44 (0) 4.11 ± 0.83 6.00 ± 0.79 0.43 ± 0.74 (23) 0.28 ± 0.94 (6) a (18) b (20) A (23) a b (14) A IK I 3.33 ± 0.90 (0) 2.22 ± 0.52 3.00 ± 0.44 0.00 (23) 0.00 (6) a (18) b (20) A a, b (14) A LBK D 2 2 0 0 2 D2 2003 D 1 2 0 0 2 D1 2003 HW 2002 HW 2003 IL (0) 21.13 ± 1.00 20.96 ± 0.80 18.69 ± 1.08 13.84 ± 0.83 12.37 ± 0.89 (15) A (27) a (13) B (25) a (19) A, B IK (0) 10.29 ± 0.52 10.42 ± 0.41 11.23 ± 0.53 11.0 ± 0.42 9.58 ± 0.47 (14) (26) (13) (25) (17) IL R (0) 7.93 ± 0.63 9.60 ± 0.58 6.46 ± 0.68 6.92 ± 0.60 4.89 ± 0.56 (15) A (27) a (13) (25) a (19) A IL P (0) 4.67 ± 0.45 2.67 ± 0.33 3.23 ± 0.49 1.44 ± 0.34 1.47 ± 0.40 (15) A (27) a (13) B (25) a (19) A, B IL I (0) 8.53 ± 0.47 8.48 ± 0.35 9.00 ± 0.51 5.48 ± 0.37 6.00 ± 0.42 (15) A (27) a (13) B (25) a (19) A, B IK R (0) 8.71 ± 0.46 9.42 ± 0.39 9.84 ± 0.48 10.84 ± 0.40 9.23 ± 0.42 (14) (26) a (13) (25) a (17) IK P (0) 1.29 ± 0.28 0.92 ± 0.16 0.92 ± 0.31 0.16 ± 0.16 0.35 ± 0.25 (14) (26) a (13) (25) a (17) IK I (0) 0.29 ± 0.17 7.70 ± 5.50 0.46 ± 0.17 0.00 0.00 (14) (26) (13) (25) (17) Necker D 2 2 0 0 2 D2 2003 D 1 2 0 0 2 D1 2003 HW 2002 HW 2003 IL 19.10 ±0.61 13.50 ± 0.82 18.95 ±0.69 17.25 ± 0.74 14.60 ± 0.72 13.10 ± 0.76 (28) a (16) A (22) b (20) A, B (20) a, b (19) B IK 10.18 ± 0.42 9.63 ± 0.59 9.60 ± 0.47 11.65 ± 0.52 8.60 ± 0.49 7.74 ± 0.54 (28) (16) A (22) (20) A, B (19) (19) B IL R 9.90 ± 0.40 4.31 ± 0.43 9.77 ± 0.45 5.00 ± 0.39 7.35 ± 0.47 4.11 ± 0.40 (28) a (16) (22) b (20) (20) a, b (19) IL P 1.71 ± 0.32 1.88 ± 0.45 2.90 ± 0.36 3.8 ± 0.40 1.50 ± 0.37 0.53 ± 0.41 (28) a (16) A (22) a, b (20) A, B (20) b (19) B IL I 7.5 ± 0.26 7.31 ± 0.40 6.27 ± 0.30 8.45 ± 0.36 5.75 ± 0.31 8.47 ± 0.37 (28) a, b (16) A, B (22) a (20) A (20) b (19) B IK R 9.39 ± 0.40 9.38 ± 0.51 9.05 ± 0.46 10.35 ± 0.46 8.40 ± 0.48 7.53 ± 0.47 (28) (16) A (22) (20) B (19) (19) A, B IK P 0.79 ± 0.16 0.00 0.55 ± 0.18 1.00 ± 0.15 0.10 ± 0.19 0.11 ± 0.16 (28) a (16) A (22) (20) A, B (19) a (19) B IK I 0.00 0.25 ± 0.19 0.00 0.3 ± 0.17 0.00 0.11 ± 0.17 (28) (16) (22) (20) (19) (19) Venoge D 2 2 0 0 2 D2 2003 D 1 2 0 0 2 D1 2003 HW 2002 HW 2003 IL 16.91 ± 0.80 14.55 ± 0.88 17.33 ± 0.79 13.56 ± 0.99 18.42 ± 0.76 (0) (23) (20) (20) (16) (26) IK 16.87 ± 1.44 11.74 ± 0.72 12.12 ± 1.41 9.88 ± 0.78 9.87 ± 1.36 (0) (23) a (19) (24) (16) (26) a IL R 8.17 ± 0.56 5.5 ± 0.65 7.58 ± 0.55 4.56 ± 0.73 8.23 ± 0.53 (0) (23) (20) (24) (16) (26) IL P 1.30 ± 0.34 1.30 ± 0.40 2.24 ± 0.34 1.00 ± 0.44 3.46 ± 0.32 (0) (23) a (20) (24) (16) (26) a
ence of another myxozoan parasite, Sphaerospora sp., in the kidney tubules was not associated with pathological alterations.
IK values of individual fi sh differed between 5 and 41. 52% of the kidneys showed an IK value in the range of 5–10, what is considered to represent normal, undam-aged tissue, 40% of the IK values were in the range of 11–20 showing slight alterations, 4% were moderately altered (IK values between 21–30), 3% showed pro-nounced alterations corresponding to IK values between 31–40 and 1% of the fi sh examined possessed severely altered kidney structures, with IK values higher than 40. Comparing the two years, 2002 and 2003, there was no signifi cant interannual difference of the IK values for all sampling sites.
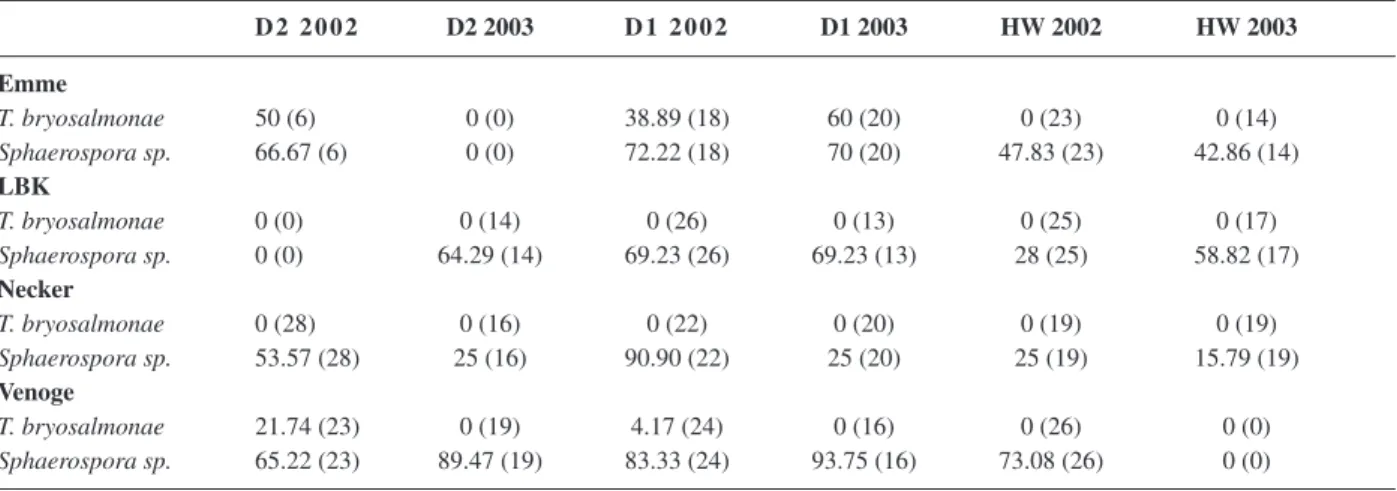
Infection with the PKD-causing parasite,
Tetracapsu-loides bryosalmonae, was a major factor infl uencing
kid-ney histopathological scores. PKD-positive fi sh yielded IK values of 26 at minimum. PKD-diseased trout were found in Emme and Venoge at the two downstream sites D1 and D2, but not in LBK and Necker. In the Emme, PKD prevalence was between 29 and 60%, both in 2002 and 2003. On the contrary, in the Venoge, infected fi sh were observed only in 2002, and then the prevalence was between 4 and 21% (Table 4). Mean IK values at the PKD-positive sites D1 and D2 of Emme and Venoge were elevated (Figs. 5a, b), as a result of a signifi cant increase of mean values of the progressive index, IK- P, and of the infl ammatory index, IK-I, in the downstream reaches of the PKD-positive rivers (Table 3). The increase of mean
IL I 7.43 ± 0.45 7.75 ± 0.58 7.42 ± 0.44 8.00 ± 0.65 6.70 ± 0.42 (0) (23) (20) (24) (16) (26) IK R 12.43 ± 0.61 9.95 ± 0.4 10.63 ± 0.60 9.75 ± 0.46 9.70 ± 0.57 (26) a (0) (23) a (19) (24) (16) (16) IK P 2.96 ± 0.56 1.05 ± 0.24 1.17 ± 0.55 0.00 7.69 ± 0.53 (0) (23) a (19) (24) (16) (26) a IK I 1.48 ± 0.39 0.74 ± 0.35 0.33 ± 0.39 0.13 ± 0.38 0.07 ± 0.37 (0) (23) a (19) (24) (16) (26) a
IL = total liver index, IK = total kidney index, IL R = the regressive liver index, IL P = the progressive liver index, IL R = the infl amma-tory liver index, IK R = the regressive kidney index, IK P = the progressive kidney index, IK I = the infl ammaamma-tory kidney index. Number of sampled fi sh is shown in parentheses. a, b = signifi cant differences of indexes between sampling sites in summer 2002; A, B = signifi cant differences of indexes between sampling sites in summer 2003 (Kruskal-Wallis Test, Bonferroni adjusted; p < 0.05). Table 3. Continued
Venoge D 2 2 0 0 2 D2 2003 D 1 2 0 0 2 D1 2003 HW 2002 HW 2003
Figure 5a. Histological kidney index (IK) of fi shes sampled in 2002 at the downstream (D1, D2) and upstream (HW) sites of the four rivers Emme, Liechtensteiner Binnenkanal (LBK), Necker and Venoge. For details of the sampling sites: see text and tables 1, 2. n-number of sampled fi sh ranged from 6 to 28. Sampling was done in July and August 2002. No samples were available for D2 of LBK. *: signifi cant differences between sampling sites per river (Kruskal-Wallis-Test, Bonferroni adjusted; p < 0.05).
°: outlier.
Figure 5b. Histological kidney index (IK) of fi shes sampled in 2003 at the downstream (D1, D2) and upstream (HW) sites of the four rivers Emme, Liechtensteiner Binnenkanal (LBK), Necker and Venoge. For details of the sampling sites: see text and tables 1, 2. n-number of sampled fi sh ranged from 13 to 20. Sampling was done in July and August 2003. No samples were available for D2 of Emme and HW of Venoge.
*: signifi cant differences between sampling sites per river (Kruskal-Wallis-Test, Bonferroni adjusted; p < 0.05).
°: outlier. 50 40 10 0 Emme LBK Necke r Venoge RIVER SITE D2 D1 HS IK 30 20 50 40 10 0 Emme LBK Nec ker Venoge RIVER SITE D2 D1 HS IK 30 20
values of the kidney indices was much stronger at PKD-positive sites of the Emme than of the Venoge (Fig. 5a, Table 3), but also prevalences were higher at the Emme than at the Venoge (Table 4). Comparing IK values of cor-responding sampling sites across rivers revealed that fi sh from PKD-positive sites showed signifi cantly higher mean IK values than fi sh from the corresponding sites in the PKD-negative rivers. No PKD infections were found in kidneys of fi sh from Necker or LBK (Table 4). In these two rivers, no consistent gradient of mean IK values along the river was obvious (Figs. 5a, b).
Discussion
This study aimed a) to assess by a combination of several indices (EROD activity, organ histopathology, biometri-cal indices) the health status of brown trout from four different streams and from three different sites within each stream, and b) to relate fi sh health to environmental quality as well as brown trout abundance in the streams. The four river basins investigated – Emme, LBK, Necker, Venoge – differ in their abiotic parameters, including the level of anthropogenic impact and habitat quality. Emme and Venoge show elevated chemical pollution and high summer water temperatures, but differ in habitat quality, with poor habitat quality in the Emme and fairly good habitat quality in the Venoge (Schager and Peter, 2004). In contrast to Emme and Venoge, Necker and LBK have low chemical pollution and lower summer water temper-atures. This situation combines in the Necker with an overall good habitat quality, but with poor habitat quality in the LBK. For Emme, Necker and Venoge, water qual-ity impairs in the downstream direction that is from the HW sites over D1 to D2, while in the LBK, poorest water quality is observed at the middle sampling site, D1.
As-suming that water quality may directly infl uence fi sh health, as it has been shown in numerous studies (e.g., Steyermark et al., 1999; Bernet et al., 2000; Mondon et al., 2001; Stentiford et al., 2003; Broeg et al., 2005), we expected a decrease of fi sh health status in the down-stream direction of the rivers, and a lower health status of brown trout from Emme and Venoge compared to that of brown trout from Necker and LBK. This expectation, however, was only partly met.
Hepatic EROD activity has commonly been em-ployed as a biomarker for exposure to substances binding to the arylhydrocarbon receptor (AhR) such as polynuc-lear aromatic hydrocarbons (PAHs), and persistent poly-halogenated aromatic hydrocarbons (PHAHs) such as dioxins, furans and polychlorinated biphenyls (Alten-burger et al., 2003; Whyte et al.; 2000; van der Oost et al., 2003). Exposure to PAHs and PHAHs can have adverse consequences on fi sh health and population growth: these xenobiotics are known to adversely affect early life stage survival, development and reproduction of fi sh (Fair-brother et al., 1999; Rolland, 2000; Altenburger et al., 2003). At fi eld sites with elevated PAH and/or PHAH contamination, such as the Puget Sound or the Great Lakes in Northern America, increased prevalence of toxi-copathic lesions and neoplasms (Myers et al., 1998; Stehr et al.; 2003) as well as population declines have been reported (Monosson, 1997). In the present study, the fi ndings of the EROD measurements point to a generally low or even non-existing exposure of brown trout from the four rivers to AhR ligands. According to the available literature, hepatic EROD activities of non-exposed (con-trol) brown trout are in the range of 30 to 50 pmol/mg/ min (Whyte et al., 2000; Behrens and Segner, 2005). For the present study we therefore take EROD values of less than 50 pmol/mg/min to represent non-contaminated conditions, while EROD values higher than 50 pmol/mg/
Table 4. Prevalence (%) of fi sh with kidney parasites at the downstream (D1, D2) and upstream (HW) sampling sites of the four rivers, Emme, Necker, Liechtensteiner Binnenkanal (LBK) and Venoge. Number of sampled fi sh is shown in parentheses.
D 2 2 0 0 2 D2 2003 D 1 2 0 0 2 D1 2003 HW 2002 HW 2003 Emme T. bryosalmonae 50 (6) 0 (0) 38.89 (18) 60 (20) 0 (23) 0 (14) Sphaerospora sp. 66.67 (6) 0 (0) 72.22 (18) 70 (20) 47.83 (23) 42.86 (14) LBK T. bryosalmonae 0 (0) 0 (14) 0 (26) 0 (13) 0 (25) 0 (17) Sphaerospora sp. 0 (0) 64.29 (14) 69.23 (26) 69.23 (13) 28 (25) 58.82 (17) Necker T. bryosalmonae 0 (28) 0 (16) 0 (22) 0 (20) 0 (19) 0 (19) Sphaerospora sp. 53.57 (28) 25 (16) 90.90 (22) 25 (20) 25 (19) 15.79 (19) Venoge T. bryosalmonae 21.74 (23) 0 (19) 4.17 (24) 0 (16) 0 (26) 0 (0) Sphaerospora sp. 65.22 (23) 89.47 (19) 83.33 (24) 93.75 (16) 73.08 (26) 0 (0)
min may indicate exposure of brown trout to inducing chemicals. Among the sites investigated in this study, only at three sites EROD activities of 50 pmol/mg/min and higher were found: the two downstream sites, D1 and D2, of the LBK, and, in 2002, also the most downstream site, D2, of the Venoge. Brown trout from sites D1 and D2 of the LBK, which are downstream to an STP effl u-ent, possessed elevated liver burdens of polybrominated diphenyl ethers (Hartmann et al., 2006) what may con-tribute to the elevated EROD activities at these sites. In-terestingly, brown trout from the D1 and D2 sites of the LBK not only showed increased hepatic EROD levels but also increased prevalence of hepatic morphological changes, particularly mitoses, nuclear alterations and single cell necrosis. Overall, however, hepatic EROD activities of brown trout did not discriminate among the study sites, neither between the four streams, nor between the sites within a stream. This fi nding indicates that expo-sure of brown trout to CYP1A-activating chemicals was generally low (with few exceptions – see above), and therefore, probably does not contribute to site- or stream-specifi c differences of brown trout health or abundance. Histopathology has been used as a tool to assess health status of wild fi sh in a number of fi eld studies (Teh et al., 1997; Schwaiger, 2001; Handy et. al., 2002; Schmalz et al., 2002; Stentiford et al., 2003). The advan-tage of histopathology as a biomarker lies in its interme-diate location in the hierarchy of biological organization; therefore, it is able to integrate the effects of both abiotic factors such as chemicals or temperature, and of biotic factors such as pathogens on organ function and fi sh health (Adams et al., 1989; Teh et al., 1997; Segner and Braunbeck, 1998; Handy et al., 2002). At the same time, the integrative nature of the histopathological alterations implicates that they often cannot be assigned to a specifi c causative factor, e.g. to a particular toxicant (Meyers and Hendricks, 1985; Hinton et al., 2001; Schmidt-Posthaus et al., 2001). To properly interpret results from histopa-thological evaluations, it is important to realize that a healthy control condition is not characterized by the complete absence of any histopathological traits, but may display moderate alterations such as minor structural disorders or mild infl ammatory reactions (Bernet et al., 2004). A technical disadvantage of histopathology is its qualitative nature. For this reason, Bernet et al. (1999) have developed an evaluation scheme to transform quali-tative histological observations into a semiquantiquali-tative index. In the present study, this approach was applied to study organ histopathology of brown trout from the four river basins.
The semiquantitative evaluation of liver histopatho-logy indicated on average mild to moderate alterations in the fi sh populations from the various study sites, although in individual fi sh, much stronger pathological changes could occur. In the rivers Emme, LBK, and partly in the
Necker, a downstream increase of the histopathological liver index IL was observed, although the severity of liver pathology at the downstream sites remained moderate. The downstream increase of liver integrity occurs in par-allel to the increasing anthropogenic stress. A straightfor-ward correlation of liver histopathological status to any of the abiotic, environmental parameters analysed in this study, however, could not be established. For instance, we found no consistent relation between nature and in-tensity of liver damage and water concentrations of ni-trite or ammonia, which are known to be fi sh-toxic and to induce a range of liver pathological alterations (Smith and Piper, 1975; Carline et al., 1987; Lang et al., 1987; Michael et al., 1987). The failure to demonstrate a rela-tionship between downstream impairment of liver his-topathology and downstream increase of the concentra-tions of specifi c water quality parameters does not necessarily mean that water quality has no effect on liver status, since under the complex exposure situations in the fi eld, with the presence of multiple stressors, straightfor-ward relationships between a single stressor and a bio-logical response may be more the exception than the rule. Establishing cause-effect relationships in fi eld situations can be complicated even for less integrative but more agent-specifi c biological indices such as EROD activity. For instance, for brown trout from two moderately pol-luted small streams in Southern Germany, Behrens and Segner (2005) found no correlation between hepatic EROD activity and exposure to the classical EROD in-ducers, PHAHs and PAHs, but the best chemical predic-tor of EROD activity was copper. Similarly, Adams et al. (1999) reported that the EROD response of fi sh correlat-ed better to environmental concentrations of metals than to PHAH levels. Although metals are not known to be able to induce EROD activity and therefore these statisti-cal correlations obviously have no mechanistic basis, the environmental metal concentrations may be indicative of an enhanced overall contamination status including un-known EROD-inducing substances at the study sites. In this context, the importance of mixture effects for bio-logical responses has to be emphasized, including combi-nation of chemicals (e.g., Silva et al., 2002) as well as combinations between chemicals and physical or bio-logical stressors. For instance, the presence of pathogens can modulate the organism response to chemicals, while chemical exposure may infl uence the organism resistance to pathogens (e.g. Schwaiger et al., 1997; Carlson and Zelikoff, 2002; Kiesecker, 2002).
In the case of the kidney, histopathological examina-tions were able to identify the presence of the parasitic disease, PKD, as a major causative factor causing down-stream impairment of kidney condition. The infected kidneys displayed typical morphological characteristics of this disease such as granulomatous nephritis, accom-panied by degenerative and necrotic changes of
hemato-poietic cells and of excretory renal tissue (Ellis et al., 1985). We consider the PKD infection to be responsible for the downstream increase of IK values in Emme and Venoge, since IK values of fi sh from the PKD-free rivers, Necker and LBK, show no signifi cant downstream in-crease. It is known that PKD can result in high mortalities among brown trout populations, particularly during fi rst infection in young-of-the-years (Hedrick et al., 1993), and population modelling has confi rmed the potential ad-verse impact of PKD on recruitment of brown trout popu-lations (Borsuk et al., 2006). Therefore, this disease may well contribute to the low fi sh biomass found at the PKD-positive downstream sites of the Emme and Venoge (Ta-ble 2). Although the results from the present study can not be conclusive with respect to the possible role of PKD in impairing brown trout populations, since only a small number of rivers/sites were studied, the fact that this dis-ease is widespread in brown trout populations of Swiss rivers (Wahli et al., 2002; 2006), and the signifcant cor-relation between the abundance of young-of-the-year trout in Swiss rivers and the presence of PKD, as ob-served on a nation-wide basis in the project “Fischnetz” (Fischnetz, 2004) argue for PKD as a major factor in the catch decline of brown trout in Switzerland (Burkhardt-Holm et al., 2005; 2006).
Fish biometrical indices - CF, HSI – showed site-spe-cifi c differences. The increase of CF values from the HS to the downstream sites, as observed at least in Emme and LBK, might be explained by a higher availability of food due to increased eutrophication and increased temperature in the lower stretches of the rivers. As long as the pollution stress is moderate, the CF values may be more dependent on the availability of nutrients in water than to water pol-lution status or other stress factors (Huuskonen and Lind-stroem-Seppae, 1995). The same explanation as for CF may apply to the downstream increase of HSI, although the latter might also refl ect an adaptive response to stress (Mayer et al., 1992). The low correlation coeffi cient be-tween HSI and CF (r = 0.3) indicates that the two param-eters are infl uenced by at least partly different factors.
Overall, the results from the various indices suggest that brown trout at the downstream sites, D1 and D2, show poorer health status than trout from the upstream sites, HW, although the upstream-downstream decrease is not expressed in every case, and although the magnitude of the upstream-downstream change of health indices is generally moderate. The conclusion on a decreasing health status to-wards the lower reaches of the four rivers is based mainly on the liver and kidney histopathological fi ndings. Despite the fact that the four rivers differ in their hydrological, morphological and chemical parameters, the between-stream differences of the histopathological scores are mod-erate and rarely signifi cant. The fi ndings on within- and between-stream differences of health indices are fairly consistent among the two study periods, 2002 and 2003.
How does the actual fi sh health status correlate to the actual brown trout population status (estimated as brown trout biomass – Table 3) and the previous changes of brown trout catches in the four river systems? Changes in actual trout biomass and in actual trout health status seem to correlate at a fi rst glance, i.e. biomass is lowest at the downstream sites where brown trout generally exhibited poorer health status. However, care must be taken not to over-interpret such relations, particularly since it is not clear which level of impairment in fi sh health status translates into which level of population decline, and whether the reduction of health status as observed at the downstream sites is severe enough to signifi cantly affect population growth. Further, it must not be overlooked that there existed also several misfi ts between population status and health status. For instance, in the Venoge, population at the HW site showed high biomass but poor liver structure. A further caveat on over-interpreting the role of fi sh health in determining brown trout abundance comes from comparing fi sh health status in the four streams to brown trout catch decline as recorded for these rivers over the last 10 to 20 years. While magnitudes of catch decline differed from approximately 25% (Venoge) to 90% (LBK), the majority of health indices showed no signifi cant between-stream differences, except for the PKD-associated kidney lesions. In conclusion, the results of this study point to a general association of within-stream gradients of water quality, disease (PKD) preva-lence, brown trout health and brown trout biomass, how-ever, the available database is not suffi cient to establish a correlation between brown health status, as actually measured in the four rivers, and level of decline of brown trout catches as experienced during the last 10–20 years in those streams.
Acknowledgments
We thank the Cantonal Fisheries Authorities for their support in sampling the fi sh. Thanks go to Dr. A. Peter and Dr. E. Schager (Eawag, Kastanienbaum) for provid-ing the population data and water temperature data. For their support in the fi sh sampling and fi eld work, we are grateful to the Fisheries Authorities of the Can-tones of Berne, Thurgau, Vaud, and the Principality of Liechtenstein, Dr. A. Peter and Dr. E. Schager (Eawag, Kastanienbaum), Oliver Körner, University of Basel, and Farid Firouzbakhsh (Department of Aquatic Ani-mal Health, University of Tehran, Iran). Further, we are grateful to the Water and Soil Protection Labora-tory of the Cantons Berne and Vaud and to the Environ-mental Protection Offi ces of the Canton St.Gallen and of Lichtenstein for water analysis. This study was fi nancially supported by a grant of Hoffmann-La Roche AG Basel.
References
Adams, S. M., K. L. Shepard, J. M. S. Greeley, B. D. Jimenez, M. G. Ryon, L. R. Shugart and J. F. McCarthy, 1989. The use of bioin-dicators for assessing the effects of pollutant stress on fi sh. Mar. Environ. Res. 28: 459–464.
Adams, S. M., M. S. Bevelhimer, M. S. Greeley, D. A. Levine and S. J. Teh, 1999. Ecological risk assessment in a large river reser-voir: 6. Bioindicators of fi sh population health. Environ. Toxi-col. Chem. 18: 628–640. a
Altenburger, R., H. Segner and R. van der Oost, 2003. Biomarkers and PAHs – prospects for the assessment of exposure and ef-fects in aquatic systems. In: P.E.T. Douben (ed.), PAHs: an Eco-toxicological Perspective, John Wiley & Sons Ltd., London, pp. 297–328.
Au, D. W. T., 2004. The application of histo-cytopathological bio-markers in marine pollution monitoring: a review. Mar. Poll. Bull. 48: 814–834.
Behrens, A. and H. Segner, 2001. Hepatic biotransformation en-zymes of fi sh exposed to non-point source pollution in small streams. J. Aquat. Ecosyst. Stress Recov. 8: 281–297.
Behrens, A. and H. Segner, 2005. Cytochrome P4501A induction in brown trout exposed to small streams of an urbanized area: re-sults of a fi ve-year-study. Environ. Poll. 136: 231–242. Bernet, D., H. Schmidt, W. Meier, P. Burkhardt-Holm and T. Wahli,
1999. Histopathology in fi sh: proposal for a protocol to assess aquatic pollution. J. Fish Dis. 22: 25–34.
Bernet, D., H. Schmidt-Posthaus, T. Wahli and P. Burkhardt-Holm, 2000. Effects of wastewater on fi sh health: an integrated ap-proach to biomarker responses in brown trout (Salmo trutta L.). J. Aquat. Ecosyst. Recov. 8: 143–151.
Bernet, D., H. Schmidt-Posthaus, T. Wahli and P. Burkhardt-Holm, 2004. Evaluation of two monitoring approaches to assess effects of waste water disposal on histological alterations in fi sh. Hydro-biologia 524: 53–66.
Borsuk, M. E., P. Reichert, A. Peter, E. Schager and P. Burkhardt-Holm, 2006. Assessing the decline of brown trout (Salmo trutta) in Swiss rivers using a Bayesian probability network. Ecologi-cal Modelling, 192: 224–244.
Broeg, K., H. v. Westernhagen, S. Zander, W. Körting and A. Koeh-ler, 2005. The “bioeffect assessment index” (BAI). A concept for the quantifi cation of effects of marine pollution by an inte-grated biomarker approach. Mar. Poll. Bull. 50: 495–503 Burkhardt-Holm, P., A. Peter and H. Segner, 2002. Decline of fi sh
catch in Switzerland. The project Fishnet – a balance between analysis and synthesis. Aquat. Sci. 64: 36–54.
Burkhardt-Holm, P., W. Giger, H. Güttinger, A. Peter, K. Scheurer, M.J.F. Suter, U. Ochsenbein, H. Segner and E. Staub, 2005. Where have all the fi sh gone? The reasons why fi sh catches in Swiss rivers are declining. Environ. Sci. Technol. 39: 441A– 447A.
Burkhardt-Holm, P. and K. Scheurer, 2007. Application of weight-of-evidence approach to assess the decline of brown trout
(Sal-mo trutta) in Swiss rivers. Aquat. Sci., 69(1): DOI 10.1007/
s00027-006-0841-6.
Carline, R. F., A. J. Benson and H. Rotenbacher, 1987. Long-term effects of treated domestic wastewater on brown trout. Water Res. 21: 1409–1415.
Carlson, E. A. and J. T. Zelikoff, 2002. Exposure of Japanese meda-ka (Oryzias latipes) to benzo(a)pyrene suppresses immune function and host resistance against bacterial challenge. Aquat. Toxicol. 56: 289–301.
Chavin, W., 1973. Teleostean endocrine and para-endocrine altera-tions of utility in environmental studies. In: W. Chavin (ed.), Responses of Fish to Environmental Change, Thomas, Spring-fi eld, IL, pp. 199–238.
Downes, B. J., L. A. Barmuta, P. G. Fairweather, D. P. Faith, M. J. Keough, P. S. Lake, B. D. Mapstone and G. P. Quinn, 2002. Monitoring Ecological Impacts, Cambridge University press, Cambridge.
Ellis, A. E., A. H. McVicar, and A. L. S. Murano, 1985. Proliferative kidney disease in brown trout, Salmo trutta L., and Atlantic salmon Salmo salar L., parr: histopathological and epidemio-logical observations. J. Fish Dis. 8: 197–208.
Fairbrother, A., G. T. Ankley, L. S. Birnbaum, S. P. Bradbury, B. Francis, L. E. Gray, D. Hinton, L. I. Johnson, R. E. Peterson and G. van der Kraak, 1999. Reproductive and developmental toxi-cology of contaminants in oviparous animals. In: R.T. DiGiulio and D. E. Tillitt (eds.), Reproductive and Developmental Effects of Contaminants in Oviparous Vertebrates, SETAC Press, Pen-sacola, pp. 283–362.
Fischnetz, 2004. Final Report of Project Fischnetz (in German). Eawag, Dübendorf, Switzerland.
Götz, C., N. Chevre, H. Singer and S. Müller, 2003. Emme, Necker, Liechtensteiner Binnenkanal, Venoge: Gebietscharakterisie-rung, Pestizidmessungen, Toxizitätsabschätzung. Fischnetz Teilprojekt. Report-Nr. 01/15. Eawag, Dübendorf, Switzerland. GSchV, 1998. Gewässerschutzverodnung, 1998, Bern, SR 814.201,
AS 1998 2863. Council of Ministers, Switzerland.
Handy, R. D., T. Runnalls and P. M. Russell, 2002. Histopathologic biomarkers in three spined sticklebacks, Gasterosteus
aculea-tus, from several rivers in Southern England that meet the
Freshwater Fisheries Directive. Ecotoxicology 11: 467–479. Hartmann, P. C., P. Burkhardt-Holm, W. Giger, 2006.
Polybromi-nated diphenyl ether fl ame retardant in brown trout bile and liver from Swiss rivers. Environ. Poll., in press.
Hedrick, R. P., E. MacConnel, and P. de Kinkelin, 1993. Proliferative kidney disease of salmonids. Ann. Rev. Fish Dis. 3: 277–290. Hinton, D. E., P. C. Baumann, G. R. Gardner, W. E. Hawkins, J. D.
Hendricks, R. A. Murchelano and M. S. Okihiro, 1992. His-topathologic biomarkers. In: R. J. Hugget, R. A. Kimerle, M. P. Mehrle and H. L. Bergman (eds.), Biomarkers: Biochemical, Physiological and Histological Markers of Anthropogenic Stress, SETAC Publication. Lewis Publishers, pp. 155–209. Hinton, D. E., H. Segner and T. Braunbeck, 2001. Toxic responses
of the liver. In: D. Schlenk, W. H. Benson (eds.). Target Organ Toxicity in Marine and Freshwater Teleosts, Taylor & Francis, London, pp. 224–268.
Huuskonen, S. and P. Lindstroem-Seppae, 1995. Hepatic cyto-chrome P4501A and other biotransformation activities in perch (Perca fl uviatilis): The effects of unbleached pulp mill effl uents. Aquat. Toxicol. 31: 27–41.
Kiesecker, J. M., 2002. Synergism between trematode infection and pesticide exposure: a link to amphibian limb deformities in na-ture? Proc. Natl. Acad. Sci. USA 99: 9900–9904.
Lang, T., G. Peters, R. Hoffmann and E. Meyer, 1987. Experimental investigations on the toxicity of ammonia: effects on ventilation frequency, growth, epidermal mucous cells, and gill structure of rainbow trout, Salmo gairdneri. Dis. Aquat. Org. 3: 159–165. Mayer, F. L., D. J. Versteeg, M. J. McKee, L. C. Folmar, R. L.
Gra-ney, D. C. McCume, B. A. Rattner, 1992. Metabolic products as biomarkers. In: R. J. Huggett, R. A. Kimerly, P. M. Mehrle, H. L. Bergman (eds.), Biomarkers: Biochemical, Physiological and Histological Markers of Anthropogenic Stress, Lewis Pub-lishers, Chelsea, MI, USA, pp. 5–86.
Meyers, T. R. and J. D.Hendricks, 1985. Histopathology. In: G. M. Rand, S. R. Petrocelli (eds.), Fundamentals of Aquatic Toxicol-ogy, Hemisphere Publishing Co., New York, pp. 283–331. Michael, M. I., A. M. Hilmy, N. A. El-Domiaty and K. Wershana,
1987. Serum transaminases activity and histopathological changes in Clarias lazera chronically exposed to nitrite. Comp. Biochem. Physiol. 86C: 255–262.
Mondon, J. A., Duda, S. and B. F. Nowak, 2001. Histological, growth, and 7-ethoxy-resorufi n-O-deethylase (EROD) activity responses of greenback fl ounder Rhombosolea tapirina to con-taminated marine sediment and diet. Aquat. Toxicol. 54: 231– 247.
Monosson, E., 1997. Reproductive and developmental effects of contaminants in fi sh populations: establishing cause and effect. In: R.M. Rolland, M. Gilbertson, and R.E. Peterson (eds.),