Shape and Core-Excited Resonances in Thiophene
Published as part of The Journal of Physical Chemistry virtual special issue “Manuel Yáñez and Otilia Mó
Festschrift”.
Alexandra Loupas,
†,‡Khrystyna Regeta,
¶,§Michael Allan,
¶and Jimena D. Gorfinkiel
*
,‡†Laboratório de Colisões Atómicas e Moleculares, CEFITEC, Departamento de Física, Faculdade de Ciências e Tecnologia,
Universidade Nova de Lisboa, Campus de Caparica, Lisboa, 2829-516 Portugal
‡School of Physical Sciences, The Open University, Walton Hall, Milton Keynes MK7 6AA, United Kingdom
¶Department of Chemistry, University of Fribourg, Fribourg 1700, Switzerland
*
S Supporting InformationABSTRACT: We present a comprehensive study of resonance formation in electron collisions with thiophene. Detailed cal-culations have been performed using the ab initio R-matrix
method. Absolute differential cross sections for electron impact
excitation up to 18 eV and for two scattering angles, 90 and
135°, have been measured. Agreement between the calculated
and measured experimental cross sections is very good. Three
shape resonances previously described, two of π* character
and oneσ*, as well as a number of resonances of core-excited
or mixed character are identified and characterized in the
cal-culations. The measured cross sections provide experimental confirmation for a number of the core-excited resonances. The link
between these resonances and prior DEA experiments is discussed.
■
INTRODUCTIONThe impact of low-energy electrons is well-known to cause bond
cleavages in DNA.1 This breakup is initiated through the
for-mation of a negative ion transient state, commonly known as a resonance. Depending on its characteristics, this anionic state will either decay via autodetachment or lead to dissociation and the formation of two or more fragments, one of them negatively charged, during a process known as dissociative electron
attach-ment (DEA).2 Free and presolvated electrons are formed in
large quantities when radiation interacts with biological matter.3
Therefore, understanding DEA and resonance formation is crucial to the interpretation of how low-energy electrons induce DNA damage: a lot of work has been performed, both theoretical and experimental, especially on DNA constituents (in particular nucleobases), some amino acids, radiosensitizers and model
molecules.4,5
This work presents the study of low-energy electron collisions
with thiophene (C4H4S), one of the most used building blocks in
anti-inflammatory drugs.6Thiophene is a prototypical, fully
con-jugated, heterocyclic molecule that contains one heavy and highly polarizable sulfur atom. Thiophene is also the main unit of several types of materials, such as polythiophene. When properly doped, polythiophene is conductive and has found application in electrochromic displays, electro-optic devices, protection
against photocorrosion, and energy storage.7In other materials,
thiophene’s presence confers various important properties,
making them promising as photochromatic molecular switches,8
organic semiconductors,9solar cells,10light-emitting diodes, and
field-effect transistors.11
As all of these applications involve
electron transfer, understanding thiophene’s electronic structure
and electron-induced processes is of great relevance.
Electron collisions with thiophene have been previously studied at both theoretical and experimental levels. The only
DEA study was performed by Muftakhov et al.,12who recorded
mass spectra in the gas phase in the energy range of 0−12 eV.
They interpreted the peaks in these spectra as corresponding to seven resonant states mainly of Feshbach character, a couple of which lie above the ionization threshold and therefore are expected to correspond to core-excited resonances in which the electron is excited from a deeply bound orbital.
Asmis13measured electron energy loss spectra (EELS) for
vibrational excitation and found three resonances at 1.27, 2.83,
and 5.5 eV. He assigned thefirst two resonances as one-particle
(i.e., shape)π* resonances and the last one as a σ* resonance.
(A summary of the EELS can be found here:http://homeweb.
unifr.ch/allanm/pub/ma/dir_allan/thiophene_EELS.PDF.)
Modelli and Burrow14obtained electron transmission spectra
(ETS) for thiophene below≃4.5 eV. They found two intense
resonances at 1.15 and 2.63 eV, associated with electron capture
into the two lowest emptyπ* molecular orbitals, of b1and a2
symmetry. They stated that the signal corresponding to an
expectedσ* resonance (scaled virtual orbital energies in their
http://doc.rero.ch
Published in "The Journal of Physical Chemistry A 122(4): 1146–1155, 2018"
which should be cited to refer to this work.
work put the σ* resonance at around 2−2.1 eV) is probably masked by overlap with the high-energy tail of the lower, more
intenseπ* resonance.
Hedhili et al.7 investigated electron stimulated desorption
(ESD) of anions from multilayer thiophene condensed on a polycrystalline platinum substrate. The yield functions that they obtained show that anions are desorbed both by dissociative electron attachment, with peaks observed at 9.5, 11, and 16 eV, and for higher energies, via dipolar dissociation.
From the theoretical point of view, two methods have been been applied to the study of electron scattering from thiophene at
low energies. First, da Costa et al.15reported electron impact
integral elastic, momentum transfer, and differential cross
sec-tions calculated with the Schwinger multichannel method with pseudopotentials (SMCPP) for energies ranging from 0.5 to
6 eV. They identified two π* and a σ* shape resonances, the latter
with a strong d-wave character. Vinodkumar et al.16used the
R-matrix method (through the QUANTEMOL-N interface) for low-energy calculations and the Spherical Complex Optical Potential formalism for intermediate to high energy. Their R-matrix calculations are similar to those presented in this paper;
however, their results (see later) are very different and show a
number of inconsistencies. No work has focused on core-excited
resonances. Finally, we note that Mozejko et al.17calculated
inte-gral elastic and ionization cross sections at intermediate and high electron impact energies using the additivity rule approximation and the binary-encounter Bethe approach.
In this work, we have investigated resonance formation in thiophene both experimentally and computationally. We have
used the R-matrix method,18as implemented in the UKRmol
suite,19 to investigate electron collisions with thiophene in its
equilibrium geometry. We have performed the calculations at
different levels of complexity to identify and characterize both
shape and core-excited resonances. We have also determined the
excitation function (i.e., angular differential cross sections as a
function of incident electron energy for a specific energy loss) by
means of EELS. Both the calculated data and the detailed excita-tion funcexcita-tions show the presence of a number of mixed and core-excited resonances, some of which can be correlated with peaks
in DEA anion yields.12
■
THEORYR-Matrix Method. We performed our scattering calculations
within thefixed-nuclei approximation, that is, keeping the nuclei
fixed at the ground state equilibrium geometry of the molecule.
The R-matrix method has been described in detail elsewhere;18,20
therefore, we present only a brief description here.
The basic idea of this method is the division of the con
figura-tion space into two regions, separated by a sphere of radiusa, the
R-matrix sphere. In the inner region, correlation and exchange
effects between all electrons play a crucial role and have to be
considered. In the outer region, exchange between the scattering electron and the electrons of the target system can be neglected. It is crucial for the applicability of the method that the radius of the R-matrix sphere be chosen in a way that it contains the charge
densities of the relevant target electronic states and theN + 1
electron functionsχidefined below.
In the inner region, we describe the system using a set of basis
functionsΨkof the form
∑ ∑
σ∑
χ Ψ = Φ ̂ + = = + + + + = + r u r r a b x x ( ; ; ) ( ) ( ) k i n j n i N N N ij N N ijk i m i N ik 1 1 1 1 1 1 1 1 c ( (1)where ( is the antysimmetrization operator;Φiare the wave
functions describing the target electronic states, and xNand xN+1
represent spin and space coordinates of allN and N + 1 electrons,
respectively.σN+1stands for the spin of the (N + 1)th
scatter-ing electron, and rN+1 andr̂N+1 represent its radial and
angu-lar coordinates, respectively. The functions +
+ u (r r ) ij N N 1 1 describe the radial part of the wave function of the scattering electron, while
the L2integrable functionsχiare necessary for a good description
of the short-range polarization-correlation effects. Finally, the
coefficients aijkandbikare determined by the requirement that
the functionsΨkdiagonalize, in the inner region, the electronic
nonrelativistic Hermitian Hamiltonian of the (N + 1)-electron
system.20
In the outer region, the wave function describing the scattering electron is approximated by a single-center, partial wave expan-sion, reducing drastically the computational cost. Having obtained
the basis functionsΨk, the R-matrix is built and propagated to the
asymptotic region, where the K-matrix is obtained. From the K-matrix, one can determine the S-matrix and, from it, the cross sections. Both K- and S-matrices can be used to identify and characterize resonances.
In our study, we included partial waves up tol = 4 (and tested,
for the smaller calculations, l = 5). Inclusion of higher partial
waves increases the computational cost of the calculations
sig-nificantly. Additionally, this partial wave expansion does not
converge in thefixed-nuclei approximation for polar molecules.
This lack of convergence is usually circumvented by means of a
Born correction.21 However, given the relatively small dipole
moment of thiophene (see below), we have not included this
correction: it only affects dipole-allowed transitions, and the
effect for electronic excitation in the energy range of interest
has been shown to be small (around 5%) even for molecules
with a much larger dipole moment (for example, pyridine22with
μ = 2.33 D). The effect of not including the correction will be to underestimate the elastic and total cross sections, most visibly at low energies, and the cross sections for excitation into singlet states at higher energies.
Angular differential cross sections for electronic excitation are
calculated following a well-established methodology based on
the adiabatic nuclei approximation23,24using a program
devel-oped by Z. Mašín. The approach uses the T-matrix (trivially
obtained from the S-matrix) calculated with the R-matrix method.
Different levels of approximation can be employed in
scat-tering calculations, and these are determined by the choice of
target electronic states (how many) and the type of the L2
functions included in theeq 1. The Static-Exchange (SE) and
Static-Exchange plus Polarization (SEP) approximations use a
Hartree−Fock description of the ground electronic state of the
target, the only state included in the calculation. These approxi-mations are capable of describing resonances in which the target molecule remains in the ground state, known as shape resonances. In the SEP approximation, the molecule is allowed to be polarized
by the incoming electron. This effect is modeled by including the
appropriate L2configurations
χ: (core) (valence) − (virtual)
i Nc N Nc 1 (2)
χ: (core) (valence) − − (virtual)
i Nc N N 1c 2 (3)
where the core orbitals are always doubly occupied byNc
elec-trons. The valence space is defined here as those orbitals occupied
in the ground state configuration that are not core orbitals.
Single excitations from the valence to a selected number of virtual orbitals (VOs), which are also available for the incoming elec-tron, are allowed. Due to the presence of these single excitations from the valence space to a VO, the SEP model can sometimes describe (poorly) core-excited resonances.
The Close-Coupling (CC) method is necessary for the accurate description of core-excited resonances, i.e., resonances in which the electron excites the molecule as it attaches itself to it. In this case, wave functions corresponding to a number of excited states
of the target are included ineq 1. These are usually described at
the Complete Active Space (CAS) level. Here, the L2con
figura-tions take the following form χ: (core) (CAS) − +
i Nd N N 1d (4)
χ: (core) (CAS) − (virtual)
i Nd N Nd 1 (5)
where the active space (CAS) includes both occupied and
unoccupied orbitals of the ground state configuration. Therefore,
the virtual space is different from that of the SEP L2 con
fig-urations; similarly, more orbitals are normally treated as core orbitals here to keep the size of the calculation feasible.
Whereas the choice of active space is guided by conventional computational chemistry considerations and the number of excited states to be included at the CC level is determined by the range of scattering energies to be studied, choosing how many
VOs to include in the above configurations is not
straightfor-ward: not enough VOs will lead to a poor description of
polar-ization effects. Too many VOs can lead to overcorrelation of the
N + 1 wave functions; in this case, resonances will appear lower in energy than they physically are. As we will see later, the choice of VOs has not been straightforward in this work.
Time Delay Analysis. The main focus of this work is
resonance identification and characterization. One common way
tofind resonances is to look at the cross sections, although this
approach is not always reliable; peaks corresponding to physical resonances may be masked by other resonances or the non resonant contribution to the scattering processes, and features that look like peaks may not actually correspond to resonances.
Another quantity that allows resonance identification is the
eigenphase sum, obtained from diagonalizing the K-matrix. It was
shown by Hazi25that an isolated resonance manifests itself as a
characteristic jump of approximatelyπ in the eigenphase sum in
the energy region centered around the position of the resonance.
However, resonances may also be difficult to identify in the
eigenphase sum when they overlap or the nonresonant
contribu-tion is significant.26
Analysis of the time delay enables the unambiguous identi
fica-tion of resonances even in cases in which the eigenphase sum does not show the typical resonant behavior. A description of the method and its applications as well as its advantages over the conventional eigenphase sum analysis have been reviewed in
detail before.27
We use the definition of the time delay as formulated by
Smith:28the Q-matrix, the time delay matrix, at a given energy is
calculated directly from the S-matrix
= ℏ E
E Q( ) i S Sd
d (6)
The process of searching for resonances involves analysis of the positive eigenvalues (time delays) and associated eigenvec-tors of the Q-matrix for each energy. Resonances appear as a Lorentzian peak in these eigenvalues. Those time delays much
larger than ℏ/E can be interpreted as arising from resonant
processes and can befitted using
δ ℏΓ − α + Γα α + ℏ E E E ( ) ( /2) 2 d d 2 2 bg (7)
where Eα and Γα are, respectively, the position and width of
resonance α and δbg is the background contribution to the
eigenphase sum, weakly dependent on energy.
The analysis of the time delay also allows us to characterize the
resonances in terms of their parent state(s). The square of thejth
coefficient of the eigenvectors of Q(E) corresponding to a
resonance (|cj|2) is equal to the branching ratio, which gives the
probability of decay of a metastable state into thejth channel and,
consequently, can be used to determine the parent states of shape and core-excited shape resonances.
In this work, we used the inspection of the time delay to identify and characterize all resonances.
■
EXPERIMENTAL APPROACHEELS and measurements of energy dependence spectra (also called excitation functions) were performed using a well-tested
spectrometer with hemispherical analyzers29,30and employing
procedures used previously to study electron scattering from
targets like furan31and pyrimidine.32,33The spectrometer uses
hemi-spherical analyzers to improve resolution. The electron beam current
was 300−700 pA. The energy of the incident electrons was
cal-ibrated on the 19.365 eV2S resonance in helium34
and is accurate
to within±10 meV. The sensitivity of the instrument depends on
the electron energies. This effect, expressed as the “instrumental
response function”, was quantified on elastic scattering in He; all
of our spectra were corrected as previously described.29,30The
technicalities of“tuning” the instrument and of determining the
response functions have been described in previous work,29,30
particularly on N2.
35
The absolute values of the excitation functions were deter-mined by comparing the areas under the elastic peak and under the
electronic excitation bands of interest, as previously described.31
The required absolute values of the elastic cross sections
(pre-sented in theSupporting Information) were determined by the
relativeflow technique as described by Nickel et al.36using, as a
reference, the theoretical helium elastic cross sections of Nesbet.37
The confidence limit is ±15% for the elastic cross sections and
±25% for the inelastic cross sections and excitation functions.
■
COMPUTATIONAL DETAILSThiophene, C4H4S, is a planar molecule that belongs to theC2v
point group. It contains 44 electrons and has a dipole moment of
0.52 D.38Its experimentally determined polarizability39is 60.8a03,
and its ionization energy is 8.86 eV.40Thiophene is an
asym-metric top, and itsfirst electronic excitation threshold is around
3.7 eV.13,41−43
In our calculations, we have used the molecular geometry listed on the NIST Web site, calculated at the MP2 level using the
cc-pVDZ basis set.40
Target Model. The electronic excited states of thiophene have been studied by a number of experimental and theoretical
groups. Flicker et al.43performed electron impact experiments at
scattering angles from 0 to 80° and impact energies of 30 and
50 eV to study the lowest singlet−triplet transitions of thiophene.
Palmer et al.41investigated the VUV and EELS spectra of thiophene
and assigned the bands by means of high-level multireference
multiroot CI studies, with several basis sets. Haberkern et al.42
measured high-resolution EELS spectra in the range of the
low-lying singlet−triplet excitations. In combination with ab initio
calculations, the spectral structures were assigned and adiabatic
transition energies were determined. Salzmann et al.44used
time-dependent Kohn−Sham density functional theory combined
with a density functional/multireference configuration
inter-action method (DFT/MRCI) to explore the ground and low-lying electronically excited states of thiophene in order to explain the ultrafast decay of low-lying vibrational levels of the lowest
singlet state, observed by time-resolved pump−probe
femto-second multiphoton ionization spectroscopy.45Holland et al.46
used synchrotron radiation-based Fourier transform spectrosco-py to study the excited states of thiophene. A highly resolved photoabsorption spectrum was measured between 5 and 12.5 eV, combined with high-level ab initio calculations that used the second-order algebraic-diagrammatic construction polarization propagation approach and the equation-of-motion coupled-cluster (EOM-CC) method at the CCSD and CC3 levels to assign the
spectrum. Nakatsuji et al.47used the symmetry-adapted cluster
con-figuration interaction (SAC-CI) method and a basis set augmented
with diffuse Rydberg functions to describe a large number of
Rydberg states. Merchán et al.48studied the electronic spectrum
of thiophene using multiconfiguration second-order
perturba-tion theory and the extended ANO basis set. Their results were
used to assign the experimental spectrum below 8 eV. Kleinschmidt
et al.49used SPOCK (a code that calculates spin−orbit matrix
ele-ments in the one-center mean-field approximation for multireference
CI wave functions) and the DFT/MRCI approach to provided excitation energies in good agreement with the experiments.
For our calculations, we tested two different basis sets: cc-pVDZ
and 6-311G**. Because, as prior work identified, thiophene
pos-sesses a significant number of low-lying Rydberg states, the
6-311G** basis set produced results closer to those of experiments.
Therefore, throughout this work, we present results obtained with this basis set. We note, however, that our calculations do not describe the Rydberg states well.
Hartree−Fock SCF (HF) and state-averaged CASSCF orbitals
were generated using MOLPRO50and used in the scattering
calculations. In the state-averaged CASSCF calculations, we used the active space of (10,9) (10 electrons distributed among 9 orbitals)
and included in our state-averaging seven states: 1−21A1,
1−31
B1, 11B2, 11A2. The ground state configuration of thiophene
is 1a122a121b223a122b224a123b225a121b126a217a124b228a125b229a126b2210a127b222b12
-11a123b121a22. The active space comprised the orbitals 11−12a1,
7−8b1, 2−4b2, and 1−2a2. The ground state energies and dipole
moments obtained are, for the HF and CASSCF calculations, −551.343 and −551.428 hartree and 0.722 and 0.549 D.
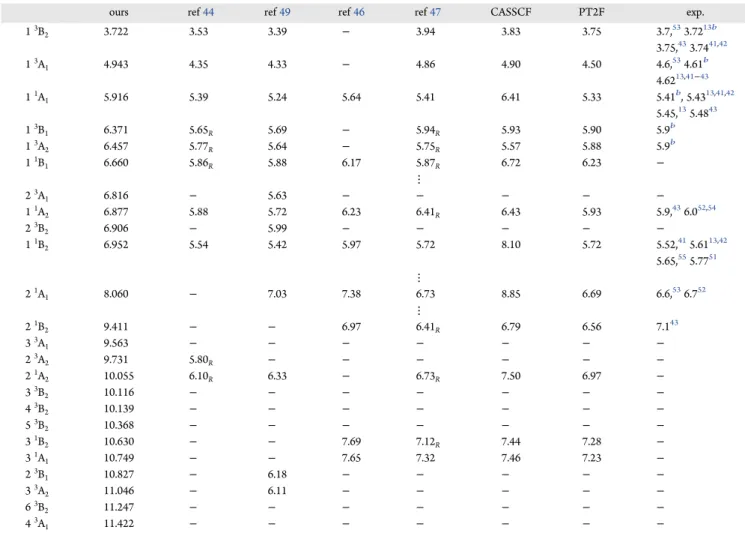
Table 1. Calculated Vertical Excitation Thresholds (in eV) of the Electronic States Included in the CC Calculationa
ours ref44 ref49 ref46 ref47 CASSCF PT2F exp.
13B 2 3.722 3.53 3.39 − 3.94 3.83 3.75 3.7,533.7213b 3.75,433.7441,42 13A 1 4.943 4.35 4.33 − 4.86 4.90 4.50 4.6,534.61b 4.6213,41−43 11A 1 5.916 5.39 5.24 5.64 5.41 6.41 5.33 5.41b, 5.4313,41,42 5.45,135.4843 13B 1 6.371 5.65R 5.69 − 5.94R 5.93 5.90 5.9b 13A 2 6.457 5.77R 5.64 − 5.75R 5.57 5.88 5.9b 11B 1 6.660 5.86R 5.88 6.17 5.87R 6.72 6.23 − ⋮ 23A 1 6.816 − 5.63 − − − − − 11A 2 6.877 5.88 5.72 6.23 6.41R 6.43 5.93 5.9,436.052,54 23B 2 6.906 − 5.99 − − − − − 11B 2 6.952 5.54 5.42 5.97 5.72 8.10 5.72 5.52,415.6113,42 5.65,555.7751 ⋮ 21A 1 8.060 − 7.03 7.38 6.73 8.85 6.69 6.6,536.752 ⋮ 21B 2 9.411 − − 6.97 6.41R 6.79 6.56 7.143 33A 1 9.563 − − − − − − − 23A 2 9.731 5.80R − − − − − − 21A 2 10.055 6.10R 6.33 − 6.73R 7.50 6.97 − 33B 2 10.116 − − − − − − − 43B 2 10.139 − − − − − − − 53B 2 10.368 − − − − − − − 31B 2 10.630 − − 7.69 7.12R 7.44 7.28 − 31A 1 10.749 − − 7.65 7.32 7.46 7.23 − 23B 1 10.827 − 6.18 − − − − − 33A 2 11.046 − 6.11 − − − − − 63B 2 11.247 − − − − − − − 43A1 11.422 − − − − − − −
aPrevious results are from calculations, Salzmann et al.,44
Kleinschmidt et al.,49 Holland et al.,46 Nakatsuji et al.,47 and Merchán et al.48 (both CASSCF and PT2 results are presented); experiments, Moodie et al.,51Zauli et al.,52Flicker et al.,43van Veen et al.,53Asmis,13Haberkern et al.,42and Veszpremi et al..54The energies labeled with anR correspond to Rydberg states. The vertical dots (⋮) indicate that several other states are present in that calculation in this energy range.bThe energies of the states identified in our EELS spectra.
Table 1lists the vertical excitation energies of the 25 states (ground state + 24 excited states) included in the CC calculation together with the most relevant prior theoretical and experi-mental results. We observe that the agreement between our results and both theory and experiment gets worse as the energy
increases. This agreement is reasonably good for thefirst few
states, but differences of several eV occur for the higher states.
We note that the calculations of Nakatsuji et al.47produce a large
number of Rydberg states not described by ours; the more diffuse
basis sets that would be needed to describe these states (and improve the description of other Rydberg states) would entail the use of much bigger radii. Unfortunately, with the UKRmol suite, this would lead to either serious linear dependence
pro-blems or a significant decrease in the quality of the continuum
description.18This poor and incomplete description of the Rydberg
states in our calculations means that any resonances associated with them will either not be described or described poorly.
Scattering Model. A radius of 15a0was required for the
R-matrix sphere for the calculation as the 6-311G** basis set was
used. We included partial waves up tol = 4; the effect of adding
l = 5 was tested at the SEP level, and no significant changes were observed in the resonance positions. In the UKRmol suite, the continuum orbitals are Schmidt orthogonalized to the orbitals of the target; the resulting continuum orbitals face a symmetric
ortho-gonalization, where the deletion threshold was set to 1× 10⁻⁷.
We performed the calculations at SE, SEP, and CC levels,
freezing 9 and 17 core orbitals (i.e.,Nc= 18 andNd= 34 ineqs 3
and4) in the latter calculations, respectively. For molecules with
significant polarizability, a good description of the resonances
(their position and width) depends strongly on the quality of the
description of the polarization effects. As explained above, this
depends on the number of VOs included in the calculation, but
unfortunately, convergence is not possible. Our approach26,56is
therefore to start with a small number of these orbitals and keep adding more, in order of increasing energy, until good agreement is found with the experimental positions of shape resonances. If no experimental results are available, the number of VOs “optimized” for a similar molecule is used (for example, for the case of pyridazine, the numbers used for pyrazine and pyrimidine
were employed26). This approach tends to under-represent
polar-ization in the CC calculations but provides sufficiently accurate
results for an effective comparison with experiments. From this
procedure, we determine that the optimal number of VOs to include in our SEP and CC calculations was 35 and 70, respectively.
■
RESULTSLow-Energy Resonances. Our calculations reveal, as
expected, the presence of two low-lyingπ* resonances, which
are characteristic of molecules in which two double bonds are
present and that were already identified in earlier experimental
and theoretical work.13−16They also reveal the presence of aσ*
resonance, previously identified in calculations.15
Table 2lists the positions and widths of these three low-lying resonances determined at SEP and CC levels and compares them with the data available in the literature.
The positions of the resonances calculated at the SEP level
agree well with those of da Costa et al.15calculated at the same
level. (Their geometry is slightly different from ours, but in SE
tests, this leads to shifts smaller than 0.1 eV in the resonance
positions.) Theπ* resonances also agree reasonably with the
ver-tical attachment energies (VAEs) determined from the
applica-tion of the scaled Koopman’s theorem using Hartree−Fock
orbitals obtained with the 6-31G* basis set. The position of the
σ* resonance determined from the VAE is significantly lower than that obtained from SEP scattering calculations. The results
of Vinodkumar et al.16 overestimate all resonance positions,
either because of a poor description of polarization effects or
simply because of an incorrect assignation of the resonances.
The positions of theπ* resonances determined experimentally
are in good agreement among themselves and with the theo-retical results. For reasons explained below, we present SEP
R-matrix results using two different numbers of VOs. The effect
of increasing the number of VOs by 6 is negligible in the A2π*
resonance but lowers the B1π* one by around 0.15 eV and the σ*
resonance by around 0.4 eV.
Prior experience of describingπ* shape resonances in
mole-cules containing a carbon ring26,56indicates that these resonances
are better described in SEP calculations where sufficient L2
configurations can be included to describe polarization.
There-fore, it is generally the case in our calculations that the positions
of pureπ* shape resonances determined using the CC method
are higher than those determined in SEP calculations. When this is not the case, the fact is used to identify the resonances as mixed core-excited shape because it is understood that it is the inclusion of excited states in the CC expansion that improves the
descrip-tion of the resonance and thus lowers its posidescrip-tion.26,56
This behavior is clearly shown by thefirst π* resonance (see
Table 2); our best CC calculation puts it above our best SEP
calculation. In the case of the secondπ* resonance, SEP and
CC calculations seem to give a similar position. However, theσ*
resonance appears at significantly lower energy in the CC
cal-culation. This behavior could be interpreted as indicating that the σ* resonance has mixed character. This is unlikely to be the case for two reasons: (i) the lowest excited state is at 3.7 eV in our calculation, more than 2 eV above this resonance; (ii) being below its excited parent state, the resonance could only decay to Table 2. Positions and Widths (in brackets) in eV of the Low-Lying Shape Resonances in Thiophene Taken from Our Time Delay
Analysisa
present results other calc. exp.
resonances SEP CC VAE ref15 ref16 ref13 ref14
35 VO 41 VO π1* (B1) 0.949 0.80 1.114 0.95 1.00 2.51 1.27 1.15 (0.035) (0.020) (0.05) − (0.33) σ* (B2) 2.990 2.51 ∼1.5 2.11 2.78 18.69 − − (2.35) (2.107) (2.26) − (1.10) − − π2* (A2) 2.993 2.87 2.909 3.10 2.82 4.35 2.83 2.63 (0.438) (0.340) (0.48) − (1.28)
aThe SEP results were calculated for 35 and 41 VOs. VAEs are also presented. We list the calculated results from da Costa et al.15
and Vinodkumar et al.16and the experimental positions obtained by Asmis13and Modelli and Burrow.14.
the ground state. This tends to make resonances longer lived and
therefore narrow. Theσ* resonance is more than 2 eV wide.
One could argue that this“unusual behavior” may simply be
due to the wrong number of VOs being chosen in the
calcu-lations. However, the choices presented here lead to π*
reso-nances with positions in very good agreement with experiment. As Table 2shows, increasing the number of VOs in the SEP
calculation lowers theπ* resonances below their experimental
positions. Inclusion of fewer VOs in the CC calculation leads either to fairly small changes (if 50 VOs are used, the upward shift in the position of all three resonances is on the order of 0.2 eV) or
a shift that makes agreement for theπ* resonances much worse
(when 30 VOs are used, theσ* resonance is centered, in the time
delay, at around 2.3 eV; however, theπ* resonances appear at
approximately 1.5 and 3.3 eV).
We believe that our usual recipe (of including more VOs until reasonable agreement with experiment for all pure shape reso-nances is reached) cannot be applied here. This may be due to the fact that, unlike all earlier cases analyzed, this target has a
mix ofσ* and π* resonance or to a more subtle effect. Careful
investigation of calculations at SE/SEP and CCs level indicated
that inclusion of polarization effects has a bigger effect for the σ*
resonance at both levels. However, whereas when polarization is included in an SE calculation (when 35 VOs are used in the SEP
model), the shift is of around 2.4 eV for theσ* resonance and
around 1.8−1.9 eV for the π* one; in the CC case (comparing a
calculation where no VOs are used to the one with 70 VOs; note that even when no VOs are used in the CC calculation,
the inclusion of excited states and L2functions of the type in
eq 4already describes some amount of polarization), the shift
for theσ* resonance is around 2.5 eV, but for the π* ones, it is
1.2−1.4 eV. It is possible, therefore, that our CC calculation with
70 VOs overestimates the polarization effect in the B2symmetry,
placing theσ* resonance too low in energy. As a result, we cannot
conclude confidently where we would expect the σ* resonance to
appear in experiments; Modelli and Burrow’s comment14would
put it closer to the 1.5 eV of our CC calculations, but the cal-culations of da Costa et al. and VEAs would indicate a position above 2 eV. It is worth noticing that the maximum of the peak
associated with the σ* resonance in the total cross section
calculated at the CC level appears at around 0.5 eV higher than
that in the time delay. This can be seen inFigure 1where the
contributions to the cross section calculated at the SEP and CC levels are shown. This is not the case for the SEP calculations,
where the difference in position is around 0.1 eV. We believe that
this indicates that the CC calculations are modeling a strong
contribution of nonresonant scattering for the2B2symmetry that
shifts the resonance peak in the cross section.
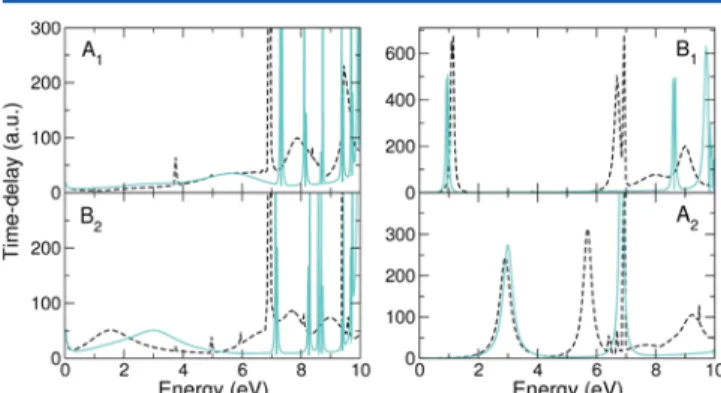
Higher-Energy Resonances. The time delay obtained at
SEP (35 VOs) and CC levels is presented inFigure 2. Thefigure
is divided into four panels, each corresponding to one of the four
irreducible representations of theC2vpoint group. Above thefirst
excitation threshold, the SEP calculations suffer from the
pre-sence of nonphysical pseudoresonances (that manifest as narrow peaks appearing above a certain energy), preventing us from providing reliable information on any physical resonances that may appear in that region. One should also notice that all of the
CC time delays inFigure 2have one prominent peak at 6.95 eV,
corresponding to one of our excitation thresholds (thresholds are very often visible as narrow peaks/spikes in the time delay).
A summary of the higher resonances found is presented inTable 3.
Thefirst panel inFigure 2presents the results for symmetry
A1. The very narrow peaks in the SEP results are probably
pseu-doresonances, whereas in the CC calculation we observe two broad peaks corresponding to physical resonances, at 7.9 and 9.5 eV. It is hard to tell whether there are corresponding peaks at the SEP level, but because no higher-energy resonances appear in our SE calculation, we believe that these are pure core-excited resonances. In addition, a wide structure is visible in the SEP time delay centered at around 5.7 eV. The feature is less obviously present in the CC time delay, but an analysis of the second largest eigenvalue of the Q-matrix does indicate a peak centered at around a similar energy. A resonance also appears in the SE
calcu-lations at∼8 eV. Therefore, this feature could correspond to a
shape resonance. Investigation of the orbitals that contribute to its description indicate that they have some contribution of CH
bond character. The measured excitation function for thefirst
triplet states (see the left-hand panel ofFigure 3) displays a small
band at 4.2 eV to which experimental considerations would
assign B1 symmetry and shape character, although no
corre-sponding structure was found by Asmis. It is possible that this experimental peak corresponds to this resonance, despite the inconsistency in the symmetry.
The different positions of the σ* resonance calculated at the
SEP and CC levels (2.97 and around 1.5 eV, respectively), are
clearly visible in the panel for the B2symmetry. Two other peaks
appear in the CC time delay at around 7.7 and 9 eV. These cor-respond to core-excited resonances. In addition, there is a feature
at∼6.9 eV that is hidden inFigure 2as it overlaps with the peak
Figure 1. Contribution to the total cross section from the four irreducible representations of theC2vpoint group. The dashed black line
corresponds to the CC calculation, and the solid light blue line corresponds to the SEP calculation with 35 VOs. Note that no Born-type correction (see the text) has been added to these cross sections.
Figure 2.Largest eigenvalue of the time delay matrix for the scattering symmetries indicated in the panels. The dashed black line corresponds to the CC calculation, and the solid light blue line corresponds to the SEP calculation with 35 VOs.
corresponding to the 7.7 eV resonance but corresponds to a
resonance too. This hypothesis is confirmed by the analysis of the
eigenphase sum. No resonances appear in the SE calculation
above theσ* shape resonance; therefore, all of the B2resonances
are of core-excited character. None of them are visible in the total
cross section shown inFigure 1.
The upper panel on the right corresponds to the B1symmetry.
This is where thefirst π* resonance appears, at 0.93 and 1.12 eV
at the SEP and CC levels, respectively. At higher energies, three more resonances are observed in the time delay analysis: at
6.7 eV, near a threshold, there is a very well defined peak
corre-sponding to a core-excited resonance; a broader feature appears
at almost 8 eV with core-excited character; andfinally, at 9 eV, it
is possible to observe a well-defined peak. Interestingly, a peak is
visible slightly above at SEP level; this peak is much wider than the ones we identify as pseudoresonances; therefore, we believe that this peak is likely to be physical. The analysis of the branch-ing ratios indicates that all of these resonances have mixed shape core-excited character. Again, the resonances are not visible in the total cross section.
Finally, the A2symmetry presented in the last panel shows the
second shape π* resonance discussed earlier (see Table 2).
A second resonance present at around 5.7 eV in the CC calcula-tion has its corresponding peak at the SEP level appearing almost 1 eV higher. One other resonance, of core-excited character, is located at 9.2 eV. The structure (looking like truncated peaks) between 6 and 7 eV is hard to discern; it may just correspond to the thresholds or be linked to Feshbach resonances. Our calcu-lations, however, do not identify any Feshbach resonances.
Table 3summarizes the resonance positions and widths for the CC calculation, as well as the positions obtained from the experi-mental excitation functions (see below). The resonance positions
are in good agreement with those of Asmis.13Although Vinodkumar
et al. present data for a number of core-excited resonances, we have chosen not to include their results in the table as it is fairly clear that they are incorrect; all of their core-excited resonances appear well above (between 3 and 10 eV) the ionization threshold. This can be directly linked to the fact that, in their work, the excitation energies of the parent states are much higher than those in experiments. An inadequate description of
polar-ization effects may also be contributing to the poor quality of
Vinodkumar et al.’s results.
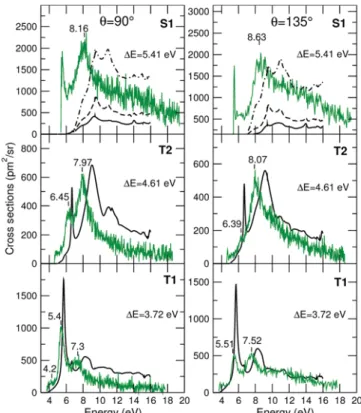
Excitation Functions. The experimental and theoretical
excitation functions for two different electron scattering angles,
90 and 135°, are presented inFigure 3. Our energy loss spectra
(see the Supporting Information) place the first triplet state
(13B
2, T1) at 3.72 eV, the second (13A1, T2) at 4.61 eV, and the
first singlet state (11
A1, S1) at 5.41 eV. For this reason, the
exci-tation functions were measured for energy losses,ΔE, of 3.72,
4.61, and 5.41 eV. However, the band centered at around ∼5.6 eV in the energy loss for for 135° shows the likely presence of another triplet state (or states) that partly overlaps with the S1 state. Therefore, the excitation function labeled S1 actually cor-responds to the excitation of several states of thiophene, though
it is difficult to determine which and how many. We have
therefore plotted three calculated curves for theΔE = 5.41 eV
energy loss: one (solid black line) corresponding to the excita-tion into the lowest singlet excited state (S1) only, another one (dashed line) corresponding to the excitations into the S1 state
plus the third and fourth triplet states in our calculations (13B1and
13A
2), and finally one (dotted−dashed line) where excitations
Table 3. Positions and Widths in Brackets (in eV) of the
Higher-Energy Resonances in Thiophenea
res. ER(width) character PS EELS ref13
12A 2 5.695 MCES 13B2, gs 5.4−5.5 5.38 (0.329) 12B 1 6.70 CE 13A1,13B2 6.4−6.45 6.22 (0.172) 12B 2 6.9 CE − − − (1.85) 22B 2 7.72 CE 13A2 − − (1.15) 12A 1 7.87 CE 11B2,11B1 − − (1.00) 22B 1 7.96 MCES 13B2,13A1, gs 7.3−7.5 7.39 (1.20) 32B 2 8.98 CE 11B2,11A1 − − (1.35) 32B 1 9.01 MCES 13B2,11B2, gs − − (0.58) 22A 2 9.22 CE 13A1,23A1,13B2 8.0−8.1 7.93 (0.95) 22A 1 9.48 CE 13A2,11A2 − − (0.2)
aThe position of the resonances in the EELS spectra are given as
ranges determined from the positions of the peaks in the excitation functions for two angles (seeFigure 3). We also list the experimental positions obtained by Asmis.13 CE stands for pure core-excited resonances, MCES for mixed core-excited shape resonances, and gs for ground state. The most likely parent states (PS) have been obtained from the branching ratios when possible.
Figure 3.Calculated (black lines) and measured (green line) excitation functions for the energy losses indicated in the panels: left panels, scattering angle of 90°; right panels, scattering angle of 135°. The peaks of the measured excitation functions are also indicated in the panels. ForΔE = 5.41 eV, the full black line corresponds to excitation into the first excited singlet state only, whereas the dashed and dotted−dashed lines correspond to the sum of excitations into 3 and 7 states, respec-tively. See the text for more details.
into the third, fourth,fifth, and sixth triplet states plus the first, third, and fourth singlet states in our calculations are added together (the second singlet state in our calculations appears at higher energy than our fourth, and sometimes our third, in more accurate calculations).
The size and shape of the measured and calculated excitation
functions for ΔE = 3.72 and 4.61 eV agree extremely well.
This agreement is similar to that obtained for pyrimidine,33but in
that case, the quantity compared was integral excitation cross sections (obtained from the integration over all angles of the excitation functions). Here, we show the agreement to be excellent
for specific angles. For ΔE = 5.41 eV, the agreement is not as good;
it is clear that inclusion of three states in the calculation produces an excitation function that is much smaller than the experimental one. One needs to include at least seven states to obtain a cal-culated cross section of similar size to the experimental one. This does not necessarily indicate that all seven states contribute to this excitation function. The quality of description of the elec-tronic states of thiophene in our calculations gets worse as their energy increases, in part but not only, because some of these states have Rydberg character. Therefore, the calculations will clearly provide a less accurate description of electronic excitation
into higher-lying states. It is this effect that may be leading to an
inaccurate excitation function forΔE = 5.41 eV and the need
to include more states than are actually contributing to the measurement.
The positions of those resonances identified in the excitation
functions show good agreement with our calculated resonances. As expected, the calculated resonance positions are at higher energies than the experimental ones. There may be two reasons
for this:first, the energies of the parent states are overestimated
in our calculation, and second, it is expected that the polarization
effects will not be fully described in a CC calculation. The latter is
likely to be a smaller effect for thiophene as the shape resonances
are in fairly good agreement with experiment. A similar
compar-ison for pyrimidine33produced very similar agreement
(includ-ing the absence of some calculated resonances in the EELS cross sections); the shifts are somewhat smaller in this case but, as for pyrimidine, increase as the resonance energy increases.
It is not surprising that some of the resonances identified in our
calculations cannot be seen in the EELS experiments; not all
core-excited resonances have a strong effect in the electronic
excitation cross sections. Those calculated resonances that are visible appear, as expected, in the excitation function of their
parent states: the 12A2one appears in the T1, the 12B1appears
both in T1 and T2, the 22B
1appears again in both T1 and T2, and
the 22A
2appears in all three. Of the resonances that are not
apparent in the experimental excitation functions, only the 32B1
(at around 9 eV in our calculations) has either the T1, T2, or S2
as the main parent state (specifically, the T1).
Comparison with DEA Results. The DEA experiments of Muftakhov et al. are hard to correlate with the resonances that we
identified, but some links can be made. The ion yields for H-loss
and the formation of a fragment with mass 32 have a peak at around 3.4−3.5 eV. The only possible resonance on our
calcu-lations that this may be linked to is the higher-lying pure shapeπ*
resonance located at around 2.9 eV. Alternatively, the peak in these yields could correspond to a narrow Feshbach resonance that we have failed to identify whose parent is the lowest excited
state (the 13B
2). The ion yields for several fragments (among
them the one coming from single H-loss) display peaks at around 5.3, 5.5, and 5.8 eV. Again, the only resonance that we describe in
our calculations that could be linked to these peaks is the 12A
2at
∼5.7 eV seen by the EELS closer to 5.4−5.5 eV. Peaks in the mass
spectra in the range of 6.15−6.4 eV could be linked to the 12B
1
resonance that we observe at 6.7 eV and the EELS at 6.4−6.45 eV
(the 12B
2resonance at around 6.9 eV is much shorter lived and
less likely to lead to dissociation). Finally, several peaks in the
8.5−8.9 eV range could be linked to one or several of the
reso-nances that we describe in the 8.98−9.45 eV range. Muftakhov
et al. do not report peaks in the mass spectra below 3.3 eV.
■
CONCLUSIONSWe have performed R-matrix calculations and EELS experiments for electron scattering from thiophene in order to identify and characterize its core-excited resonances. Comparison of
mea-sured and calculated excitation functions for two different angles
and three different energy losses show very good agreement;
both their size and shape agree very well, at least for the two energy losses where it is clear which states are being excited. This indicates that the calculations are modeling the physics of the collision accurately, despite the fact that our usual strategy for
determining how to model the polarization effects (i.e., how
many virtual orbitals are required for their description) does not seem to work particularly well for this system. It also demon-strates that it is now possible to provide quantitatively accurate cross sections for low-energy electronic excitation of low-lying states of biologically relevant molecules.
Our calculated results for the pure shape resonances agree well with previous calculations and experiments, although some
uncer-tainty persists as to the accurate position of the rather wideσ*
resonance. Four core-excited or mixed core-excited resonances described by our calculations are visible in the excitation func-tions, although, as expected, the calculated ones appear higher in energy. These are, on the whole, the longer-lived (i.e., narrower)
resonances identified. A feature appears at around 4.2 eV in the
excitation function that we believe may correspond to a poorly
described (in the calculations) pure shape A1resonance. Another
six resonances are identified in our calculations. Finally, some of
the core-excited resonances can be linked to the DEA spectra of
Muftakhov et al.12
■
ASSOCIATED CONTENT*
S Supporting InformationThe Supporting Information is available free of charge on the
ACS Publications websiteat DOI:10.1021/acs.jpca.7b11865. Energy loss spectra measured in the forward and backward directions in order to identify the excited states of thiophene
and experimental elastic differential cross sections (PDF)
■
AUTHOR INFORMATIONCorresponding Author
*E-mail:jimena.gorfi[email protected].
ORCID
Jimena D. Gorfinkiel:0000-0001-9264-3932 Present Address
§K.R.: Laboratório de Colisões Atómicas e Moleculares,
CEFITEC, Departamento de Física, Faculdade de Ciências e
Tecnologia, Universidade Nova de Lisboa, Campus de Caparica, Lisboa, 2829-516 Portugal.
Notes
The authors declare no competingfinancial interest.
■
ACKNOWLEDGMENTSThis work used the ARCHER UK National Supercomputing
Service (http://www.archer.ac.uk). M.A. and K.R. acknowledge
support by Project No. 200020-144367/1 of the Swiss National
Science Foundation. A.L. was supported by Fundação para a
Ciência e a Tecnologia (FCT-MCTES), Radiation Biology and
Biophysics Doctoral Training Programme (RaBBiT, PD/00193/ 2012); UID/Multi/04378/2013 (UCIBIO); UID/FIS/00068/ 2013 (CEFITEC). K.R. acknowledges the Swiss National Science Foundation for an EPM fellowship.
■
REFERENCES(1) Boudaïffa, B.; Cloutier, P.; Hunting, D.; Huels, M. A.; Sanche, L. Resonant Formation of DNA Strand Breaks by Low-energy (3 to 20 eV) Electrons.Science 2000, 287, 1658−1660.
(2) Fabrikant, I. I.; Eden, S.; Mason, N. J.; Fedor, J. InAdvances in atomic, molecular, and optical physics; Ennio Arimondo, C. C. L., Yelin, S. F., Eds.; Academic Press, 2017; Vol.66; pp 545−657.
(3) Alizadeh, E.; Sanche, L. Precursors of Solvated Electrons in Radiobiological Physics and Chemistry.Chem. Rev. 2012, 112, 5578− 5602.
(4) Baccarelli, I.; Bald, I.; Gianturco, F. A.; Illenberger, E.; Kopyra, J. Electron-induced Damage of DNA and its Components: Experiments and Theoretical Models.Phys. Rep. 2011, 508, 1−44.
(5) Gorfinkiel, J. D.; Ptasińska, S. Electron Scattering from Molecules and Molecular Aggregates of Biological Relevance.J. Phys. B: At., Mol. Opt. Phys. 2017, 50, 182001.
(6) Gramec, D.; Peterlin, L.; Sollner, M. Bioactivation Potential of Thiophene-containing Drugs.Chem. Res. Toxicol. 2014, 27, 1344−1358. (7) Hedhili, M. N.; Cloutier, P.; Bass, A. D.; Madey, T. E.; Sanche, L. Electron Stimulated Desorption of Anionic Fragments from Films of Pure and Electron-irradiated Thiophene. J. Chem. Phys. 2006, 125, 094704.
(8) Staykov, A.; Areephong, J.; Browne, W. R.; Feringa, B. L.; Yoshizawa, K. Electrochemical and Photochemical Cyclization and Cycloreversion of Diarylethenes and Diarylethene-capped Sexithio-phene Wires.ACS Nano 2011, 5, 1165−1178.
(9) Dimitrakopoulos, C.; Malenfant, P. Organic Thin Film Transistors for Large Area Electronics.Adv. Mater. 2002, 14, 99−117.
(10) Liang, Y.; Yu, L. Development of Semiconducting Polymers for Solar Energy Harvesting.Polym. Rev. 2010, 50, 454−473.
(11) Murphy, A.; Frechet, J. Organic Semiconducting Oligomers for Use in Thin Film Transistors.Chem. Rev. 2007, 107, 1066−1096.
(12) Muftakhov, M. V.; Asfandiarov, N.; Khvostenko, V. I. Resonant Dissociative Electron Attachment of Electrons to Molecules of Five-membered Heterocyclic Compounds and Lactams.J. Electron Spectrosc. Relat. Phenom. 1994, 69, 165−175.
(13) Asmis, K. R. Ph.D. thesis, Université de Fribourg, Switzerland, 1996.
(14) Modelli, A.; Burrow, P. Electron Attachment to the Aza-derivatives of Furan, Pyrrole and Thiophene.J. Phys. Chem. A 2004, 108, 5721−5726.
(15) da Costa, R.; do N. Varella, M.; Lima, M.; Bettega, M. Low-energy Electron Collisions with Thiophene.J. Chem. Phys. 2013, 138, 194306. (16) Vinodkumar, M.; Desai, H.; Vinodkumar, P. Electron Induced Chemistry of Thiophene.RSC Adv. 2015, 5, 24564−24574.
(17) Mozejko, P.; Ptasinska-Denga, E.; Szmytkowski, C. Cross Sections for Electron Collision with Five-membered Ring Heterocycles. Eur. Phys. J. D 2012, 66, 20659−20666.
(18) Tennyson, J. Electron-molecule Collision Calculations Using the R-matrix Method.Phys. Rep. 2010, 491, 29−76.
(19) Carr, J. M.; Galiatsatos, P. G.; Gorfinkiel, J. D.; Harvey, A. G.; Lysaght, M. A.; Madden, D.; Mašín, Z.; Plummer, M.; Tennyson, J.; Varambhia, H. N. UKRmol: a Low-energy Electron- and Positron-molecule Scattering Suite.Eur. Phys. J. D 2012, 66, 20653−20656.
(20) Burke, P. G.R-matrix Theory of Atomic Collisions: Application to Atomic, Molecular and Optical Processes; Springer, 2011.
(21) Fabrikant, I. I. Long-range Effects in Electron Scattering by Polar Molecules.J. Phys. B: At., Mol. Opt. Phys. 2016, 49, 222005.
(22) Mašín, Z.; Gorfinkiel, J. D.; Jones, D. B.; Bellm, S. M.; Brunger, M. J. Elastic and Inelastic Cross Sections for Low-energy Electron Collisions with Pyrimidine.J. Chem. Phys. 2012, 136, 144310−144320. (23) Norcross, D. W.; Padial, N. T. The Multipole-extracted Adiabatic-nuclei Approximation for Electron-molecule Collisions.Phys. Rev. A: At., Mol., Opt. Phys. 1982, 25, 226−238.
(24) Tashiro, M.; Morokuma, K.; Tennyson, J.R−matrix Calculation of Differential Cross Sections for Low-energy Electron Collisions with Ground-state and Electronically Excited-state O2Molecules.Phys. Rev.
A: At., Mol., Opt. Phys. 2006, 74, 022706−022714.
(25) Hazi, A. U. Behavior of the Eigenphase Sum Near a Resonance. Phys. Rev. A: At., Mol., Opt. Phys. 1979, 19, 920−922.
(26) Mašín, Z.; Gorfinkiel, J. D. Shape and Core Excited Resonances in Electron Collisions with Diazines.J. Chem. Phys. 2012, 137, 204312.
(27) Shimamura, I.; Cleanthes, E.; Nicolaides, A.; Sabin, J.Advances in Quantum Chemistry; Academic, 2012.
(28) Smith, F. T. Lifetime Matrix in Collision Theory.Phys. Rev. 1960, 118, 349−356.
(29) Allan, M.; Winstead, C.; McKoy, V. Electron Scattering in Ethene: Excitation of the ã 3B
1u State, Elastic Scattering and Vibrational
Excitation.Phys. Rev. A: At., Mol., Opt. Phys. 2008, 77, 042715. (30) Allan, M. Electron Collisions with CO: Elastic and Vibrational Excitation Cross Sections.Phys. Rev. A: At., Mol., Opt. Phys. 2010, 81, 042706.
(31) Regeta, K.; Allan, M. Absolute Cross Sections for Electronic Excitation of Furan by Electron Impact.Phys. Rev. A: At., Mol., Opt. Phys. 2015,91, 012707.
(32) Regeta, K.; Allan, M.; Winstead, C.; McKoy, V.; Mašín, Z.; Gorfinkiel, J. D. Resonance Effects in Elastic Cross Sections for Electron Scattering on Pyrimidine: Experiment and Theory.J. Chem. Phys. 2016, 144, 024301.
(33) Regeta, K.; Allan, M.; Mašín, Z.; Gorfinkiel, J. D. Absolute Cross Sections for Electronic Excitation of Pyrimidine by Electron Impact.J. Chem. Phys. 2016, 144, 024302.
(34) Gopalan, A.; Bömmels, J.; Götte, S.; Landwehr, A.; Franz, K.; Ruf, M. W.; Hotop, H.; Bartschat, K. A Novel Electron Scattering Apparatus Combining a Laser Photoelectron Source and a Triply Differentially Pumped Supersonic Beam Target: Characterization and Results for the He−(1s2s2) Resonance.Eur. Phys. J. D 2003, 22, 17−29.
(35) Allan, M. Measurement of the Elastic andv = 0→ 1 Differential Electron-N2Cross Sections Over a Wide Angular Range.J. Phys. B: At.,
Mol. Opt. Phys. 2005, 38, 3655−3672.
(36) Nickel, J. C.; Zetner, P. W.; Shen, G.; Trajmar, S. Principles and Procedures for Determining Absolute Differential Electron-molecule (Atom) Scattering Cross Sections.J. Phys. E: Sci. Instrum. 1989, 22, 730−738.
(37) Nesbet, R. K. Variational Calculations of Accuratee−− He Cross Sections Below 19 eV.Phys. Rev. A: At., Mol., Opt. Phys. 1979, 20, 58−70. (38) McClellan, A. Tables of experimental dipole moments; W.H. Freeman, 1963.
(39) Gussoni, M.; Rui, R.; Zerbi, G. Electronic and Relaxation Contribution to Linear Molecular Polarizability. An Analysis of the Experimental Values.J. Mol. Struct. 1998, 447, 163−215.
(40)NIST Standard reference database.http://http://cccbdb.nist.gov
(accessed Oct. 4, 2017).
(41) Palmer, M. H.; Walker, I. C.; Guest, M. F. The Electronic States of Thiophene Studied by Optical (VUV) Absorption, Near-threshold Electron Energy Loss (EEL) Spectroscopy and Ab Initio Multi-Reference Configuration Interaction Calculations.Chem. Phys. 1999, 241, 275−296.
(42) Haberkern, H.; Asmis, K.; Allan, M.; Swiderek, P. Triplet States in Oligomeric Materials: Electron Energy Loss Spectroscopy of Thiophene and Bithiophene and Extrapolation to the Polymer.Phys. Chem. Chem. Phys. 2003, 5, 827−833.
(43) Flicker, W.; Mosher, O.; Kuppermann, A. Electron Impact Investigation of Electronic Excitations in Furan, Thiophene, and Pyrrole.J. Chem. Phys. 1976, 64, 1315−1321.
(44) Salzmann, S.; Kleinschmidt, M.; Weinkkauf, J. T. R.; Marian, C. M.; et al. Excited States of Thiophene: Ring Opening as Deactivation Mechanism.Phys. Chem. Chem. Phys. 2008, 10, 380−392.
(45) Weinkauf, R.; Lehr, L.; Schlag, E. W.; Salzmann, S.; Marian, C. M. Ultrafast Dynamics in Thiophene Investigated by Femtosecond Pump Probe Photoelectron Spectroscopy and Theory.Phys. Chem. Chem. Phys. 2008,10, 393−404.
(46) Holland, D. M. P.; Trofimov, A. B.; Seddon, E. A.; Gromov, E. V.; Korona, T.; de Oliveira, N.; Archer, L. E.; Joyeux, D.; Nahon, L. Excited Electronic States of Thiophene: High Resolution Photoabsorption Fourier Transform Spectroscopy and Ab Initio Calculations. Phys. Chem. Chem. Phys. 2014, 16, 21629−21644.
(47) Wan, J.; Hada, M.; Ehara, M.; Nakatsuji, H. Electronic Excitation Spectrum of Thiophene Studied by Symmetry-adapted Cluster Configuration Interaction Method.J. Chem. Phys. 2001, 114, 842.
(48) Serrano-Andrés, L.; Merchán, M.; Fulscher, M.; Roos, B. O. A Theoretical Study of the Electronic Spectrum of Thiophene.Chem. Phys. Lett. 1993, 211, 125−134.
(49) Kleinschmidt, M.; Tatchen, J.; Marian, C. Spin-orbit Coupling of DFT/MRCI Wavefunctions: Method, Test Calculations, and Applica-tion to Thiophene.J. Comput. Chem. 2002, 23, 824−833.
(50) Werner, H.-J.; Knowles, P. J.; Knizia, G.; Manby, F. R.; Schütz, M.; Celani, P.; Györffy, W.; Kats, D.; Korona, T.; Lindh, R.; et al. MOLPRO, version 2015.1, a package of ab initio programs.http://www.molpro.net
(2015).
(51) Jones, E.; Moodie, I. M. The Synthesis and Absorption Spectra of the Isomeric Dithienyl Sulphides.Tetrahedron 1965, 21, 2413−2420.
(52) Di Lonardo, G.; Galloni, G.; Trombetti, A.; Zauli, C. Electronic Spectrum of Thiophen and Some Deuterated Thiophens.J. Chem. Soc., Faraday Trans. 2 1972, 68, 2009−2016.
(53) Van Veen, E. H. Tripletπ−π* Transitions in Thiophene, Furan and Pyrrole by Low-energy Electron Impact Spectroscopy.Chem. Phys. Lett. 1976, 41, 535−539.
(54) Nyulászi, L.; Veszprémi, T. Near Ultraviolet Spectrum of Thiophene and its Derivatives.Chem. Scr. 1986, 26, 629−634.
(55) Hakansoon, R.; Nordén, B.; Thulstrup, E. Magnetic Circular Dichroism of Heterocycles: Thiophene. Chem. Phys. Lett. 1977, 50, 306−308.
(56) Loupas, A.; Gorfinkiel, J. D. Resonances in Low-energy Electron Scattering from para-Benzoquinone.Phys. Chem. Chem. Phys. 2017, 19, 18252−18261.