Shape and Core-excited Resonances in Thiophene
Alexandra Loupas,
†,‡Khrystyna Regeta,
¶,§Michael Allan,
¶and Jimena D.
Gorfinkiel
∗,‡†Laborat´orio de Colis˜oes At´omicas e Moleculares, CEFITEC, Departamento de F´ısica,
Faculdade de Ciˆencias e Tecnologia, Universidade Nova de Lisboa, Campus de Caparica,
2829-516, Portugal
‡School of Physical Sciences, The Open University, Walton Hall, Milton Keynes, MK7
6AA, United Kingdom.
¶Department of Chemistry, University of Fribourg, Fribourg, 1700, Switzerland
§Current address: Laborat´orio de Colis˜oes At´omicas e Moleculares, CEFITEC,
Departamento de F´ısica, Faculdade de Ciˆencias e Tecnologia, Universidade Nova de
Lisboa, Campus de Caparica, 2829-516, Portugal
E-mail: [email protected]
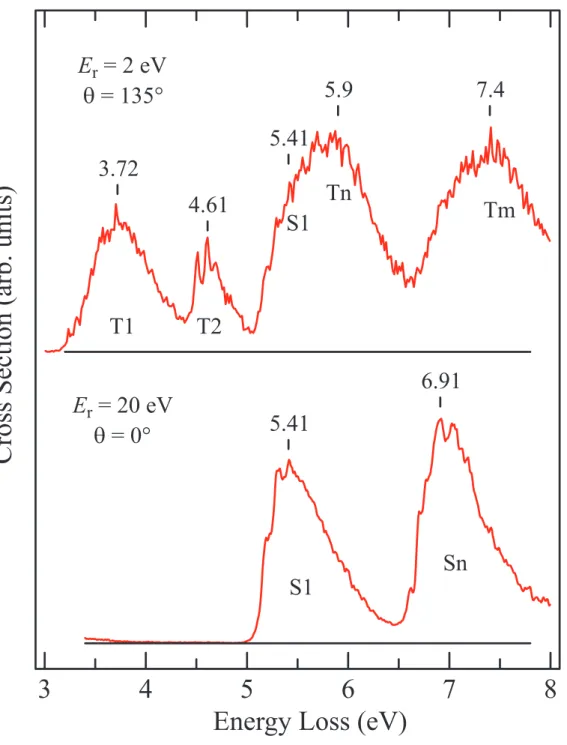
Figure S1: Energy loss spectra recorded in the forward (lower panel) and backward (upper panel) directions. The forward direction spectrum shows nearly exclusively dipole allowed transitions. The backward direction spectrum, recorded with a low residual energy, is dom-inated by triplet states, but weak excitation of the singlet states also contributes. The first (T1) and second (T2) triplet states as well as the first excited singlet state (S1) are clearly identifiable in the energy loss spectra below and are consistent with earlier calculations and experiments. Three other bands, above ∼5.4 eV, are also clearly identifiable in the ex-periments, but their assignation to specific states is less clear: the band labelled Tn may correspond to the 13B
1 and 13A2 states with contributions from the 23A1 23B2 states. The
Tm experimental feature could be due to (overlapping) 33A1 and 23A2 states. We are not
able to identify which singlet state or states contribute to the Sn band.
3
4
5
6
7
8
Energy Loss (eV)
CrossSection(arb.units)
E
r= 20 eV
q = 0°
5.41
6.91
T1
T2
Tn
Tm
S1
S1
Sn
E
r= 2 eV
q = 135°
3.72
4.61
5.41
5.9
7.4
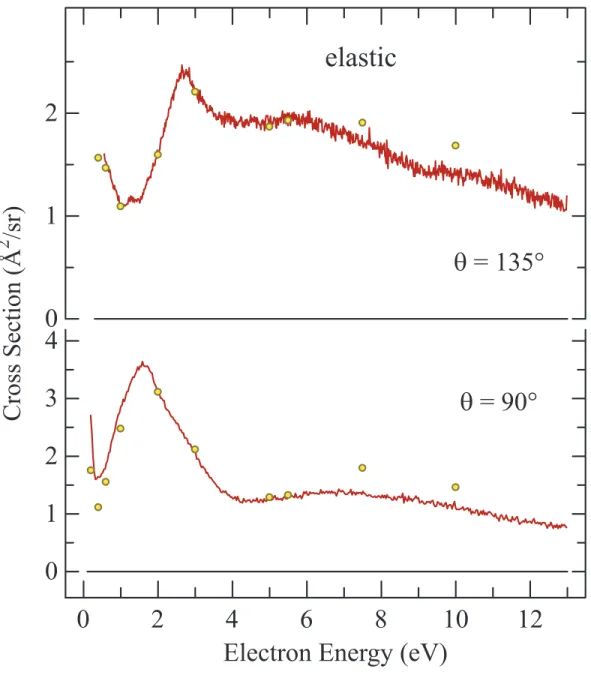
S2Figure S2: Elastic differential cross sections in thiophene. The yellow circles indicate the absolute values obtained by the relative flow method at discrete incident energies. The red continuous line is the excitation function, obtained by sweeping the incident and scattered electron energies, and normalized to the discrete values.