Sebastian T. Schindera Rendon C. Nelson Laurens Howle Eli Nichols David M. DeLong Elmar M. Merkle Received: 17 November 2007 Revised: 1 January 2008 Accepted: 20 January 2008 Published online: 20 March 2008 # European Society of Radiology 2008
Effect of varying injection rates of a saline
chaser on aortic enhancement in CT
angiography: phantom study
Abstract The effect of varying in-jection rates of a saline chaser on aortic enhancement in computed tomography (CT) angiography was determined. Single-level, dynamic CT images of a physiological flow phan-tom were acquired between 0 and 50 s after initiation of contrast medium injection. Four injection protocols were applied with identical contrast medium administration (150 ml in-jected at 5 ml/s). For baseline protocol A, no saline chaser was applied. For protocols B, C, and D, 50 ml of saline was injected at 2.5 ml/s, 5 ml/s, and 10 ml/s, respectively. Injecting the saline chaser at twice the rate as the contrast medium yielded significantly higher peak aortic enhancement val-ues than injecting the saline at half or at the same rate as the contrast medi-um (P<0.05). Average peak aortic
enhancement (HU) measured 214, 214, 218, and 226 for protocols A, B, C, and D, respectively. The slower the saline-chaser injection rate, the longer the duration of 90% peak enhance-ment: 13.6, 12.2, and 11.7 s for protocols B, C, and D, respectively (P>0.05). In CT angiography, saline chaser injected at twice the rate as the contrast medium leads to increased peak aortic enhancement and saline chaser injected at half the rate tends towards prolonging peak aortic en-hancement plateau.
Keywords CT angiography . Contrast media . Saline-chaser technique
Introduction
Since the late 1990s various clinical reports have been published on saline-chaser technique for computed tomog-raphy (CT) angiogtomog-raphy of the head and neck, thorax, and abdomen [1–7]. The saline-chaser technique results in greater efficiency of the administered contrast medium dose by avoiding accumulation of the contrast medium in the injection tubing and in the venous system between the injection site and the atrium of the right heart [4, 7]. The increased contrast medium efficiency can be used either to obtain enhancement or to reduce contrast medium volume.
The latter result is preferred by the majority of radiologists, since it yields cost savings and reduces the risk of subsequent nephrotoxicity.
The reported ability of saline-chaser technique in CT angiography to reduce contrast medium volume ranges from 16% to 29% [1–5]. However, it is not yet clear how much a particular saline-chaser technique reduces contrast medium volume, since single-level time enhancement curves were not obtained in previous patient studies [1– 5]. Little is known of the underlying pharmacokinetic features of administered normal saline immediately following the contrast medium bolus in CT angiography S. T. Schindera . R. C. Nelson .
D. M. DeLong . E. M. Merkle Department of Radiology, Duke University Medical Center, Durham, NC, 27710, USA S. T. Schindera (*) Institute for Diagnostic,
Interventional and Pediatric Radiology, Inselspital Bern, University of Bern, Freiburgstrasse 10, 3010 Bern, Switzerland e-mail: [email protected] Tel.: +41-31-6322172 Fax: +41-31-6324874 L. Howle . E. Nichols
Mechanical Engineering and Materials Science Department, Duke University, Durham, NC, 27708, USA
[8], yet to optimize injection protocols for CT angiography with saline chaser, it is important to understand these features. This knowledge gap prompted us to design a physiological aortic flow phantom to investigate single-level time enhancement curves in CT angiography with varying saline-chaser injection rates.
Thus, the purpose of our study was to determine the effect of varying saline-chaser injection rates on aortic enhancement in CT angiography.
Materials and methods
Flow phantom
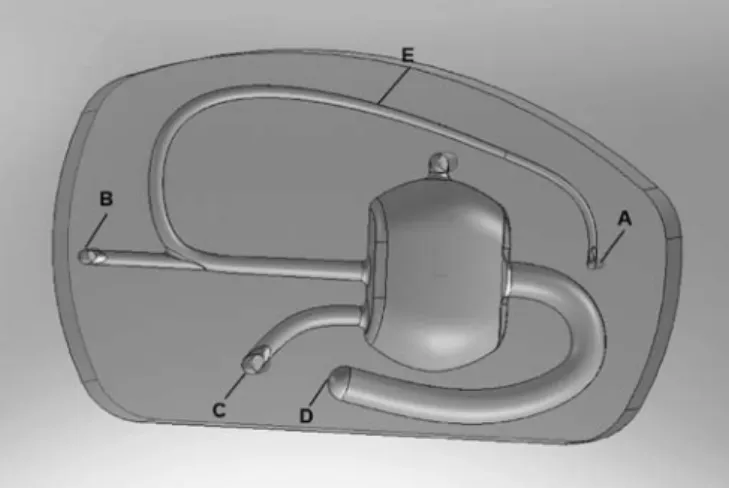
A physiological aortic flow phantom was manufactured in cooperation with the School of Engineering at Duke University. The objective of our physiological flow phantom was to simulate aortic contrast enhancement of a 70-kg adult during CT angiography. Construction of the phantom was based on the compartmental model for early contrast enhancement pharmacokinetics published by Bae et al. [9,10]. Our phantom, measuring 46 cm×27 cm in the xy-axes, consisted of the following three compartments: the venous system, simulating the venous passage of the contrast medium bolus from the injection site in the upper extremity to the atrium of the right heart (called dead space), the cardiopulmonary system, and the thoracic aorta (Fig. 1). The compartments were milled into an 11-cm-thick block of polycarbonate by a three-axis computer numerical control milling machine. The computer aided design (CAD) model of the phantom was created with the SolidWorks software package (SolidWorks, Concord, Mass.). The computer numerical control machine code was generated after the CAD model was created with the SolidCAM software system (SolidWorks). The phantom was machined in two halves and the halves were bonded together with epoxy (West Systems, Bay City, Mich.).
To assess the volume of the dead space in human subjects before phantom development, a third-year radiol-ogy resident retrospectively measured the dead space volume of ten adult patients (six women, four men; age range: 50–71 years) on gadolinium-enhanced magnetic resonance angiography images. Institutional review board approval and informed consent waiver were obtained for this HIPAA-compliant study. All measurements were performed on a workstation (Advantage Windows 4.2; GE Healthcare, Milwaukee, Wis.) using an electronic ruler. The dead space was designated to be the right antecubital vein, basilic vein, axillary vein, subclavian vein, and superior vena cava. The patient’s right side was chosen, since that side is preferentially used in the clinical setting due to the shorter route of contrast medium passage between the injection site and the right atrium. For the volumetric calculation, the dead space was divided into two segments: (1) the right antecubital vein, basilic vein,
axillary vein, and the subclavian vein, and (2) the superior vena cava. The volume was calculated as V ¼ π d=2ð Þ2I, where d is the mean diameter of the veins, and l is the total length of the veins. The volume of the first segment measured on average 25.7 ml (range, 21.7–31.5 ml), and the second segment, 13.8 ml (range, 10.2–17.7 ml), resulting in a mean total volume of 39.5 ml (range, 33.7– 44.7 ml) for the dead space. Thus, we implemented a volume of 40 ml for the phantom’s dead space.
For the volume of the cardiovascular system, the second compartment, and the various flow rates within the system, we referred to the global circulation model proposed by Bae et al. [10]. The volume of the cardiovascular system, representing the blood volume of the heart and lung for a 70-kg adult, measured 900 ml. The phantom had three inlets connected to three peristaltic hose pumps (Master-flex; Barnant, Barrington, Ill.), which sent water at room temperature through the flow phantom (Fig. 1). The peristaltic pumps provide a nearly uniform flow. The outlet connected to the aorta (2.5 cm in diameter), the third compartment, drained the water into a bucket. The
Fig. 1 The physiological flow phantom simulating aortic enhance-ment of a 70-kg adult. It consists of three compartenhance-ments: the venous system (dead space), the cardiopulmonary system, and the aorta. The phantom was supplied with tap water at room temperature via three peristaltic hose pumps connected to three inlets (A, B, and C). The inlets were set at three different flow rates. The flow rates of inlet A (162 ml/min) and B (975 ml/min) simulate the flow rate of a 70-kg adult within the veins of the upper extremity and the jugular vein, respectively [10]. In order to achieve a flow rate of 6,500 ml/ min in the aorta, representing the average cardiac output for a 70-kg adult [10], the flow rate of inlet C entering the cardiovascular system (volume, 900 ml) was set at 5,363 ml/min. The fast flow rate of inlet C yielded a substantial stirring of the contrast medium with water inside the cardiopulmonary cavity. The outlet (D) connected to the aorta (diameter, 2.5 cm) drained into a bucket. The contrast medium and saline was injected via an 18-gauge IV catheter (E) in the distal part of the venous system. The dead space volume, defined as the volume between the injection site and the cardiopulmonary system, measured 40 ml. The volume of the segment between the injection site and inlet B measured 26 ml, and between inlet B and the cardiopulmonary system, 14 ml
phantom’s three inlets and one outlet were set at various flow rates to model exactly the physiological flow rates of the blood flow in the veins of the upper extremity and thoracic aorta (Fig.1). Contrast medium followed by saline chaser was injected into the venous system with a dual-head mechanical power injector (Empower CTA; E-Z-Em, Westbury, N.Y.). The two syringes of the injector were connected to an 18-gauge intravenous (IV) catheter (BD Insyte Autoguard; BD Medical, Sandy, Utah) via a Y-shaped connecting tube (Empower CTA; E-Z-Em). In the cardiopulmonary system, the contrast medium was diluted and stirred with water. From there, the diluted contrast medium was ejected into the thoracic aorta. Unlike the compartmental model published by Bae et al. [9], we did not consider recirculation of the contrast medium via systemic circulation in the design of our phantom, since the extent of recirculation within 50 s of initiation of the contrast medium is very small.
Injection protocol and CT parameters
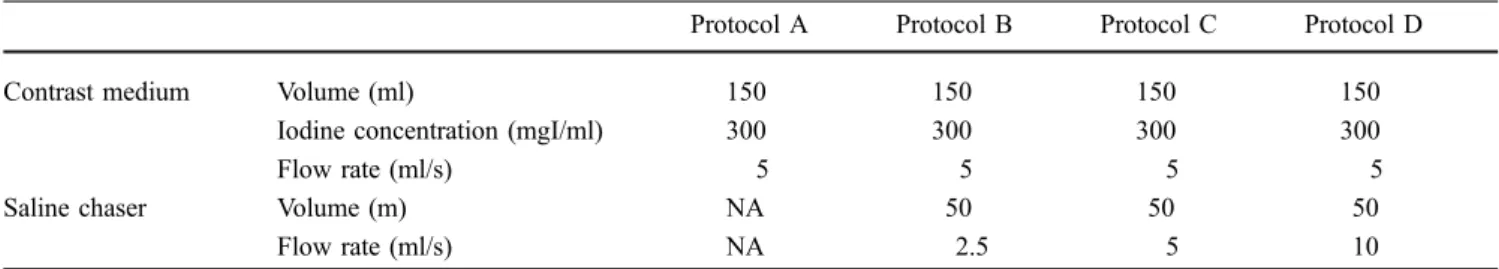
Four injection protocols were tested (Table 1). Each injection protocol was repeated five times. The adminis-tration parameters of the contrast medium were kept identical for all protocols: 150 ml of contrast medium with an iodine concentration of 300 mg/ml (Isovue 300; Bracco Diagnostics, Princeton, N.J.) injected at 5 ml/s. For protocol A, representing the baseline protocol, no saline chaser was used. For protocols B, C, and D, a bolus of 50 ml isotonic saline (0.9% sodium chloride; Hospira, Lake Forest, Ill.) was administered immediately after the termi-nation of the contrast medium injection. For protocol B, the saline bolus was injected at half the rate of the contrast medium (2.5 ml/s), for protocol C, at the same rate of the contrast medium (5 ml/s), and for protocol D, at double the rate of the contrast medium (10 ml/s).
The flow phantom was positioned within the isocentre of a single detector CT system (HiSpeed CT/i; GE Healthcare) with its cross-section perpendicular to the z-axis. Following the initiation of contrast medium injection, 26 dynamic, single-level, 10-mm-thick transverse images, separated by 2-s intervals from 0 to 50 s, were acquired. CT imaging parameters were as follows: tube voltage, 120 kVp; tube current, 250 mA; and gantry rotation time, 1 s.
Assessment of aortic enhancement and statistical analysis
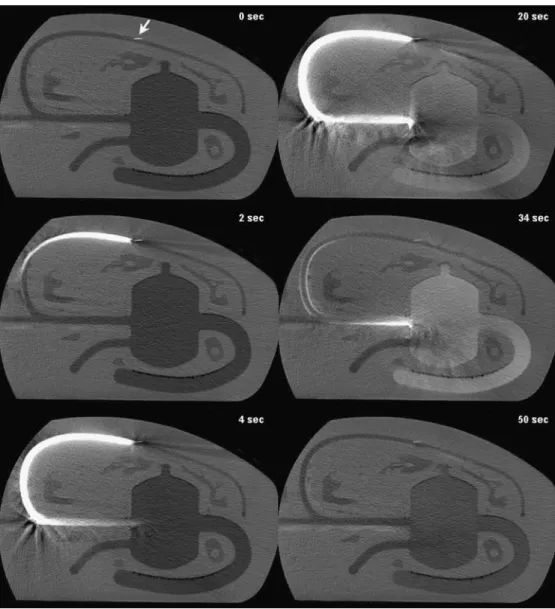
The radiology resident assessed aortic enhancement on a workstation (Advantage Windows 4.2; GE Healthcare) using the 10-mm-thick transverse images. Before the assessment of the aortic enhancement, the radiology resident received comprehensive instructions by a radiol-ogist with 15 years of post-subspecialty training in abdominal radiology. Aortic attenuation measurements in Hounsfield units (HU) were obtained by manually placing circular regions-of-interests (area, 350 mm2) within the aorta (Fig. 2). Measurements were obtained on the 26 dynamic images, providing a total of 26 time points (every 2 s from 0 to 50 s after the initiation of the contrast medium). For every time point of each run, three aortic attenuation measurements at three different locations in the thoracic aorta were acquired. By applying the copy and paste function of the workstation, identical regions-of-interest could be achieved for every time point within the same run. Aortic enhancement was defined as the absolute difference in attenuation value between the mean value at the 0-s time point and the mean value at the 2- to 50-s time points.
Using the aortic enhancement values of the five runs for each protocol, spline-smoothed curves were calculated to extract peak enhancement (in HU), time-to-peak enhance-ment (in seconds), mean enhanceenhance-ment over those values greater than 90% of peak enhancement (90% peak enhancement) (in HU), and duration of 90% peak enhancement (in seconds). Enhancement values and time points were summarized with descriptive statistics. The resulting enhancement values and time points were then used in a one-way analysis of variance (ANOVA), with the injection rate and the amount of saline solution as explanatory variables. A P value of less than 0.05 was considered to indicate a statistically significant difference. All statistical analyses were performed with SAS software (Version 9.1.3; SAS, Cary, N.C.).
Results
As the saline-chaser injection rate increased, the peak enhancement and 90% peak enhancement values also
Table 1 Injection parameters of the contrast medium and saline chaser for protocols A–D (NA not applicable)
Protocol A Protocol B Protocol C Protocol D
Contrast medium Volume (ml) 150 150 150 150
Iodine concentration (mgI/ml) 300 300 300 300
Flow rate (ml/s) 5 5 5 5
Saline chaser Volume (m) NA 50 50 50
increased (Table 2, Fig. 3). Aortic enhancement values were greater for protocols B, C, and D using a saline chaser (injection rate, 2.5, 5, and 10 ml/s, respectively) compared with the baseline protocol without saline chaser (protocol
A). The percentage increase in peak enhancement for protocols B, C, and D compared with protocol A measured 0%, 1.7%, and 5.2%, respectively, and the percentage increase in 90% peak enhancement 0.2%, 1.8%, and 4.5%, Fig. 2 Set of six sequential,
10-mm transverse CT images of the flow phantom acquired with protocol C at 0, 2, 4, 20, 34 (peak enhancement), and 50 s after initiation of the contrast medium. Arrow indicates the tip of the IV catheter in the distal part of the venous system
Table 2 Descriptive characteristics of aortic enhancement values and time points for injection protocols A–D. Data are mean values ± standard error; the figures in parentheses indicate the range of the aortic enhancement values and the time points
Protocol A Protocol B Protocol C Protocol D
Peak enhancement [HU] 214.4±1.9
(210.1–220.2) 214.4±2.4* (205.9–219.6) 218.1±3.3* (210.4–228.3) 225.5±0.8** (223.8–228.4) Time to peak enhancement [s] 30.7±0.4
(29.9–31.9) 30.8±0.8* (28.1–32.6) 33.9±0.4** (32.6–35.1) 34.8 ± 0.4** (33.6–35.6) 90% peak enhancement [HU] 204.6±2.3
(199.7–211.6) 204.9±2.4* (195.6–208.8) 208.7±3.5* (199.8–217.0) 214.1±0.9** (212.4–217.0) Duration of 90% peak enhancement [s] 10.4±1.67
(4.8–13.8) 13.6±1.3* (10.1–17.1) 12.2±1.3* (7.5–15.8) 11.7±1.4* (8.5–16.3)
For statistical analysis the enhancement values and time points of protocols B–D were compared with those of protocol A: * indicates no statistically significant difference (P>0.05); ** indicates statistically significant difference (P<0.05)
respectively. Significant differences in peak enhancement were seen for protocol D compared with protocols A, B, and C, and in 90% peak enhancement for protocol D compared with protocols A and B (P<0.05). All other comparisons of the enhancement values indicated no statistically significant differences (P>0.05).
Increasing saline-chaser injection rates yielded longer delays in the occurrence of peak enhancement. Time-to-peak enhancement for protocols B, C, and D compared with protocol A was delayed by 0.1, 3.2, and 4.1 s, respectively. The peak enhancement of protocols C and D occurred significantly later than the enhancement of protocols A and B (P<0.01).
Compared with protocol A (no saline chaser), the duration of 90% peak enhancement for protocols B, C, and D (all with saline chaser) was prolonged by 3.2, 1.8, and 1.3 s, respectively. Within the protocols using a saline chaser, the duration of 90% peak enhancement decreased as the injection rate of the saline chaser increased. The longest duration of 90% peak enhancement was seen with protocol B, using an injection rate of 2.5 ml/s. There were no statistically significant differences regarding the dura-tion of 90% peak enhancement among the four protocols (P>0.05).
Discussion
In the last few years, the saline-chaser technique for CT angiography has been increasingly used in clinical settings principally because of the desire to reduce contrast medium volume. To maximize contrast medium reduction with the saline-chaser technique in CT angiography, it is necessary to understand the underlying pharmacokinetics of the administered saline solution, in particular how variation of the injection rate changes contrast medium volume. The majority of institutions inject the saline solution at the same rate as the preceding contrast medium, though no study to date has demonstrated yet the justification of this specific injection scheme.
Our experimental data indicate greater magnitude of aortic enhancement and delayed aortic enhancement in CT angiography with increasing saline-chaser injection rates. The protocol injecting the saline solution twice as fast as the contrast medium (protocol D) yielded significantly greater aortic enhancement values than the protocol applying the same injection rate for both the saline solution and the contrast medium (protocol C). A likely explanation for this finding is that the tail end of the administered contrast medium bolus is pushed forward more rapidly into the venous system when the saline solution is injected at higher rates. Thereby, the rate of iodine delivery into the arterial system increases, resulting in a greater magnitude of aortic enhancement. Based on our results, in order to maximize the magnitude of aortic enhancement, the saline solution has to be injected twice as fast as the contrast medium. For CT angiography, this implies that the saline-chaser injection rate has to be set at 8–10 ml/s.
The results of our study also suggest that decreasing the saline-chaser injection rate tends towards increased dura-tion of the peak enhancement plateau. The longest duradura-tion of the 90% peak enhancement was seen for the protocol injecting the saline chaser at half the rate of the contrast medium (protocol B). In addition, the duration of the 90% peak enhancement of protocol B was prolonged by 3.2 s compared with protocol A (no saline chaser), but no difference was detected in the peak enhancement values. This implies that the saline chaser injected at half the rate of the contrast medium was not able to increase the rate of iodine delivery in the arterial system, and consequently not able to increase the magnitude of aortic enhancement, but rather preserved the rate of iodine delivery on a high level for an extended period. Similar findings on prolonged enhancement plateaus in CT angiography with a saline chaser have been reported recently by Lee et al. [8] in a canine model. The administration of saline chaser at half the rate of the contrast medium extended substantially the duration of the peak aortic enhancement plateau compared with an injection protocol with a saline chaser administered at the same rate as the contrast medium or given without a saline chaser [8]. However, in contradiction to our results, the study did demonstrate substantially lower peak aortic 0 50 100 150 200 250 0 10 20 30 40 50 Time [sec]
Aortic Enhancement [HU]
Protocol A Protocol B Protocol C Protocol D
Fig. 3 Aortic time-enhancement curves for protocols A, B, C, and D demonstrating the impact of increasing injection rates (2.5, 5, and 10 ml/s, respectively) of the saline chaser. The higher the injection rate of the saline chaser, the greater the peak enhancement and 90% peak enhancement. In addition, increasing the injection rate of the saline chaser delayed peak enhancement
enhancement values for the protocol using saline chaser at half the rate of the contrast medium compared with the protocol with a saline chaser administered at the same rate or to the protocol without a saline chaser. Neither were the authors of the canine study nor the authors of our study able to determine the cause of decreased peak aortic enhance-ment values in the protocol with saline chaser injected at half the rate of the contrast medium.
As demonstrated by our experimental study, the aortic enhancement curve for CT angiography can be refined in two ways with the application of a saline chaser, depending on its injection rate: either the magnitude of aortic enhancement can be increased or the duration of the peak aortic enhancement plateau can be lengthened, while keeping the enhancement value at a high level. Both adjustments are valuable for reduction of contrast medium volume, though they have to be matched to the type of CT machine used. With the advent of faster 64-detector-row CT machines, the ideal enhancement profile for CT angiography has changed. With CT systems with rows of 16 or fewer detectors, a sustained and prolonged peak arterial enhancement plateau is ideal; a narrower and higher peak arterial enhancement profile is desired for a 64-detector-row CT system. Therefore, saline solution should be injected at faster rates than the contrast medium with 64-detector-row CT systems, and at slower injection rates applying 16-detector (or fewer) row or single detector systems.
There were limitations to our study. The major limitation of our experimental study was the lack of clinical validation for the aortic flow phantom using four different injection protocols. However, to obtain an accurate clinical validation for our phantom, four different single-level time enhancement curves within the same patient would be necessary. Owing to the substantial accumulated radiation dose to the patient and the large volume of iodinated contrast media, such a study would represent too high of a risk to study subjects. However, to simulate as precisely as
possible CT angiography with a saline chaser, we followed closely the data from an established global circulation model [10], and we used data from ten patients to calculate our phantom’s dead space volume. A minor limitation was that we did not use a different injection rate for the contrast medium. Since CT angiography is usually performed at a contrast medium injection rate of 4–6 ml/s, we chose to use 5 ml/s. The high costs for the contrast medium and the low probability to detect substantial differences with other contrast medium injection rates reinforced our decision to investigate only one contrast medium injection rate. Another minor limitation was that we did not investigate the potential ability of the saline chaser to improve parenchymal enhancement. However, the objective of our experimental investigation was to evaluate the vascular enhancement benefit of a saline chaser in CT angiography. Investigation of parenchymal enhancement benefit requires a separate experimental study, particularly since recent published data on the use of saline chaser for abdominal CT are controversial [7,11–14].
In conclusion, our phantom data indicate that injecting saline chaser at the same rate as the contrast medium does not constitute the optimal technique for contrast medium reduction in CT angiography. Depending on the saline-chaser injection rate, the deployment of saline saline-chaser for CT angiography either increases peak aortic enhancement or prolongs the duration of peak aortic enhancement. Further clinical studies need to be conducted to evaluate the potential volume of contrast medium reduction in CT angiography with half or twice the injection rate of the contrast medium for the saline chaser.
Acknowledgements Bracco Diagnostics (Princeton, N.J.) provided financial support for the design of the physiological aortic flow phantom, and for the utilized contrast medium volume. However, only the authors of this manuscript had access to the study’s data and the information submitted for publication.
References
1. de Monye C, Cademartiri F, de Weert TT, Siepman DA, Dippel DW, van Der Lugt A (2005) Sixteen-detector row CT angiography of carotid arteries: com-parison of different volumes of contrast material with and without a bolus chaser. Radiology 237:555–562
2. Haage P, Schmitz-Rode T, Hubner D, Piroth W, Gunther RW (2000) Reduc-tion of contrast material dose and artifacts by a saline flush using a double power injector in helical CT of the thorax. AJR Am J Roentgenol 174:1049–1053
3. Irie T, Kajitani M, Yamaguchi M, Itai Y (2002) Contrast-enhanced CT with sa-line flush technique using two auto-mated injectors: how much contrast medium does it save? J Comput Assist Tomogr 26:287–291
4. Schoellnast H, Tillich M, Deutschmann MJ, Deutschmann HA, Schaffler GJ, Portugaller HR (2004) Aortoiliac en-hancement during computed tomogra-phy angiogratomogra-phy with reduced contrast material dose and saline solution flush: influence on magnitude and uniformity of the contrast column. Invest Radiol 39:20–26
5. Cademartiri F, Mollet N, van der Lugt A et al (2004) Non-invasive 16-row multislice CT coronary angiography: usefulness of saline chaser. Eur Radiol 14:178–183
6. Hopper KD, Mosher TJ, Kasales CJ, TenHave TR, Tully DA, Weaver JS (1997) Thoracic spiral CT: delivery of contrast material pushed with injectable saline solution in a power injector. Radiology 205:269–271
7. Orlandini F, Boini S, Iochum-Duchamps S, Batch T, Zhu X, Blum A (2006) Assessment of the use of a saline chaser to reduce the volume of contrast medium in abdominal CT. AJR Am J Roentgenol 187:511–515
8. Lee CH, Goo JM, Bae KT et al (2007) CTA contrast enhancement of the aorta and pulmonary artery: the effect of saline chase injected at two different rates in a canine experimental model. Invest Radiol 42:486–490
9. Bae KT, Tran HQ, Heiken JP (2000) Multiphasic injection method for uni-form prolonged vascular enhancement at CT angiography: pharmacokinetic analysis and experimental porcine model. Radiology 216:872–880 10. Bae KT, Heiken JP, Brink JA (1998)
Aortic and hepatic contrast medium enhancement at CT. Part I. Prediction with a computer model. Radiology 207:647–655
11. Dorio PJ, Lee FT Jr, Henseler KP et al (2003) Using a saline chaser to de-crease contrast media in abdominal CT. AJR Am J Roentgenol 180:929–934
12. Schoellnast H, Tillich M, Deutschmann HA et al (2003) Abdominal multi-detector row computed tomography: reduction of cost and contrast material dose using saline flush. J Comput Assist Tomogr 27:847–853
13. Schoellnast H, Tillich M, Deutschmann HA et al (2004) Improvement of parenchymal and vascular enhancement using saline flush and power injection for multiple-detector-row abdominal CT. Eur Radiol 14:659–664 14. Itoh S, Ikeda M, Achiwa M, Ota T,
Satake H, Ishigaki T (2003) Multiphase contrast-enhanced CT of the liver with a multislice CT scanner. Eur Radiol 13:1085–1094