HAL Id: cea-02434021
https://hal-cea.archives-ouvertes.fr/cea-02434021
Submitted on 9 Jan 2020HAL is a multi-disciplinary open access archive for the deposit and dissemination of sci-entific research documents, whether they are pub-lished or not. The documents may come from teaching and research institutions in France or abroad, or from public or private research centers.
L’archive ouverte pluridisciplinaire HAL, est destinée au dépôt et à la diffusion de documents scientifiques de niveau recherche, publiés ou non, émanant des établissements d’enseignement et de recherche français ou étrangers, des laboratoires publics ou privés.
Validation of CATHARE-3 system code for sodium
two-phase flow application r&d path and simulation of
key-tests from SIENA program
M. Anderhuber, J. Perez-Manes, N. Alpy
To cite this version:
M. Anderhuber, J. Perez-Manes, N. Alpy. Validation of CATHARE-3 system code for sodium two-phase flow application r&d path and simulation of key-tests from SIENA program. NURETH-17, Sep 2017, Xi’An, China. �cea-02434021�
VALIDATION OF CATHARE-3 SYSTEM CODE FOR SODIUM
TWO-PHASE FLOW APPLICATION: R&D PATH AND SIMULATION OF
KEY-TESTS FROM THE SIENA PROGRAM
M. Anderhuber
DEN-Département de Modélisation des Systèmes et Structures, STMF, CEA, Université
Paris-Saclay, F-91191 Gif-sur-Yvette, France
[email protected]
J. Perez, and N. Alpy
DEN-Département d’Etudes des Réacteurs, SESI, CEA, F-13108 Saint-Paul-Lez-Durance,
France
[email protected], [email protected]
ABSTRACT
Sodium Fast Reactors (SFRs) are being considered by several leading nuclearized countries as the most promising technology for next generation of nuclear reactors (Gen IV). In that frame, R&D programs are being conducted to enhance their safety. It is the role of system codes, such as CATHARE-3, to provide a fair balance of the actual safety gain for some severe scenarios that are postulated, such as an Unprotected Loss Of Flow (ULOF).
While monophasic simulations with the CATHARE-3 system code are seen today to be reliable, sodium two-phase flow models are still under development and validation process. This paper reports the recent progress made in those fields.
First, some key two-phase flow closure laws that are currently considered by CATHARE-3 are summarized. They include some new fluid mechanics correlations that were established thanks to the SENSAS air/water program which was featuring a full-scale subassembly mock-up which geometry was consistent with the low void reactor concepts (upper sodium plenum). The developed correlations are then qualified on some sodium boiling key-tests from the Japanese SIENA-37 80’s programs, which feature various phenomenology, including complex chugging phenomenon. The good match between experiment and CATHARE-3 revision-3 simulation is highlighted. However it is also reported some likely limits of the code current models, especially concerning prediction of dry-out occurrence. The paper concludes on the need of new experimental programs to support the validation of the code.
KEYWORDS
CATHARE-3, SFR, sodium boiling, SIENA-37, SENSAS models
1. INTRODUCTION
While conventional light water moderated reactors reach their initial estimated lifetime and waste management acquires new dimensions, many countries (France, Russia, Korea, etc...) are developing advanced concepts of Gen IV Sodium Fast Reactor (SFR) seduced by its attractive features. Especially, compared to the current fleet of Pressurized Water Reactors (PWRs), SFRs should highly reduce the consumption of uranium resources and the production of radioactive waste. They also benefit from very promising safety aspects, such as no pressurized primary circuit, high sodium inertia, high margin to
boiling, etc. Nevertheless, safety analyses have to be conducted prior to construction, foreseeing some severe scenarios like the Unprotected Loss Of Flow (ULOF). Inline, if such transients lead to sodium boiling, the thermo-hydraulic simulations should be able to provide reliable information on the initial phase of the transient, prior to the possible entry in severe accident (cladding damage).
Sodium properties feature a very high liquid/vapour density ratio (magnitude of 2000). At boiling onset, a large amount of void is therefore generated. This can induce dynamic instabilities such as chugging phenomenon [1], or flow blockage of the hydraulic channels leading to fuel pins dry out in a few tens of seconds [2]. One of the major challenges for thermo-hydraulic system codes, such as CATHARE-3 (the reference system code for French SFRs design and safety studies), is to fairly reproduce such behaviors. While simulations on monophasic applications with CATHARE are proved today to be reliable [3], diphasic models are actually still under a development and validation process.
In this paper, CATHARE-3 two-phase models for Na boiling are first recapped. In particular, a new correlation established from an air/water experimental program (SENSAS) is reported, as it proves to be very capable when applied to Na boiling tests. The second part of the paper reports a comparison between results of CATHARE-3 simulations and those from some SIENA-37 tests. These tests include some loss of flow transients at constant pin power (FC-21 and FC-34 tests) and some quasi-static tests as an increase of (low) pin power under natural circulation (LHF-123 test). By this way, the scope of applicability of the current CATHARE-3 modeling on the matter is highlighted.
2. CATHARE-3 CODE TWO-PHASE MODELS 2.1. CATHARE-3 code structure
“CATHARE” stands for “Code for Analysis of Thermal-hydraulics during Accident and for Reactor safety Evaluation”. CATHARE-3 is the most recent version of this two-phase, six-equation system code, developed in France and resulting from combined efforts of AREVA-NP, EDF, IRSN and CEA. While it was at first dedicated to PWR safety evaluation, CATHARE is being adapted for sodium application since 2005. Inline, a significant validation effort has been made on reactor cases such as PHENIX, SUPERPHENIX and MONJU: CATHARE has demonstrated its ability to consistently reproduce the related monophasic tests. Currently, the effort is focused on two-phase flow models assessment, to gain confidence on CATHARE-3 calculations for SFR accidental scenarios. CATHARE closure laws are revised and the validation process has started with sodium boiling experiments from the 80’s. This work was carried out with the support from SFR R&D/RNR-Na project at CEA.
The advance of CATHARE-3 compared to CATHARE-2 in terms of sodium physical models is the implementation of three distinct revisions, following a step by step development approach. Each revision is composed of a proper set of two-phase closure laws, as described in Table I.
Table I: Key points on CATHARE-3 physical revisions for Na boiling Physical
revision Fluid mechanic two-phase models Thermal exchange two-phase models
Revision-1: same laws as in
CATHARE-2
Interfacial momentum: Original PWR models have been kept [4].
Wall momentum: Lockart-Martinelli two-phase flow multiplier [5] is applied for liquid friction on the wall.
Comment: Lockart-Martinelli model was indeed recommended in the 80’s for liquid metals boiling studies [6]
Original PWR models have been kept [4] except for wall to liquid transfer for which Skupinski
correlation is applied [7].
Revision-2: encompass some key closure laws
from the SABENA code [8], which was part of the reference code for sodium boiling applications in the 80’s and 90’s.
Interfacial and wall frictions: same as in revision-1.
Comment: regarding interfacial fluid mechanics, first version of SABENA was assuming an annular flow while more advanced codes were modeling different flow patterns.
Instead, interfacial laws for PWRs application have been kept in revision-2 since those are considered to benefit from sound developments covering bubbly/slug/churn to annular flow patterns, depressurized situations (hence large density ratios) as well as a large scope of hydraulic diameters (from rod-bundle to pipe geometries).
Closure laws from SABENA:
One of the main assumptions is that, unlike water, convection heat transfer dominates almost up to the critical heat flux for sodium. Then, nucleate boiling regime could be neglected so that the phase change is considered to occur only in the fluid bulk by means of interfacial heat transfer;
Vapor is additionally supposed to be very close to saturation. Revision-3: Ongoing development revision in which specific laws and physical adaptations are being gathered (following advances from new experimental programs such as SENSAS [9] or according to expert judgments)
Wall liquid friction: SENSAS specific correlation is applied, see §2.2.
Interfacial friction: PWRs law for pipe geometry has been modified following SENSAS program to describe properly the transition between bubbly to slug-churn flow patterns.
Nucleate boiling and departure from nucleate boiling correlations (respectively THOM and
GROENEVELD correlations dedicated for
pressurized water experiments) have been removed.
THOM correlation, applied to sodium, was providing a reduced heat exchange at boiling onset. Then, it has been replaced by the monophasic forced convection correlation (Skupinski), keeping the possibility to onset interfacial area development at wall through bubble generation (at least for numerical reason). Indeed, as forced convection exchange is already very efficient in monophasic, its improvement with nucleate boiling is expected to make slight
difference.
Besides, the boiling crisis mechanism is irrelevant in Na under nominal power: dry-out is then only considered through the criteria (kept from PWR’s laws): α>0.99999 or Tw>Tsat+200°C.
Despite the in-subassembly radial thermal gradient and very likely 3-D effects during sodium boiling [10], only a 1-D approach is considered in CATHARE for sodium applications according to the following points:
On a scientific point of view, one of the learning lessons from past experiments was that local boiling seems not to be a driving mechanism for Na boiling in a SFR sub-assembly during a loss of flow under nominal power [2]. As such, the pressure loss was reported as not affected by local boiling events.
Pragmatically, CATHARE assignment by the project is to study system effects and calculate safety transients in a whole loop or a whole reactor within a short calculation time (CPU time kept between few minutes to half a day).
As the first point remains to be balanced closely, in particular regarding Gen IV innovative design specificities, a sub-channel code, MC-TEb, is actually under development at CEA. However, CATHARE is expected to provide important new insights providing some right adjustments of the fluid mechanic and thermal closure laws to meet Na physics. Indeed, the code benefits from several decades of development and connected know-how in the nuclear field: several scenarios have been assessed, including low pressure cases, such as depressurization in PWRs (connected to large density ratios) within a large scope of geometrical configurations (rod bundle and pipe geometries). In the specific context of dynamic instabilities which is faced in Na boiling flow, CATHARE’s implicit numerical scheme could additionally be considered as a sound point.
2.2. SENSAS correlation for wall friction
Even if, as mentioned, some depressurized situations were part of the CATHARE qualification grids for PWRs, the two-phase friction models have been considered to deserve additional investigations for sodium application, especially to balance effects of:
a faster transition from bubbles to slug/churn flow patterns at low-quality (which will be indeed already connected with high void fractions) ;
the combination of lower diameter in the heated channels (pins bundle of few mm hydraulic diameters instead of rods of few centimeters ones) with higher void fraction ;
a sharp hydraulic transition at the bundle-plenum interface where the hydraulic diameter goes from few mm to more than 10cm. This point interplays on the negative void worth of Gen IV SFRs low neutronic void concepts.
There are two types of two-phase friction models:
Wall friction models which consist in the definition of a two-phase flow multiplier that is applied to the monophasic pressure drop. The latter has been chosen in the pipes to be described according to Blasius [11] and in the rod bundle to be described according to Rheme [12]. In revision-3 of CATHARE, the SENSAS correlation for two-phase flow multiplier 𝜙𝑙,
corresponding to equation (1) has been implemented to replace Lockhart-Martinelli (up to a gas velocity which onsets droplets entrainment i.e. approximatively up to 68m/s according to Steen-Wallis correlation):
𝜙𝑙= 1
(1 − 𝛼)2min [1 ; 1.4429(1 − α)0.6492] (1)
where 𝛼 is the void fraction.
This new correlation has been developed from air/water steady tests on a full-scale SFR subassembly mock-up, named SENSAS [9], where it has been possible to test a scope of low
quality-high void fraction conditions, typically up to 70% void fraction in the plenum. The use of air/water as a vapor/liquid sodium simulant could be justified by some similarities such as high density ratios, proximities of Bond numbers and superficial tensions. It offers in turn pragmatic advantages such as experimental flexibility, reduced investment cost as well as instrumentation accuracy [9]. However, some distortions are obvious and the legitimacy of this correlation has to be established on sodium experiments
.
The demonstration of the SENSAS law capability started with GR-19 experiments [13], and goes on in this paper with SIENA experiments. This is actually not so surprising if one considers that the Lockhart-Martinelli correlation which was recommended in the 80’s for sodium, was also establishedfrom
air/water data, among other fluids like air/kerosene and air/benzene. Interfacial friction models: Table I reports that some changes were applied to PWR’s laws in CATHARE. However, these changes are only effective for diameters over 10cm (pipe geometry) and are therefore not applied in the following simulations on SIENA experiment. They will therefore not be commented further in this paper. One could however refer to [9] for any detail.
3. CATHARE-3 CODE ASSESSMENT ON SIENA EXPERIMENT 3.1. Introduction to SIENA experiment
3.1.1. SIENA loop and test section
The Japanese facility SIENA (Sodium Installation for Experiment of Nuclear reactor safety Analysis) was built and exploited during the 70’s and 80’s in O-arai engineering center, Power Reactor and Nuclear Fuel Development Corp. (PNC), Japan. The program objectives were to perform and understand sodium boiling thermo-hydraulic behavior under low power conditions (from 0.5 to 8kW/pin) and low mass flow rate conditions.
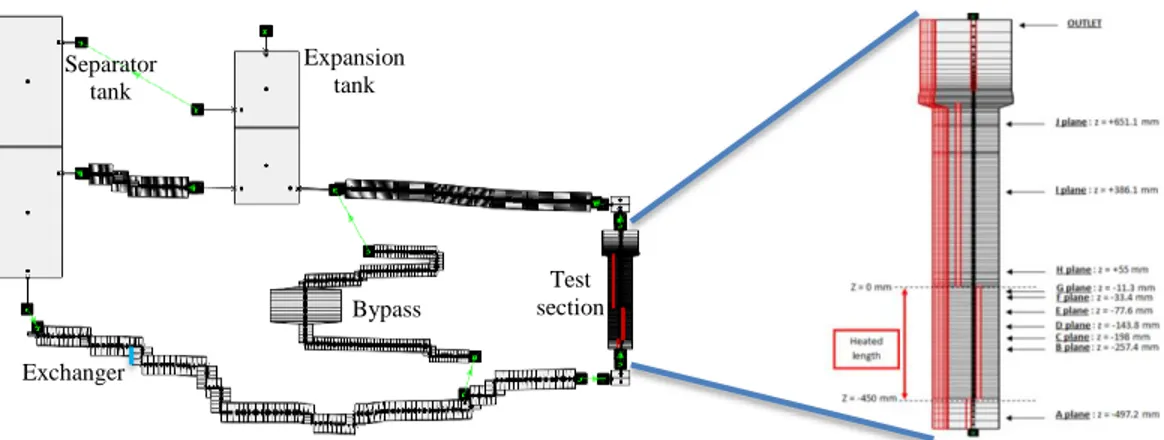
The SIENA loop was composed of a test section, an expansion vessel, a separator vessel, a main exchanger, a pump, a by-pass line featuring an auxiliary heater and a set of valves (cf. Fig. 1). SIENA-37 test section (cf. Fig. 2) consisted in a 37 pins rod bundle topped with a plenum. The rod bundle was composed of three parts: the lower part and upper part were unheated while the central part was heated. The pins were set with wire spacers. Table II reports some key geometric parameters.
Table II: SIENA test section geometry description
(in millimeter) SIENA-37
Heating length 450
Upstream non-heating length 148 Downstream non-heating length 715
Convergent plenum length 364
Hexagonal wrapper average diameter 50.4
Pin diameter 6.5
Spacer wire diameter 1.3
Wire screw pitch 265
Axial flux profile uniform
3.1.2. SIENA-37 boiling tests
With the 37-pins test section, several categories of tests were performed:
Monophasic tests,
Quasi-static boiling tests, along which power was increased step by step under natural circulation conditions [14],
Loss Of Flow (LOF) boiling tests under forced convection [15],
Quasi-static boiling tests along which cover-gas pressure of the expansion vessel was decreased step by step.
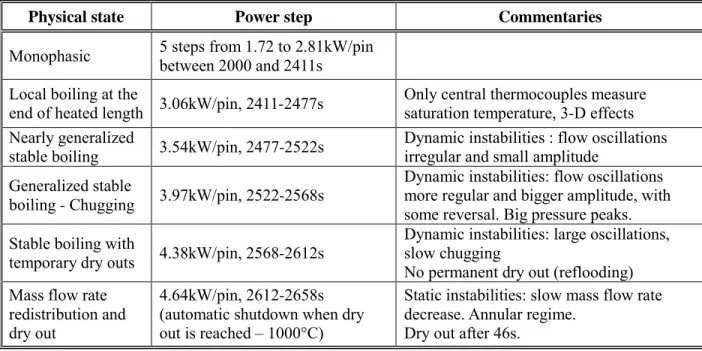
The 2nd category of test consisted in the increase of the power step by step from 0 to 4,6kW/pin while inlet temperature was maintained around 369°C. The LHF-123 test is particularly interesting since each power step features a specific behavior from stable boiling up to dry out, as specified in table III.
Table III: LHF-123 experiment description
Physical state Power step Commentaries
Monophasic 5 steps from 1.72 to 2.81kW/pin between 2000 and 2411s Local boiling at the
end of heated length 3.06kW/pin, 2411-2477s
Only central thermocouples measure saturation temperature, 3-D effects Nearly generalized
stable boiling 3.54kW/pin, 2477-2522s
Dynamic instabilities : flow oscillations irregular and small amplitude
Generalized stable
boiling - Chugging 3.97kW/pin, 2522-2568s
Dynamic instabilities: flow oscillations more regular and bigger amplitude, with some reversal. Big pressure peaks. Stable boiling with
temporary dry outs 4.38kW/pin, 2568-2612s
Dynamic instabilities: large oscillations, slow chugging
No permanent dry out (reflooding) Mass flow rate
redistribution and dry out
4.64kW/pin, 2612-2658s (automatic shutdown when dry out is reached – 1000°C)
Static instabilities: slow mass flow rate decrease. Annular regime.
The 3rd category of tests is also very relevant since the performed transients are similar to the ULOF scenarios. Those tests featured a progressive decrease of the flow rate by decreasing the pump voltage (flow halving time is about 3s). Two of these tests are considered here: FC-34 at the constant power of 8kW/pin (constant inlet temperature was 487.5°C) and FC-21 at 4.5kW/pin (inlet temperature was 535°C). While the first one led to permanent dry out, the second one showed the availability of a long term stabilized boiling. FC-34 test is particularly interesting since significant flow oscillations were observed (with some reversal flows). Void appeared first in the central region, and then expanded radially and axially: according to the experimenters [15], during that period which lasted about 26s from the beginning of the transient, the inlet flow decrease was small. Then, the void occupied the whole cross-section and the pattern became one-dimensionally. From that time, 1-D codes should be able to reproduce the physical trends. Then, expansion and contraction of void slugs were repeating. The multiplied pressure loss in the bundle accelerated the inlet flow decrease and pressure peaks were measured. Some temporary dry outs were also monitored. The flow redistribution lasted a dozen of seconds.
The 4th category of tests could have been also very attractive to simulate regarding the qualification of the flashing model, as a separated effect from other models (especially, from nucleate boiling one). Unfortunately, some data showed to be inconsistent and insufficient to be properly exploited.
3.2. SIENA simulations with CATHARE-3 code 3.2.1. CATHARE modeling
To perform CATHARE-3 simulations of SIENA tests, the whole loop is modeled. Figure 3 shows the loop representation with CATHARE graphic interface tool GUITHARE. To model SIENA loop pipes and test section, 1-D modules are used, while 0-D modules are chosen to represent the two vessels. A boundary condition is set at the top of the expansion vessel to impose the cover gas pressure during the transient.
Figure 3: CATHARE modeling of SIENA loop and test section
Previous simulations with CATHARE code of boiling tests in GR-19 French facility showed that heat losses could strongly impact the simulation [13]. This is why it has been decided to model them with CATHARE all along the test section. Heat losses have been estimated by O-arai for nominal operations. For hereafter calculations, it has been decided to use these estimations to calculate and impose an external transfer coefficient constant all along the transient (Hext = 10 W/m2/°C).
Sensibilities studies also highlighted that it is advisable to take into account the distortion of the axial flux profile during transient due to the heating wires electric resistivity shift with the temperature. Indeed, it
Expansion tank Separator tank Bypass Test section Exchanger
has been found out that the significant axial temperature gradient of the heated pins during boiling tests change the repartition of the volumetric power to nearly reach, at pins endings, twice the bottom one. One can note that the same choice was made by IBRAE when modeling SIENA tests with SOCRAT-BN code [16].
3.2.2. CATHARE-3 code closure laws assessment on SIENA tests
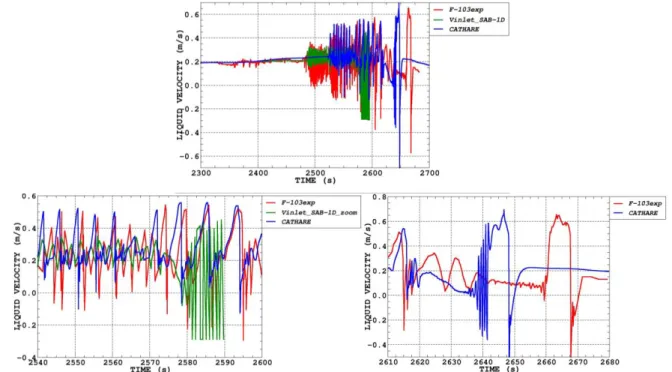
LHF-123 quasi-static test under natural convection has been simulated by SABENA code few years after running the experiment. 1-D calculations have been compared to the experiment [17]. A same approach is possible with CATHARE-3 revision-3. Figure 4 shows the inlet velocity over the whole transient and some interesting zooms of the plots.
Figure 4: Inlet velocity during LHF-123 test. Comparison between CATHARE-3 rev3 calculations (in blue), SABENA-1D calculations (in green) and experiment (in red)
It can be shown on Figure 4 that CATHARE code succeeds in differentiating stable boiling steps from unstable boiling ones: the flow redistribution occurs at the last step (4.64kW/pin) as for the experiment, which is not the case of the 80’s version of SABENA. For stable boiling steps, CATHARE reproduces quite well the amplitude and frequency of the oscillations (cf. two different steps in first zoom; the transition is at time 2568s). However, at the last step, CATHARE reaches dry out 20 seconds sooner than the experiment. It has been showed on GR19 tests [13] that thermal losses can impact the redistribution time. Moreover, it is known that the redistribution time depends also on the structures inertia. But both have been evaluated here based on experimental data and should not differ too much from the reality. The dissonance between experimental results and CATHARE calculation is probably due to the wall friction model (SENSAS model is used up to time 2630s), which is probably not adapted to such high vapor quality conditions (during stable steps, the quality remains under 0.04 but it goes up to 1 during the final step). The friction calculated here with revision-3 of CATHARE is most likely overestimated.
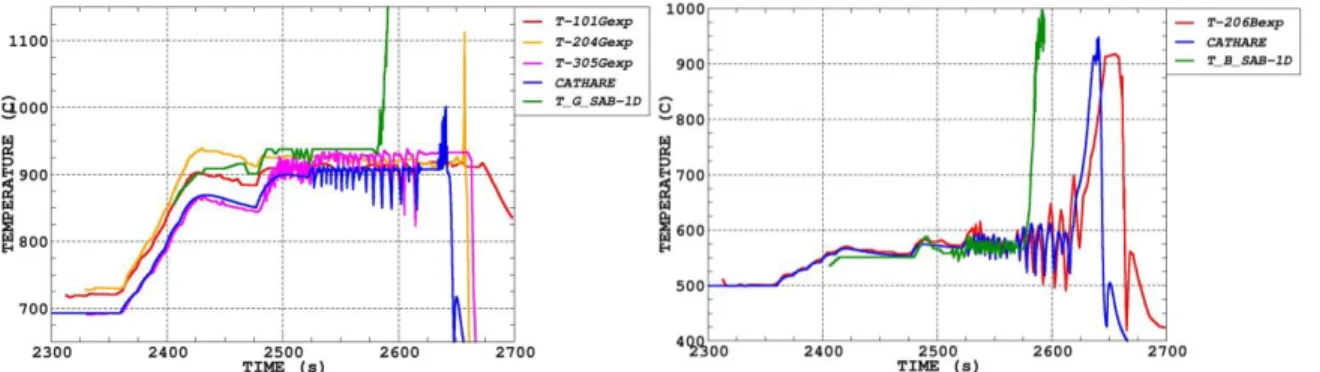
Figure 5 shows, for the same test, the evolution of the pin temperature at G plane (11.3mm from the end of the heated length) and B plane (243.4mm under G plane). For the first evolution, temperature measurements have been collected on several radial rings: T-10x stands for the central rod, T-20x the first ring of pins, and T-30x the second one. The data for the last ring (T-40x) is missing. The two figures show the capacity of CATHARE code to reproduce the temperature evolution, considering its 1-D limitation (average on the whole section). Besides, these results explain why CATHARE doesn’t reproduce the first oscillations in Figure 4: during that step, temperatures may not have reached the saturation on the whole G section yet. The outer ring which represents a quite big volume of sodium is probably not yet boiling but the boiling area is high enough to have impact on the inlet flow. However CATHARE, which calculates an average temperature over the whole section doesn’t reach the saturation temperature yet (even if it is very close) so the flow rate is not disturbed yet. CATHARE reproduces quite well the wall re-wetting during chugging and the wall temperature raise at dry out (cf. Fig. 5).
Figure 5: Pin temperatures during LHF-123 test at G plane (left) and B plane (right). Comparison between CATHARE-3 rev3 calculations (in blue), SABENA-1D calculations (in green) and
experiment
Figure 6 presents the sodium temperature evolution between the two most external rings of pins (left) and the wrapper external temperature evolution (right). Those results give confidence on the evaluation of heat losses.
Figure 6: Temperature evolution during LHF-123 test. Sodium temperature (left) and wrapper external temperature (right) at J plane. Comparison between CATHARE-3 rev3 calculations (in
blue) and experiment (in red)
A comparison between revision-1 and revision-3 of CATHARE code has been made on LHF-123 test. Figure 7 shows the inlet velocity calculation with revision-1. The chugging behavior is not reproduced:
the friction is too high at boiling onset and the critical heat flux is quickly reached. Revision-2 gives a similar trend to revision-1 which emphasizes the idea that fluid mechanic models are of first influence ahead of thermal models on these situations. It is actually not so surprising since with both revisions, liquid and vapor temperatures remain particularly close to saturation temperature.
Figure 7: Inlet velocity during LHF-123 test. Comparison between CATHARE-3 rev1 calculations (in blue), SABENA-1D calculations (in green) and experiment (in red)
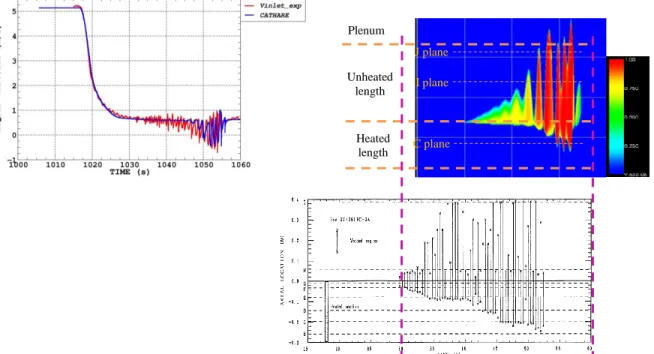
FC-34 LOF test has also been reproduced with CATHARE-3 revision-3 code. Figure 8 compares CATHARE results and experimental data as regards inlet liquid velocity and void fraction progression within the test section during the transient (colors tags void fraction amplitude, from blue for monophasic liquid to red for monophasic vapor).
Figure 8: Inlet velocity (left) and void fraction map (right) during FC-34 test. Comparison between CATHARE-3 rev3 calculations (in blue, top) and experiment (in red, bottom)
Plenum Heated length Unheated length J plane C plane I plane
One can consider that a good matching is achieved for the inlet velocity at the end of the transient: CATHARE is able to reproduce the general flow redistribution trend as well as the superposed dynamic instabilities (similar amplitude and frequency). However, chugging starts later according to CATHARE, again due to the miss of local boiling events by the code. Additionally, one can notice that the experimental void fraction map stops at the I plane. This map was built from the sodium temperature measurements at each instrumented plane: the void fraction did not reach the J plane but could have reached any z location between I and J planes, which are actually quite far from each other. CATHARE calculates in turn some void fraction up to J plane (and even sometimes above). An explication could be the experimental existence of a local but strong heat loss between the two planes, not modeled in CATHARE: this could be in line with the electromagnetic flowmeter position, which was indeed located just under the J plane (supposing a lack of insulating material).
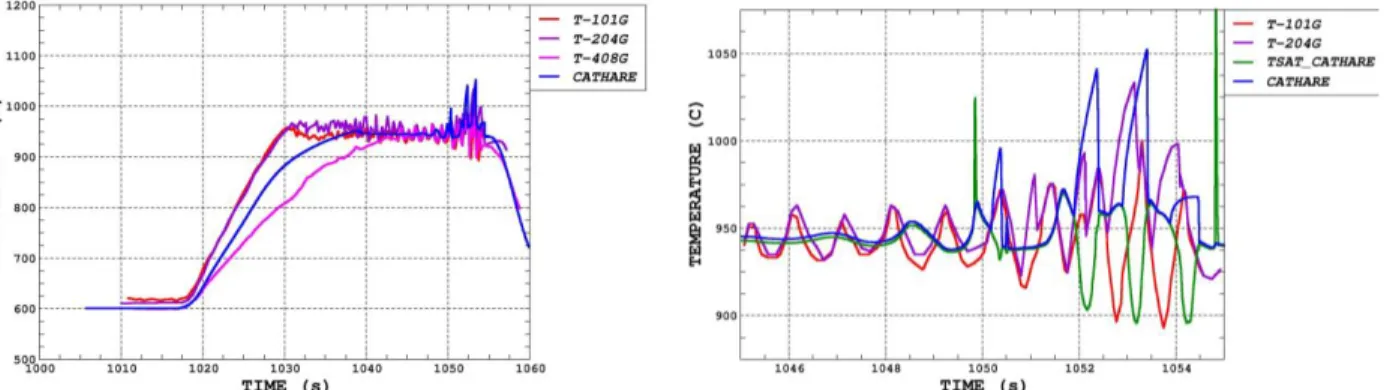
On Figure 9, the pin temperature measured at G plan during FC-34 experiment is compared to CATHARE calculation. One can see on the left graph that the calculated temperature follows the experimental trend. The right graph, which is a zoom, provides more details: CATHARE is able to calculate temporary dry outs and concomitant chugging events: dry out occurs on T-204 pin (purple line) while other pins are still cooled down by the liquid and therefore remains at the coolant saturated temperature (red line). In the same way, when looking at CATHARE results, the blue line, which represents the wall temperature, deviates from the green line, which represents the saturation temperature. The latter is dynamically changing accordingly to pressure oscillations (chugging). Amplitude and frequency of both events are additionally similar to the measured ones.
Figure 9: Pin temperatures at G plane during FC-34 whole transient (left) and zoom (right). Comparison between CATHARE-3 rev3 calculations (in blue, and saturation temperature in green)
and experiment
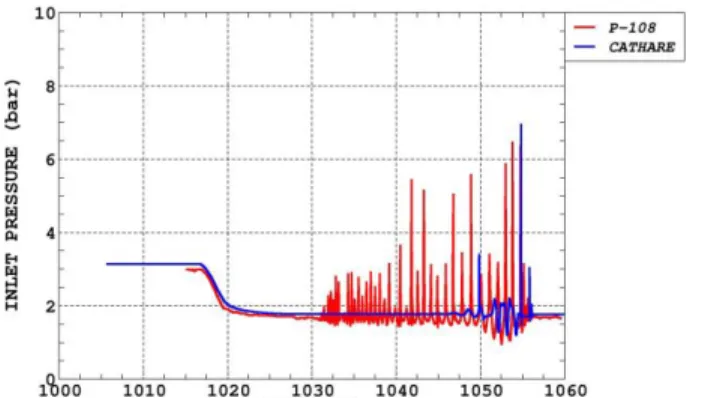
Figure 10 shows the experimental inlet pressure evolution and the comparison with CATHARE calculation. One can notice that substantial pressure peaks are monitored during the transient, due to chugging phenomenon. Especially, they appear at the moment where the vapor collapses. In CATHARE, this phenomena happens only three or four times (cf. Fig. 9) and the code captures each time the corresponding peaks. Their amplitude seems quite similar to the measured one but one should stay cautious on these data since the measurement frequency is not known and peaks are very brief: the real peaks could have been truncated.
Figure 10: Inlet pressure during FC-34 test. Comparison between CATHARE-3 rev3 calculations (in blue) and experiment (in red)
Finally, the FC-21 test has been simulated by CATHARE-3 revision-3 to check the code ability to obtain stable boiling after a LOF transient at 4.5kW/pin (which is not much under the power of the LHF-123 step for which dry out occurred). Figure 11 compares CATHARE calculation and measurement of the inlet velocity and confirms that CATHARE does reproduce a stable boiling behavior.
This test has also been simulated with SOCRAT-BN code at IBRAE [16]. The test section was modeled in two dimensions but the transient was simulated in adiabatic conditions. The results show very big oscillations (with flow reversals) and the benefit of 2-D description over 1-D description was not highlighted by these results.
Figure 11: Inlet velocity during FC-21 test. Comparison between CATHARE-3 rev3 calculations (in blue) and experiment (in red)
As a conclusion, simulations of some SIENA-37 tests with CATHARE-3 revision-3 have provided very encouraging results: in particular, a consistency is obtained between power levels and the shift from a stable to instable phenomenology. Besides, the calculated dynamic instabilities (typically, temperature and flow rate oscillations) are quite similar to the experimental signals, once the test turns to one dimensional behavior. This qualification work shows a significant gain of revision-3 compared to revision-1 on the quasi-static tests. This tends to validate the chosen friction models for low quality flow. But those results also show some limits of CATHARE current models, especially concerning the prediction of dry-out occurrence (at high vapor quality flow).
Additionally, thanks to revision-1 and revision-2 of CATHARE-3, SABENA and CATHARE thermal exchange models have been compared on SIENA experiments. It appeared that the results obtained with
revision-1 and revision-2 were very close. Then, it seems that, on those conditions, fluid mechanic models are of first order compare to thermal exchange models.
However, one has to keep in mind that some parameters, like thermal losses, structure inertia and electrical resistivity, strongly impact sodium boiling behavior. The assumptions sometimes made on those parameters to cope with the lack of data, could hide some distortions in the thermal exchange models, for example regarding condensation model, flashing model or dry out criterion.
4. CONCLUSIONS
This paper has highlighted the significant progress made for the development of CATHARE-3 which features some two-phase flow Na modeling. Indeed, in spite of some limitations of the code (such as 1-D modeling), qualification on SIENA-37 experiments which featured various phenomenology, including complex chugging phenomenon, has been considered as successful. Especially, the implementation in revision-3 of CATHARE-3 of the wall friction law recently developed on the SENSAS air/water program has been proved as very capable for Na boiling applications.
While those results are very encouraging, one has to keep in mind that some important work remains to be done: for instance, fluid mechanics modeling in the high quality range have been evidenced to deserve further development; the qualification process in sodium has to be done on a geometry that provides some key characteristics from Gen IV subassembly design. To achieve so, new experimental programs are proposed, both in air/water and in Na since such strategy has been proved as very efficient. Air/water tests afford taking into account geometrical effects at full scale as well as implementing a sophisticated instrumentation that opens mechanistic modeling possibilities. Na experiments are for sure mandatory to take into account dynamic effects due to bubble generation and collapse, to which is connected pressure peaks occurrence. For the latter, special attention will have to be paid for a better mastering of some boundary conditions, such as heat losses, which were shown to alter the reliability of the simulations.
REFERENCES
[1] N. Alpy, et al. "Phenomenological Investigation of Sodium Boiling in a SFR Core during a postulated ULOF Transient with CATHARE 2 System Code: a Stabilized Boiling Case", Journal of Nuclear Science and Technology, vol. 53 (5), p. 692-697, 2015.
[2] J. M. Seiler et al., "Sodium boiling stabilisation in a fast breeder subassembly during an unprotected loss of flow accident", Nuclear Engineering and Design, vol. 240, p. 3329–3335, 2010.
[3] D. Tenchine, "Status of CATHARE code for sodium cooled fast reactors", in Nuclear Engineering and Design, vol. 245, p. 140-152, 2012.
[4] D. Bestion, "The physical closure laws in the CATHARE code", Nuclear Engineering and Design, vol. 124, no. 3, p. 229-245, 1990.
[5] R. Lockhart and R. Martinelli, "Proposed correlation of data for isothermal two phase, two component flow in pipes", Chemical Engineering progress, vol. 45, 1949.
[6] H. M. Kottowski, "Liquid metal thermal hydraulics", Freiburg: Inforum Verlag, 1994.
[7] Skupinski E. et al., "Détermination des coefficients de convection d’un alliage sodium–potassium dans un tube circulaire", International Journal of Heat and Mass Transfer, vol. 8, p. 937–951, 1965. [8] H. Ninokata, "Six equation two phase flow model code SABENA for sodium boiling simulation", in
Grenoble, 11th meeting of the liquid metal boiling working group, 1991.
[9] J. Perez et al., "CATHARE 2 simulations of steady state air/water tests performed in a 1:1 scale SFR sub-assembly mock-up", Annals of nuclear Energy, vol. 83, p. 283-297, 2015.
[10] A. Chenu, "Single- and Two-Phase Flow Modeling for Coupled Neutronics / Thermal-Hydraulics Transient Analysis of Advanced Sodium-Cooled Fast Reactors", EPFL thesis, Lausanne, 2011.
[11] P.R.H. Blasius, "Das Aehnlichkeitsgesetz bei Reibungsvorgangen in Flüssigkeiten", Mitteilung 131 über Forschungsarbeiten auf dem Gebiete des Ingenieurwesens, p. 1-41, 1913.
[12] K. Rehme, "Pressure drop correlations for fuel element spacers", Nuclear Technology, vol. 17, no. 1, p. 1973, 1973.
[13] M. Anderhuber et al., “Simulation of GR19 sodium boiling experiments with CATHARE-2 system code and TRIO_U MC subchannel code”, NURETH-16, Chicago, USA, Aug 30-Sept 4, paper 13017, 2015.
[14] K. Haga, "Decay heat removal under boiling condition in a pin-bundle geometry", in 9th meeting of the liquid metal boiling working group, 1980.
[15] K. Haga, "Sodium Boiling Experiment in a 37-Pin Bundle under Loss-of-Flow Conditions", in 10th meeting of the liquid metal boiling working group, 1982.
[16] Y. Y. Vinogradova, "SOCRAT-BN simulation of SIENA Loss Of Flow experiments", NURETH-16, Chicago, USA, Aug 30-Sept 4, paper 5989, 2015.
[17] H. Ninokata, "Analysis of low-heat-flux sodium boiling test in a 37-pin bundle by the two-fluid model computer code SABENA", Nuclear Engineering and Design, vol. 97, p. 233-246, 1986.