HAL Id: hal-02324370
https://hal.archives-ouvertes.fr/hal-02324370
Submitted on 1 Nov 2019
HAL is a multi-disciplinary open access
archive for the deposit and dissemination of
sci-entific research documents, whether they are
pub-lished or not. The documents may come from
teaching and research institutions in France or
abroad, or from public or private research centers.
L’archive ouverte pluridisciplinaire HAL, est
destinée au dépôt et à la diffusion de documents
scientifiques de niveau recherche, publiés ou non,
émanant des établissements d’enseignement et de
recherche français ou étrangers, des laboratoires
publics ou privés.
Methodology for Analysis of Electrical Breakdown In
Micrometer gaps in Tip-To-Plane Configuration
Kemas Tofani, Jean-Pascal Cambronne, Sorin Dinculescu, Ngapuli Sinisuka,
K Makasheva
To cite this version:
Kemas Tofani, Jean-Pascal Cambronne, Sorin Dinculescu, Ngapuli Sinisuka, K Makasheva.
Method-ology for Analysis of Electrical Breakdown In Micrometer gaps in Tip-To-Plane Configuration. 2018
IEEE 13th Nanotechnology Materials and Devices Conference (NMDC), Oct 2018, Portland, United
States. pp.1-4, �10.1109/NMDC.2018.8605855�. �hal-02324370�
Methodology for analysis of electrical breakdown in
micrometer gaps in tip-to-plane configuration
Kemas M Tofani LAPLACE, Université de Toulouse,
CNRS Toulouse, France Bandung Institute of Technology
Bandung, Indonesia PT. PLN Jakarta, Indonesia kemas_m_tof@yahoo.co.id
Ngapuli I. Sinisuka Bandung Institute of Technology
Bandung, Indonesia n_sinisuka@yahoo.com
Jean-Pascal Cambronne LAPLACE, Université de Toulouse,
CNRS Toulouse, France cambronne@laplace.univ-tlse.fr
Kremena Makasheva LAPLACE, Université de Toulouse,
CNRS Toulouse, France makasheva@laplace.univ-tlse.fr
Sorin Dinculescu LAPLACE, Université de Toulouse,
CNRS Toulouse, France dinculescu@laplace.univ-tlse.fr
Abstract—Better understanding of the electrical behavior of
miniaturized electrical devices is largely supported by the need to reduce losses and to prevent operational failure caused by electrical breakdown or electrical discharge. In large scale electrode separation, the breakdown voltage is well described by the Paschen’s law. However, when the inter-electrode gaps are below 10 µm a departure from the Paschen’s law is observed. The current research is focused on development of methodology for analysis of the electrical breakdown behavior in micrometer gaps and the description of the underlying mechanisms. The experiments were performed for inter-electrode gaps from 1 µm to 10 µm by using piezoelectric system to control the separation in tip-to-plane configuration for which a divergence of the electric field is imposed. The obtained results show that the field electron emission enhanced by the thermionic emission becomes the main mechanism for electrical breakdown under the above conditions.
Keywords— Paschen’s law, electrical breakdown, field emission, thermionic emission, PVD process
I. INTRODUCTION
The reliability problem of insulation gaps under high electric field becomes of primary importance to the engineers and researchers when reducing the device dimensions. For large scale inter-electrode separations, the breakdown voltage is successfully described by the Paschen’s law which traces the dependence of breakdown voltage on p d product, with p, gas pressure and d, inter-electrode distance [1]. When the electrical breakdown is given by the Paschen’s law, i.e. only on the basis of Townsend mechanisms (ionization in the volume and secondary electron emission), higher breakdown voltages are expected for small gaps (less than few micrometers in air). However, some papers report that the measured breakdown voltages differ from the estimated from Paschen’s law values when the gaps are below 10 µm [2]–[5].
The theoretical description of the departure from Paschen law in micrometer-size gaps at atmospheric pressure has been the focus of several studies in the years [6]–[10]. The breakdown voltage in gases is generally due to the contribution of two processes, first, the ionization of gas atoms (molecules) by electron collisions and the secondary
electron emission process by ions bombardment on the cathode. To describe the breakdown process in small inter-electrode distances additional mechanisms have been suggested: (i) when the electric field between the two electrodes is high enough, electrons are extracted locally from the sharpest points of the surface due to the field electron emission leading to a lower voltage for breakdown, and (ii) the field emission current from the cathode produces a small number of ions which create space charge field and thus increase the electron emission [6].
In general, the electrical breakdown is defined by the combined effect of quite a lot of parameters: nature of the gas, pressure, inter-electrode distance, cathode material, in particular its work function, surface roughness, temperature, etc. To gain better understanding of the phenomena at play on the left branch of the Paschen curve, i.e. for small inter-electrode distances, a methodology for analysis of electrical breakdown in micrometer gaps in tip-to-plane configuration has been developed and is presented in this paper. It consists in an experimental study and involves variation of many of the above given electrical breakdown parameters. It offers the possibility of description of the underlying mechanisms. Knowledge on the breakdown voltage behavior in microgap distances at different pressures, from few tens of Pa up to atmospheric pressure, is extremely useful for designing electric power subsystem components in aircraft applications operating at as low as 10% of atmospheric pressure.
II. EXPERIMENNTAL SET UP
A. Schematic Design and Apparatus
The experimental arrangement represents an improved version of a recently developed system in LAPLACE laboratory [11]. A schematic design of the experimental set-up is given in Fig. 1. The electrode configurations consist of a controlled radius needle facing a metallized plate, thus
forming tip-to-plane geometry. The needle is connected to a
source meter (Keithley 2410) DC power supply that can provide DC voltage up to 1100 V, and then connected to series resistance of 94 kΩ, to limit the breakdown current. The positive voltage is applied to the tip electrode and the plate electrode is grounded. The current is measured by an ammeter. The background noise was estimated to about
60pA. Breakdown is detected by an oscilloscope Tektronix DPO 4054, which uses current probe with CT 5mV/mA. Two types of linear stages are used to position the anode. The first one is a x-y linear stage. This linear stage has travel range of 13 mm with precisions of 2 μm/25 of travel. The second one is a micro positioner piezo-actuator, PI Hera 621.UD, which can move with maximum resolution of 0.4 nm and has travel range of 100 µm. Considering noise and accuracy of the piezo-actuator itself, as well as other conditions in the environment, the final accuracy of the distance estimation is better than 20 nm. The anode (needle) and the cathode (plate) are placed on a marble plate to avoid vibrations and to limit linearity errors when the piezo-actuator is under movement. The experiments are conducted in a chamber under vacuum for the low pressure measurements, whereas, the measurements under 1 atm pressure are performed in air and environmental contamination.
The experiment consists of measurements of the electrical breakdown between the needle or tip as anode, made by tungsten and a plate as cathode for which two different metals (Au and Cu) were used. The cathode has been manufactured in-house and polished to a good finish under vacuum conditions. The plate electrode is made by Physical Vapor Deposition (PVD) by using DC-sputtering over a glass substrate. The thickness of the metal layer is 300 nm and 600 nm for Au and Cu, respectively. The measured by surface profile meter (KLA Tencor Alpha-Sup IQ) roughness of the cathode is Rq = 1.12 nm (Rq is the root
mean squared).
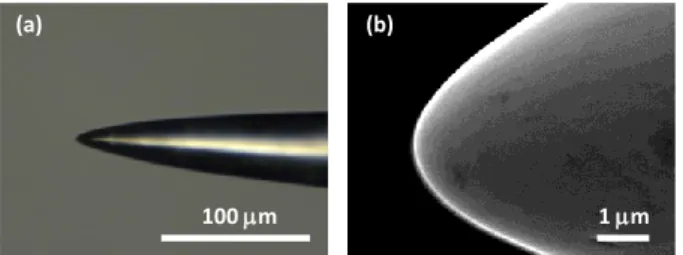
The needle electrode is 38 mm long with different tip radii: 1 µm, 10 µm, and 25 µm. Before use each needle is
observed by Keyence VHX-1000 digital microscope to measure the tip curvature radius and by Scanning Electron Microscopy (SEM) for the surface aspect (Fig. 2). The aim of using various tip radii for the anode is to observe the induced effect of divergent electrical field on the electrical breakdown.
B. Measurement procedure
The measurements are performed according two protocols, established for accuracy. The first protocol concerns the definition of contact between the two electrodes, which actually settles the zero distance. The second protocol defines the breakdown voltage. The chosen separation gap is achieved by fixing one of the electrodes, while the other one is moving continuously on micrometer scale. The plate electrode (cathode) is mounted on the x-y linear stage and the needle electrode (anode) is fixed on the piezo-actuator (Fig. 1). In the beginning, the x-linear stage approaches the needle electrode until attaining a position in the range of the micro positioner piezo-actuator. Then the circuit is closed and a low voltage of 2 V is applied. After that the needle electrode is gradually moved towards the plate electrode by the piezo-actuator with incremental of 100 nm until contact. The criterion for contact is selected as follows: the contact is considered when the current flow in the circuit reaches the compliance setting of the source meter. When the contact is detected, the corresponding position is adopted as the origin of the distance for discharge gap length, i.e. d = 0 m. After determining the zero point the anode is drawn back to the chosen position. A low voltage is applied to the circuit and then the applied voltage is increased incrementally by 1 V until the recorded current reaches the threshold breakdown value. After the breakdown event, the plate surface is shifted of ± 0.7 mm by the y-linear stage, so that each breakdown occurs in a new place on the plate electrode. Time shift of 2 to 3 min is applied between two breakdowns to reduce the effect of thermal expansion of the electrodes. The breakdown voltage is determined by averaging over several measurements in the same conditions. Immediately after breakdown the supply source is switched off in order to limit degradation of the electrodes. The breakdown voltage is measured for electrode gaps starting from 1 up to 10 µm. Measurements were conducted under the following conditions: ambient air (room temperature, 23°C, and atmospheric pressure, 101 kPa) and two low
pressures (1 kPa and 10 kPa); without gas injection.
III. RESULTS AND DISCUSSIONS
A. Breakdown Voltage at Atmospheric Pressure
Electrical breakdown measurements started at
atmospheric pressure conditions (T = 23°C, p = 101 kPa)
with open air (not inside the chamber). The typical relation between the breakdown voltage and the inter-electrode distance observed at atmospheric pressure in the tip-to-plane configuration is given in Fig. 3. Three characteristic regions of the breakdown voltage can be distinguished. The first region is for distances larger than 7 µm, for which the breakdown voltage increases with the gap distance increase. This region corresponds to right-side branch of the Paschen law. It describes the typical situation in which the breakdown in the gas occurs due to the Townsend avalanche mechanism. The second region consists of a plateau region, spanning between 4 µm and 7 µm. The breakdown voltage remains constant for the inter-electrode distances in this region. For
à Axe Unique - Centre Métrique 32mm Gap Additional support sample Pack anode Piezo Actuator Base supporting
à Axe Unique - Centre Métrique 32mm VDC 94 kΩ A Camera/ microscope Source meter Amp meter Vacuum Chamber oscilloscope
Fig. 1. Schematic design of the experimental set-up.
Fig. 2. (a) Optical macroscopy image of the tungsten needle of curvature radius of 10 m, (b) Surface aspect of the same needle observed by SEM.
100 m (a)
1 m (b)
inter-electrode distances shorter than 4 µm the breakdown voltage decreases strongly, by a factor of 2. It is not possible to consider only the Townsend avalanche mechanism for the breakdown occurrence in this third region. Electrons released from the cathode due to the field electron emission are the additional source to reach breakdown.
Solving the Poisson’s equation for the tip-to-plane electrode configuration considered in the current study gives electric field strengths on the cathode in the order of ~108 V/m with possibility to reach 109 V/m (Fig. 4), if local electric field amplification is accounted for by the geometric factor. This electric field strength is high enough to draw electrons from cathode surface.
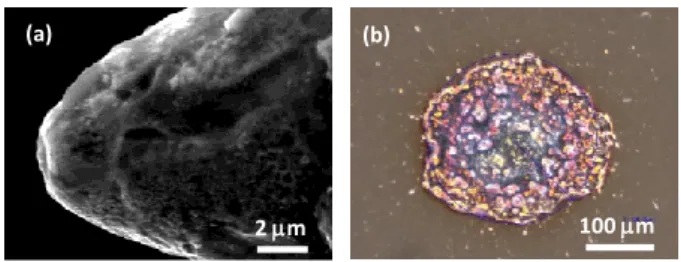
Another important aspect of the study is the observation of severe damages of the electrodes after several measurements. The surface of the used electrodes is modified due to the electrical breakdown. The high current density causes a strong increase of the temperature of the electrodes which in turn leads to a release of metal vapors and damages the electrodes, as can be observed on Fig. 5. The curvature radius remains the same but the surface of the anode (Fig. 5a) is not as smooth as before the breakdown (Fig. 2b). One can observe a lot of asperities, which are signature of thermal induced modification. As far as the cathode is concerned the thermal induced damages are also severe (Fig. 5b). The trace is circular in shape and its diameter depends on the curvature radius of the tip. In addition one can see the protrusion of matter due to the melting of the metal during the breakdown.
The temperature of the electrodes increases in time. The evaporation of metal atoms from the electrode surface, heated by the current, triggers the electrical breakdown. This situation suggests that the thermionic emission enhances the field electron emission [9], [10], thus contributing to the electrical breakdown.
B. Breakdown for Different Radius of Tip Anode
It is currently understood that for smaller curvature radii of the cathode the electric field on the cathode is higher which contributes to lower breakdown voltage. But instead, there is no explanation about the effect of various curvature radii when the tip electrode is anode. The relation between various curvature radii of the tip anode and the breakdown voltage at atmospheric pressure can be seen in Fig. 6.
In contrary to the case when the tip electrode is a cathode when the tip electrode is an anode a higher voltage is required for the breakdown for smaller curvature radii of the tip. This can be understood in terms of homogeneity of the electric field in the inter-electrode distance. When the curvature radius of the tip anode is much greater than gap distance between the electrodes (Rc >> d), the electrode
configuration is similar to plan-to-plan for which the electric field can be considered homogeneous. Electrons flow from cathode and reach the anode travelling the same distance. It is different if the radius tip anode is smaller than the inter-electrode distance (Rc << d). The electric field is higher close
to the anode and the release of electrons from the anode is reduced which requires a higher voltage for breakdown. Edge type breakdown is also a possible mechanism. The electrons drift to the anode reaching the edges of the anode. The edge of anode is not the shortest distance between the electrodes. It leads to an increase of the breakdown voltage. C. Breakdown Voltage for Different Metals
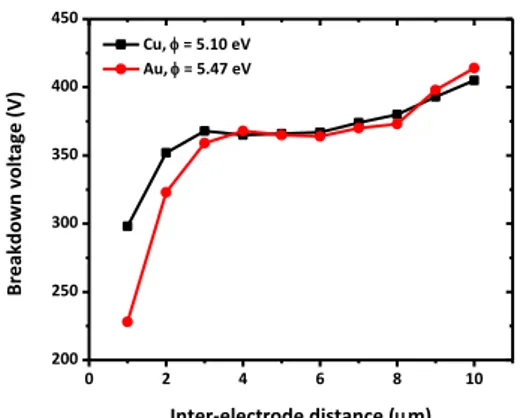
Fig. 7 shows the relation of the breakdown voltage with the metallic nature of the cathode through the work function
0 2 4 6 8 10 150 200 250 300 350 400 450 Bre ak d ow n v olt ag e ( V ) Inter-electrode distance (m) r = 25 µm
Fig. 3. Relation between breakdown voltage and distance in micrometer separation. 0 2 4 6 8 10 0 1 2 3 4 El ec tr ic fiel d ( 10 8 V/ m ) Inter-electrode distance (m) |E| anode |E| cathode
Fig. 4. Electric field strength calculations.
Fig. 5. Electrodes surface after breakdown: (a) SEM image of the needle (anode), (b) optical image of the plate (cathode).
2 m (a) 100 m (b) 0 2 4 6 8 10 150 200 250 300 350 400 450 Bre ak d ow n v olt ag e ( V ) Inter-electrode distance (m) r = 1 µm r = 10 µm r = 25 µm
for two metals: Au and Cu used in this study. The work function corresponds to the minimum energy required to release an electron from a solid. The work functions of Au and Cu are 5.47 eV and 5.1 eV, respectively [12]. Lower value of the work function contributes to lower breakdown voltage. Given the small difference of the work functions of the two metals, of only 0.37 eV, this effect is not clearly observable in Fig. 7 for interelectrode distances larger than 4 µm. However, there is an anomalous effect observed in the field emission region, i.e. for d < 4 µm. The breakdown voltage for Au-cathode is lower than for Cu-cathode, although the Au-work function is higher. The reason of this phenomenon is most likely because impurities on the cathode surface or formation of thin cooper oxide film. Because of the oxide layer film on copper cathode a higher electric field is required to release electrons from surface.
D. Breakdown Voltage for Various Pressures
In this part the measurements were conducted under various pressures: 1 kPa, 10 kPa and 101 kPa.
As can be seen in Fig. 8, the breakdown voltage slightly decreases linearly with the decrease of the gap distance between the electrodes. It is different if compared to atmospheric pressure where three well distinguished regions are observed. The required voltage for breakdown is higher for lower pressure. Decreasing the pressure leads to a decrease of the density of gas atoms/molecules in the volume. As a consequence the collision frequency for ionization is decreased. Finally, higher applied voltage is required to eject electrons from the cathode surface in order to compensate the reduced ionization in the volume.
IV. CONCLUSSIONS
Departure from the Paschen’s law for electrical breakdown in micrometer gaps in tip-to-plane configuration is observed. At atmospheric pressure conditions, three well distinguished regions are identified. For inter-electrode distances larger than 7 µm the breakdown voltage follows the Paschen’s law. Inter-electrode distances between 4 and 7 µm, where a plateau in the breakdown voltage is observed, can be considered as transition region corresponding to the minimum value of the Paschen curve. For inter-electrode distances smaller than 4 µm the breakdown voltage is much lower than the one required by the Paschen’s law, i.e. a departure from the Paschen’s law is observed. In this region the main mechanism of breakdown is the field electron emission enhanced by thermionic emission. Severe damages are observed for both electrodes after several breakdowns due to the increase of the temperature. The geometrical features of the anode contribute to the different values of the breakdown voltage based on the created electric field lines. The electrical breakdown is also influenced by the cathode material, through the work function.
REFERENCES
[1] I. P. Raĭzer, Gas discharge physics. Berlin ; New York: Springer, 1997.
[2] J.-M. Torres and R. S. Dhariwal, “Electric field breakdown at micrometre separations,” Nanotechnology, vol. 10, no. 1, pp. 102– 107, Mar. 1999.
[3] T. Ono, D. Y. Sim, and M. Esashi, “Micro-discharge and electric breakdown in a micro-gap,” J. Micromechanics Microengineering, vol. 10, no. 3, pp. 445–451, Sep. 2000.
[4] P. G. Slade and E. D. Taylor, “Electrical breakdown in atmospheric air between closely spaced (0.2 μm-40 μm) electrical contacts,” IEEE Trans. Compon. Packag. Technol., vol. 25, no. 3, pp. 390–396, Sep. 2002.
[5] A. Peschot, N. Bonifaci, O. Lesaint, C. Valadares, and C. Poulain, “Deviations from the Paschen’s law at short gap distances from 100 nm to 10 μ m in air and nitrogen,” Appl. Phys. Lett., vol. 105, no. 12, p. 123109, Sep. 2014.
[6] P. Kisliuk, “Electron Emission at High Fields Due to Positive Ions,” J. Appl. Phys., vol. 30, no. 1, pp. 51–55, Jan. 1959.
[7] M. Radmilović-Radjenović and B. Radjenović, “Theoretical study of the electron field emission phenomena in the generation of a micrometer scale discharge,” Plasma Sources Sci. Technol., vol. 17, no. 2, p. 024005, May 2008.
[8] D. B. Go and D. A. Pohlman, “A mathematical model of the modified Paschen’s curve for breakdown in microscale gaps,” J. Appl. Phys., vol. 107, no. 10, p. 103303, May 2010.
[9] D. B. Go and A. Venkattraman, “Microscale gas breakdown: ion-enhanced field emission and the modified Paschen’s curve,” J. Phys. Appl. Phys., vol. 47, no. 50, p. 503001, Dec. 2014.
[10] K. Makasheva, C. Villeneuve-Faure, C. Laurent, B. Despax, L. Boudou, and G. Teyssedre, “Dielectric charging by AFM in tip-to-sample space mode: overview and challenges in revealing the appropriate mechanisms,” Nanotechnology, vol. 26, no. 29, p. 295704, Jul. 2015.
[11] G. T. Anuraga, J.-P. Cambronne, S. Dinculescu, N. I. Sinisuka, and K. Makasheva, “A contribution to breakdown voltage characteristics in air for inter-electrode distances 1–10 μm at various pressures,” in Book Series: IEEE Nanotechnology Materials and Devices Conference (IEEE NMDC 2016), 2016, vol. 1, pp. 1–2.
[12] D. R. Lide ed., CRC Handb. Chem. Phys., Boca Raton, FL: CRC Press., 89th rev. edn, 2005.
0 2 4 6 8 10 200 250 300 350 400 450 Bre ak d ow n v olt ag e ( V ) Inter-electrode distance (m) Cu, = 5.10 eV Au, = 5.47 eV
Fig. 7. Breakdown voltages for Au- and Cu-cathodes.
0 2 4 6 8 10 300 350 400 450 500 Bre ak d ow n v olt ag e ( V ) Inter-electrode distance (m) 1 kPa 10 kPa 101 kPa