HAL Id: hal-03118496
https://hal.uca.fr/hal-03118496
Preprint submitted on 22 Jan 2021
HAL is a multi-disciplinary open access
archive for the deposit and dissemination of sci-entific research documents, whether they are pub-lished or not. The documents may come from teaching and research institutions in France or abroad, or from public or private research centers.
L’archive ouverte pluridisciplinaire HAL, est destinée au dépôt et à la diffusion de documents scientifiques de niveau recherche, publiés ou non, émanant des établissements d’enseignement et de recherche français ou étrangers, des laboratoires publics ou privés.
Grégoire Rota-Graziosi, Fayçal Sawadogo
To cite this version:
Grégoire Rota-Graziosi, Fayçal Sawadogo. The tax burden on mobile network operators in Africa. 2021. �hal-03118496�
S U R L E D E V E L O P P E M E N T I N T E R N A T I O N A L
SÉRIE ÉTUDES ET DOCUMENTS
The tax burden on mobile network operators in Africa
Grégoire Rota‐Graziosi
Faycal Sawadogo
Études et Documents n°4
January 2021
To cite this document:
Rota‐Graziosi G., Sawadogo F. (2021) “The tax burden on mobile network operators in Africa”,
Études et Documents, n°4, CERDI.
CERDI PÔLE TERTIAIRE 26 AVENUE LÉON BLUM F‐ 63000 CLERMONT FERRAND TEL. + 33 4 73 17 74 00 FAX + 33 4 73 17 74 28 http://cerdi.uca.fr/
2
The authors
Grégoire Rota‐Graziosi
Professor in economics, Université Clermont Auvergne, CNRS, CERDI, F‐63000 Clermont‐
Ferrand, France.
Email address: gregoire.rota‐graziosi@uca.fr
Faycal Sawadogo, PhD student in economics, Université Clermont Auvergne, CNRS, CERDI, F‐
63000 Clermont‐Ferrand, France.
Email address: faycal.sawadogo@uca.fr
Corresponding author: Grégoire Rota‐Graziosi
This work was supported by the LABEX IDGM+ (ANR‐10‐LABX‐14‐01) within the program “Investissements d’Avenir” operated by the French National Research Agency (ANR).
Études et Documents are available online at:
https://cerdi.uca.fr/etudes‐et‐documents/
Director of Publication: Grégoire Rota‐Graziosi
Editor: Catherine Araujo‐Bonjean
Publisher: Aurélie Goumy
ISSN: 2114 ‐ 7957
Disclaimer:
Études et Documents is a working papers series. Working Papers are not refereed, they constitute research in progress. Responsibility for the contents and opinions expressed in the working papers rests solely with the authors. Comments and suggestions are welcome and should be addressed to the authors.
3
Abstract
We estimate the tax burden on the mobile telecommunication sector in twenty‐five African
countries. This tax burden encompasses not only standard and particular taxes under the
control of the Ministry of Finance (MoF), but also fees raised by national telecommunication
Regulatory Agency (RA). Given the lack of financial data at the country level, we build a
representative mobile network operator, named TELCO, using the GSMA Intelligence
database. We compute the Average Effective Tax Rate (AETR) for this firm considering general
and special taxes and fees levied only on the telecommunication sector. We develop a web
application (https://data.cerdi.uca.fr/telecom/), which allows the reader to replicate our
analysis or to modify TELCO and tax parameters. The AETR varies significantly across countries,
ranging from 33 percent in Ethiopia to 118 percent in Niger. Special taxes and fees represent
a large share of the AETR illustrating some taxation by regulation and a potential tax
competition (a race to the top) between the MoF and the RA. We compare the AETR of TELCO
to this of a representative gold mining plant and a standard firm with similar gross return. The
tax burden of the telecommunication sector is higher than this of the mining sector in 15
countries out of the 19 countries for which we have data on the gold mining sector.
Keywords
Taxation, Telecommunication sector, Project analysis, Developing countries.
JEL Codes
H25, L96, O22, O55.Acknowledgements
We acknowledge financial support from the Agence Nationale de la Recherche of the French
government through the program “Investissements d’avenir” (ANR‐10‐LABX‐14‐01) and
GSMA, the global association of mobile telecommunications operators, in supporting the
research necessary to explore the themes canvassed in this paper. However, the paper has
been written in full independence from GSMA and the expressed views are our own. We are
grateful to Vassilis Douzenis and Mani Manimohan for discussing preliminary version of this
paper and to Yannick Bouterige for providing us with the AETR of the gold mining sector and
Mohamed Tounkara who participates in designing the web application.
4
1 Introduction
The tax on internet voice calls such as WhatsApp, Skype and Viber triggered massive protests in Lebanon, which bring down the government. Several other countries especially in Sub Saharan Africa (Uganda, Zambia, Kenya) raised or tried to raise (Benin1) similar taxes. These experiments illustrate not only governments’ efforts to tax new bases, but also the politically sensitivity of some bases and the poor design of these taxes, which often take the form of a specific excise.2 Such taxes add up to a lot of others, which are particular to the telecommunication sector. This sector is yet one of the most dynamic economic sectors in sub-Saharan African countries. It participates to the economic development of this region by improving market efficiency (Aker and Mbiti, 2010). It has still a substantial capacity to grow further given that unique subscriber penetration remains low, at around 45 percent on average in Africa compared to more than 60 percent in other developing countries in 2017 (GSMA intelligence, 2018).
Despite the globalization process, the telecommunication markets remain highly fragmented with heterogeneous national regulations and tax systems. Several studies (e.g. Noll, 2000; Li, and Xu, 2004; Howard and Mazaheri, 2009; Faccio and Zingales, 2017) focus on the role of privatization, competition and regulation of the telecommunication sector in developing countries. In particular, Howard and Mazaheri (2009) consider internet use and mobile phone adoption in 154 countries over the period 1990-2007.3 They conclude that the independence of the Regulatory Agency (RA) reduces the “digital divide” in access to information and communication technologies. Bur, the full depoliticization and deregulation of the telecommunication sector have a negative effect. Beyond the studied regulation reforms (privatization, market liberalization, the independence of RA and its depoliticization), we stress here the role of taxation of this sector, which is particularly complex given the variety of special taxes and regulatory fees raised not only by the Ministry of Finance (MoF), but also by the Telecommunication RA. These two institutions may even compete in taxing the same base: the
1 The Decree 218-34 of July 25, 2018 raised a tax on the use of social media at a rate of 5 FCFA or equivalently USD 0.009 per
megabyte. Online and street protests push the government to cancel this tax a few month later.
2 The tax is specific when its base is a quantity (e.g. minutes, megabyte…).
3 In line with Henisz et al. (2005), they consider four policy reforms of the telecommunication sectors: the privatization of the
national telecommunication provider, the market liberalization allowing some competition among Mobile Network Operators (MNOs), the creation of an independent RA, and the depoliticization of the latter.
5
activity of Mobile Network Operators (MNOs). Such a tax competition can trigger a race to the top (an excessive taxation) as described by Berkowitz and Wei (2000) in the context of Russia and China or Keen and Kostiogiannis (2002) in federal States.
Our analysis participates to the debate regarding the adequate level of taxation that should apply to the sector. On one hand, some authors such as Matheson and Petit (2020) consider that mobile phone companies extract rents from operating their exclusive licenses. The tax regime applied to telecommunication sector should therefore follow a similar logic to the one applied to the extractive industries. On the other hand, others authors advocate on the merits of telecommunication firms to bridge the digital divide. They justify potential tax incentives, such as exemptions or reduced rates, which aim at improving the affordability of mobile phone devices and services (Mistry, 2005; GSMA, 2017). This debate is not particular to the telecommunication sector and reflects a well-known trade-off, prominent in developing countries, between fostering an economic activity through tax incentives and collecting tax revenues for public funding purposes. Our approach completes previous studies on the taxation of telecommunication, in particular these provided by GSMA Intelligence (Pedros and Sivakumaran, 2019) and the International Telecommunication Union (ITU, 2013). These works study the affordability of the mobile phone services especially in developing countries. Consequently, they focus mainly on indirect taxation such as Value Added Tax, excise, and special mobile networks taxes, such as fees or surtax on SMS, Sim cards, and international incoming calls. In contrast, we consider here all the taxes a firm has to pay to operate its mobile network license. These include direct taxation such as Corporate Income Tax (CIT) and some indirect taxes, which increase unambiguously the production cost of mobile phone services. We estimate the tax burden borne by mobile phone companies in some African countries. We compute the Average Effective Tax Rate (AETR), which summarizes the main taxes and fees paid by a MNO over the length of a telecommunication license (15 years by assumption). Our methodology follows the standard approach of forward-looking AETR through a representative firm (see Devereux and Griffith, 1998; Djankov et al., 2010; Steinmüller et al., 2019 for general economic activity; Daniel et al., 2010 for the extractive industry). Given the lack of public firms’ financial data, we build TELCO, a representative mobile phone company, using the GSMA Intelligence database. The financial data and economic activities of TELCO are expressed in terms of percentage of final consumption or subscribers for each country. We
6
consider the tax regime relevant in fiscal year 2018 over the length of a typical license period (15 years by assumption). Another assumption concerns the evolution of final consumption and mobile subscribers in each country over the 15 years license length. We choose to use observed data, rather than projected estimates. In other words, we consider the applicable tax regime for 2018 but use actual mobile market data from 2003 to 2018.4 Such assumptions allow us to determine the AETR given observed national mobile phone progress since 2003. We develop a web application (https://data.cerdi.uca.fr/telecom/) allowing not only the replication of our analysis, but also any modification of the parameters of TELCO or the studied national tax systems.
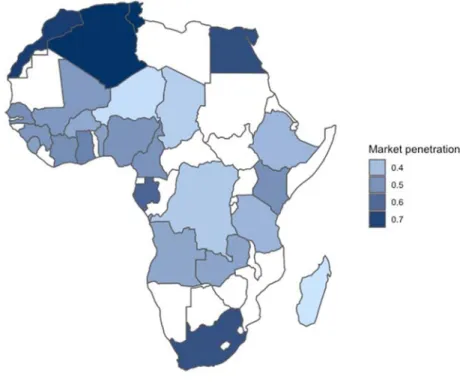
We study 25 African countries: Algeria, Angola, Benin, Burkina Faso, Cameroon, Chad, Cote d’Ivoire, DRC, Egypt, Ethiopia, Kenya, Gabon, Ghana, Guinea, Madagascar, Mali, Morocco, Niger, Nigeria, Senegal, Sierra Leone, South Africa, Tanzania, Tunisia, and Zambia. These countries represent 60 percent of Africa’s total GDP, 79 percent of the total population, and 81 percent of African unique subscribers in 2018. They differ in the development of their respective telecommunication sector.5 For instance, the 3G network coverage in 2018 varies from 31.6 percent in Mali to 99.2 percent in South Africa and the market penetration of mobile phone from 30.9 percent in Madagascar to 75.4 percent in Tunisia (see Figure 1).
4 TaxpayerCo has a constant activity expressed in terms of Gross National Income (GNI) per capita over the five years period. The
Fiscal Analysis of Resource Industries (FARI) model of the International Monetary Fund (IMF) considers a production plan, which can result from actual feasibility studies or an average estimation of extraction process. However, a weakness of this approach is the predicted commodity prices over a very long period (20 to 40 years), which are assumed to be constant or increase at a given rate.
7
Figure 1: Market penetration (unique subscribers in 2018) of the studied countries.
Source: Authors.
The AETR varies significantly across these countries from 33 percent in Ethiopia or 37 percent in Morocco to 97 percent in DRC and even 118 percent in Niger with an average at 64 percent. Ethiopia may appear as an outlier of our sample since the liberalization of its telecommunication sector remains to be done (see Table A in Appendix).
We break down the AETR in two components: the Average Special Tax Rate (AESTR) summarizes all special taxes and fees raised on mobile companies; the Average General Tax Rate (AEGTR) captures “standard” taxes, which apply to all firms in the country. We observe that special taxation represents the larger share of the final tax burden in 14 countries: The AEGTR is on average 26 percent, while the AESTR is 38 percent over our sample. We compute also the AETR of CIT only for a standard firm and a MNO. Our results are close to Steinmüller et al. (2019) with an average CIT AETR of 27.9 percent. We observe also that the CIT ATER of TELCO is lower than the CIT AETR of a standard firm since several special telecommunication taxes and fees are deductible from the CIT base.
For each country, we compare the AETR of TELCO to the AETR of a standard firm and a representative gold mining plant, which both have the same gross return of 60 percent. The standard firm supports only general taxation, while the mining firm has to pay some specific sectoral
8
taxes such as mining royalties, surface taxes and other fees.6 Unambiguously, the AETR of TELCO is higher than that of the other two sectors in all countries except Angola, Chad, Kenya, and South Africa. Telecommunication is more taxed than mining.
The rest of the paper is organized as following: Section 2 presents our AETR computation methodology, results, and some comparisons with the mining and the standard sector; Section 3 presents the results; and Section 4 concludes and presents some correlations between the computed AETRs and market penetrations or GNI per capita in 2018.
2 The AETR approach
We consider a representative MNO, named TELCO. This firm exploits a telecommunication license over 15 years. It generates cash flows (revenue minus expenses), which are shared between the investor (the owner of TELCO) and the government and other regulatory authorities, which tax TELCO. The AETR captures this distribution of cash flows by measuring the effective tax burden on the telecommunication sector.
We take into account the general taxation system such as the Corporate Income Tax (CIT), capital income tax, and custom duties and the telecommunication special taxation such as taxes on international or national traffic. Our analysis also integrates quasi-tax levies7 such as the pre-shipment inspection fees and contributions to the RA. However, we do not consider indirect taxation such as VAT, excises, and Personal Income Tax (PIT), which are collected by the firm, but are due either by the customer or by the employee of the firm.
Our approach follows previous analyses computing AETR for a general economic sector or a specific one such as the extractive industries. For instance, Djankov et al. (2010) study the effect of corporate taxes on investment and entrepreneurship. The authors build a five-year business plan of a representative firm, named TaxpayerCo, which produces and sells ceramic pots. The World Bank Doing Business survey uses this fictitious firm to rank countries every year. Blake and Roberts (2006), Daniel et al. (2010), Luca and Mesa Puyo (2016), and Diouf and Laporte (2017) apply the AETR approach to the extractive industry (mining and petroleum). Daniel et al. (2010) and Luca and Mesa Puyo (2016) present the Fiscal Analysis of Resources Industries (FARI) model, which the International Monetary Fund (IMF) used extensively to simulate tax
6 We use the FERDI online database and its mining industries simulation tool (https://fiscalite-miniere.ferdi.fr/en ). 7 Quasi-taxes are not raised by the tax administration nor the customs one.
9
policy reform in the mining and petroleum upstream sectors.
The cash flows sharing model is based on Net Present Values (NPV). The AETR is given by: 𝐴𝐸𝑇𝑅
∑ 1 𝑇𝑑
∑ 𝑅 1 𝐶𝑑 𝐾 , 𝑒𝑞. 1
where 𝑇 denotes total tax revenues in year t, 𝑅 total turnover, 𝐶 total OPEX, 𝐾 total CAPEX, and d is the discount rate. A rate of 50 percent would mean that tax payment is 50 percent of before-tax cash flows over the license life length.
2.1 TELCO’s accounting data
Given data availability and the diversity of market structures, we build TELCO, a standard representative MNO, which obtains its exploitation license in 2018 for a 15 year period. We model TELCO’s financial statements during its license exploitation period using the GSMA Intelligence database, which covers 237 countries and territories. This database encompasses market data (e.g., market shares, numbers of subscribers, market penetration, etc.), financial data (e.g., turnover, OPEX, CAPEX, and their decompositions, etc.), and communications volumes (e.g., outbound and inbound national and international minutes, SMS and data volumes).
To design the profile of TELCO, we consider all firms that were granted a mobile operating license in Africaover the period 2000-2017 in order to have a scalable profile. We assume that the turnover and other data for each firm depend on its market penetration rate. We first define TELCO’s turnover in each country as a share of the national final consumption.We consider national final consumption instead of Gross Domestic Product (GDP) since the former approximates better national demand for goods and services. This will allow us to take into account market diversity by building different cash flows profiles depending on national demands. Final consumption data come from the World Development Indicators (WDI) of the World Bank. We express total OPEX and CAPEX as a proportion of this turnover. We also consider the ratio of personnel and equipment costs over total OPEX. We determine national and international voice traffic in terms of inbound and outbound minutes per unique subscribers.8 We then compute the weighted average of each variable for each year over the
8 The use of the number of subscribers allows us to take into account market size, which may vary across countries. Since our
considered initial year is 2018, we consider the variation of the two variables (final consumption and unique subscribers) over the last 15 years to determine TELCO data.
10
n
length of the license to obtain TELCO’s data. The weight is the individual market penetration rate. Each variable, denoted by 𝑥̅ , is then given by the following formula:
𝑥 𝑀𝑃 ∗ 𝑥∑
𝑀𝑃 , eq. 2
where 𝑀𝑃 and 𝑥 represent respectively firm 𝑖’s market penetration rate at time t and firm 𝑖’s considered financial variable at time t. TELCO’s pre-tax Internal Rate of Return (IIRR) is on average 60 percent across studied countries. Our web application allows to modify the profile of TELCO and to apply the profile of actual Mobile Network Operators.
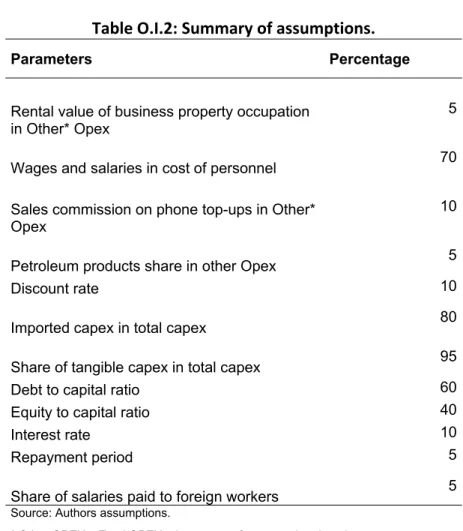
2.2 Assumptions
We make several assumptions regarding the details of TELCO’s accounting and financial data (see the online Appendix O.I). First, we assume a straight-line depreciation rule, which determines CAPEX depreciation charges.9 Second, we assume that TELCO finances its activity by combining debt and equity and consider a debt to capital ratio of 60 percent with a repayment period of 5 years. These borrowings are subject to a 10 percent interest rate, the same rate used to discount annual cash flows.10 We also make a sensitivity analysis by considering a lower interest rate of 6 percent.
We consider that the upfront license cost is part of tax revenue since it is paid by the investor to the government.11 An alternative approach would be to consider the license cost as a market entry cost, a necessary investment to operate a mobile phone network.12 To define employer costs such as social security contributions, we assume that wages and salaries represent 70 percent of labor cost. For professional or business licensing taxes, we consider that the rental value of business property corresponds to 5 percent of the total OPEX excluding cost of personnel and equipment.
While our approach is close to this developed by the IMF for the extractive sector’s rent sharing,13it differs significantly in its price structure assumptions. Actually, oil and most mineral resources have a well-established world price, which depends on global demand and supply
9 We consider that tangible CAPEX represents 95 percent of total CAPEX.
10 For comparison purpose, these parameters are chosen in line with Ferdi’s gold mining representative firm borrowing
parameters.
11 We consider a one-off license payment at the beginning of exploitation.
12 The cost of the license would then be integrated in the denominator in deduction of the gross cash flows.
11
variations. Commodity prices are then an exogenous parameter for any particular mining or petroleum project, independent of its size. In other words, the extractive firm is price taker and its production has no impact on the global price.14The definition of prices is more complex in the telecommunication sector, since markets are national and oligopolistic (see Faccio and Zingales, 2017). Telecommunications firms set their prices depending on the demand and the behavior of their competitors at the national level. At the supply side, interactions may take the form of a pure price or price-quality competition, which can significantly reduce firms’ profits.15 Many developments in industrial economics aim to study the competition structure of a market and its impact on prices and consumer surplus. We use historical data to determine the profile of turnover of TELCO during the exploitation of its license. We express this turnover in terms of national final consumption (see the online Appendix).
The discount rate captures the opportunity cost of invested capital in TELCO on the investor side. But, the discount rate is also the preference for present of the government. This may explain a difference among investors’ discount rate and the State one. They can then vary across countries depending on risks and stakeholders’ preferences. For example, we can expect higher discount rates for developing countries given the short-term liquidity preference of their governments. However, choosing the right discount rate is not an easy task given the divergence of preference between governments and investors. Several analyses discuss factors such as the level of uncertainty, capital expenditures valuation, and other risk factors in the discount rate determination (Boadway and Bruce, 1984; Fane, 1987; Bonds and Devereux, 1995). For simplicity, we consider the same discount rate of 10 percent for both investors and governments.16 We propose a sensitivity analysis by setting the discount rate to 0, 5 and 12 percent in the online Appendix O.IV.
Following Chennells and Griffith (1997) we take into account exchange rates and inflation in the AETR computation. We convert all tax variables in Euro, which is the currency of the GSMA database. Using data in nominal or real terms will not affect the AETR results, as the conversion rate will be the same for the numerator and the denominator of the AETR expression. The
14 This hypothesis can be discussed for some minerals such as uranium or some mining deposits such as Simandou’s in Guinea
for iron. The production capacity of the latter would represent a significant volume of the worldwide production.
15 A classical result in the economic literature is the equivalence between the Bertrand’s duopoly equilibrium and the pure and
perfect competition one. In both equilibrium, price equals the marginal cost and profits are zero.
16 Chennells and Griffith (1997), Djankov et al. (2010), Luca and Mesa Puyo (2016), and Diouf and Laporte (2017) consider a
discount rate of 10 percent. However, Luca and Mesa Puyo (2016) differentiate their discount rate for government (10 percent) and for contractor (12.5 percent).
12
potentially substantial upfront license payment takes place on Year 0 and is not impacted by inflationary concerns. We then choose to keep the data in nominal term as expressed in the GSMA database.
2.3 Tax data
The study considers the tax regimes applicable in 2018 to MNOs in 25 African countries. General taxation applies to all firms operating in the country. Tax and Customs Codes, Laws and Acts define the standard tax regime. Some special laws such as Investment Code and other legal sources (act, decree, ministerial ruling, etc.) may provide tax incentives by reducing tax rates or the taxable base (see Appendix B). General taxation includes direct and indirect taxation, as well as tariff duties collected at the borders.
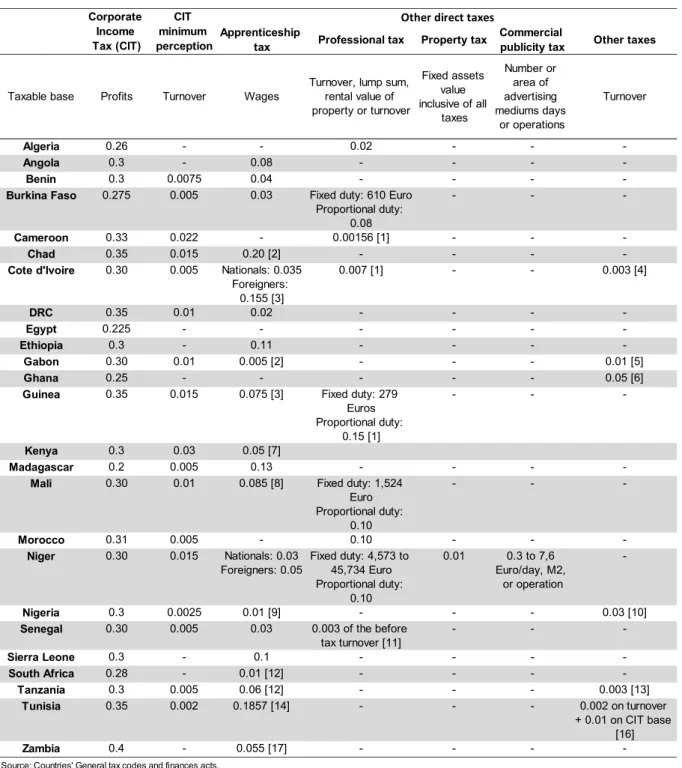
Direct taxation includes CIT, a Minimum tax usually based on turnover, employer contributions on wages, and professional taxes based on rental value or some fixed asset value (see Table 1). CIT rates vary from 20 percent in Madagascar to 40 percent in Zambia. Three counties: Cote d’Ivoire, Tunisia and Zambia raise a higher CIT rate on MNOs than the standard rate. Moreover, Algeria, Ghana, Nigeria, and Tunisia have also an additional ad valorem tax applied on benefits. Many African countries have an alternative mechanism for CIT purpose, which taxes turnover. This mechanism called Minimum tax has a rate, which varies from 0.2 percent in Tunisia to 3 percent in Kenya. Employer contributionsrates raised on wages range from 0.5 percent in Gabon to 20 percent in Chad. Cote d’Ivoire and Niger for example distinguish between the rate applied to local workers and foreigners. Professional tax has two components in Burkina Faso, Guinea, and Niger: a fixed lump sum from 279 Euro in Guinea to at least 4,573 Euro in Niger;17 and a proportional one based on the rental value of business property from 8 percent in Burkina Faso to 15 percent in Guinea. In the other countries, it is expressed as a percentage of turnover (Algeria and Senegal for example) or assets value. Niger has also a commercial tax on advertising based on the number and types of billboards and advertising activities. Finally, Cote d’Ivoire, Gabon, Nigeria, and Tanzania have ad valorem taxes based on the turnover of MNOs, which aim to finance some activities such as artistic creation, tertiary education or local services. Appendix B presents tax advantages, which apply to MNOs operating in the studied countries. Several countries such as Egypt, Ethiopia, Ghana, Senegal and South Africa apply standard CIT rate. On the opposite, Tunisia displays a very generous mechanism by providing 10 years of
13
CIT exemption and a reduced rate by half for the next ten years. Losses carry-forward increases significantly the effective length of CIT exemptions. Almost all countries have reduced or zero rate of customs duties for equipment and capital goods.
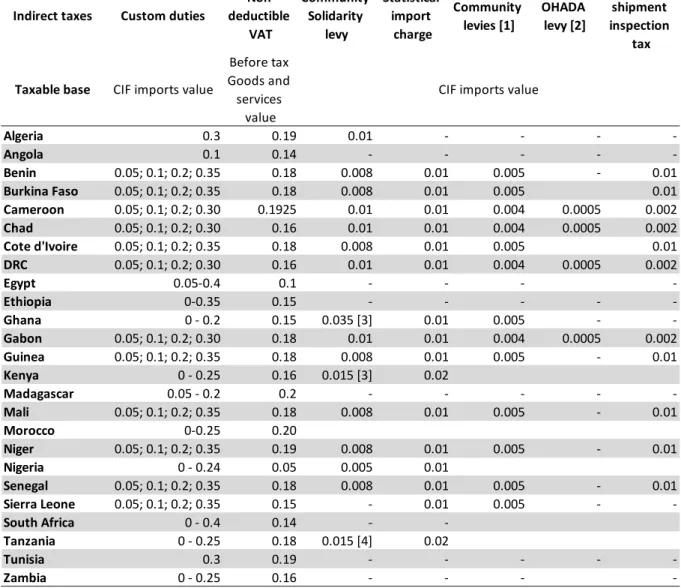
We consider some indirect taxes only, which increase the cost of production of TELCO (see Table 2).18 These taxes are customs duties, non-deductible VAT on oil products, and the different levies associated to import operations. VAT rates vary from 5 percent in Nigeria to 20 percent in Madagascar and Morocco. Custom duties range from zero to 30 percent.19 We consider also some particular fees or levies collected at the border. Customs unions such as the Eastern African Community (EAC) or the Western African Economic and Monetary Union (WAEMU) for instance raise fees or quasi-tax for the budget of their respective Commissions. Several African countries use also private firms to assist their own customs administration through Pre-Shipment Inspection (PSI) programs. These firms provide additional information on the value of imported goods. The importers have to pay this service through a fee, which is equivalent to a quasi-tariff on importations (see Dequiedt et al., 2012).
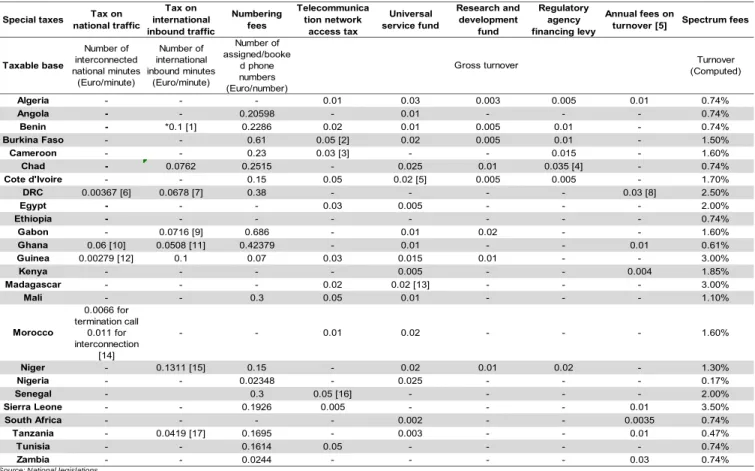
Special taxation on the telecommunication sector results from particular laws and decrees, which regulate this sector (see Table 3). We consider the following taxes and fees: taxes on national and international traffic, telecommunication network access tax, numbering fees, Universal Service Fund, research and development fund, RA levy and particular fees. These taxes may be ad valorem (based on turnover) or specific (nominal amount based on some activity measures such as minutes, data and SMS). This special taxation is similar to excise duties, which are collected by firms but legally due by consumers. However, given the incidence of this mobile-specific taxation and the demand elasticity of the sector, we assume that this special taxation is due by the mobile phone companies themselves. The sum of special ad valorem taxes and fees raised turnover vary from 0.55 percent in South Africa to 8.5 percent in Burkina Faso. We express specific taxes in Euro.
Spectrum fees are the main component of regulatory fees. Table 3 displays an estimation of these fees in terms of turnover, which is based on the average relevant payment reported in the GSMA database. However, spectrum fees vary significantly in their form across countries and from one year to another. For example, DRC raises a specific tax of 53,500 USD/MHz for
18 The AETR computation does not take into account VAT, sales tax, and excise duties on telecommunication services.
14
GSMs, 6,000 USD/MHz for microwaves, and 3,000 USD/MHz for internet. The Guinean spectrum fees have the following structure: 5,525 Euro/MHz for WiMAX networks, 110 Euro for ARMC’s, 7,735 Euro for GSM 900’s and DCS 1800’s, 5,525 Euro for VSAT’s and from 1,547 to 9,282 Euro paid annually for digital terrestrial networks depending on the size of beams.
15
Table 1: Direct taxes in 2018 Apprenticeship
tax Professional tax Property tax
Commercial
publicity tax Other taxes
Taxable base Profits Turnover Wages
Turnover, lump sum, rental value of property or turnover Fixed assets value inclusive of all taxes Number or area of advertising mediums days or operations Turnover Algeria 0.26 - - 0.02 - - -Angola 0.3 - 0.08 - - - -Benin 0.3 0.0075 0.04 - - -
-Burkina Faso 0.275 0.005 0.03 Fixed duty: 610 Euro Proportional duty:
0.08
- -
-Cameroon 0.33 0.022 - 0.00156 [1] - -
-Chad 0.35 0.015 0.20 [2] - - -
-Cote d'Ivoire 0.30 0.005 Nationals: 0.035 Foreigners: 0.155 [3] 0.007 [1] - - 0.003 [4] DRC 0.35 0.01 0.02 - - - -Egypt 0.225 - - - -Ethiopia 0.3 - 0.11 - - - -Gabon 0.30 0.01 0.005 [2] - - - 0.01 [5] Ghana 0.25 - - - 0.05 [6]
Guinea 0.35 0.015 0.075 [3] Fixed duty: 279 Euros Proportional duty: 0.15 [1] - - -Kenya 0.3 0.03 0.05 [7] Madagascar 0.2 0.005 0.13 - - -
-Mali 0.30 0.01 0.085 [8] Fixed duty: 1,524
Euro Proportional duty: 0.10 - - -Morocco 0.31 0.005 - 0.10 - - -Niger 0.30 0.015 Nationals: 0.03 Foreigners: 0.05 Fixed duty: 4,573 to 45,734 Euro Proportional duty: 0.10 0.01 0.3 to 7,6 Euro/day, M2, or operation -Nigeria 0.3 0.0025 0.01 [9] - - - 0.03 [10]
Senegal 0.30 0.005 0.03 0.003 of the before tax turnover [11] - - -Sierra Leone 0.3 - 0.1 - - - -South Africa 0.28 - 0.01 [12] - - - -Tanzania 0.3 0.005 0.06 [12] - - - 0.003 [13] Tunisia 0.35 0.002 0.1857 [14] - - - 0.002 on turnover + 0.01 on CIT base [16] Zambia 0.4 - 0.055 [17] - - -
-Source: Countries' General tax codes and finances acts. [1] Business licence tax.
[12] Skill development levy.
[13] Local service tax.
[5] Special solidarity levy.
[7] Employer contribution. [16] Social solidarity levy.
[9] Industrial training cost.
[14] Including the professional training tax at a rate of 0.02 and the social security levy at a rate of 0.1657.
[10] Including the tertiary education tax of 0.02 and the international technology tax of 0.01.
[11] It is about local economy levy which replace the busing licensing tax in 2018.
Other direct taxes
[2] It includes the lump-sum tax on salaries at a rate of 7.5 percent, the tax on salaries at a rate of 11.5 percent, and the apprenticeship tax at a rate of 1.2 percent.
[3] Including the national levy for economic, cultural and social development of the nation at the rate of 1.5 percent, the apprenticeship tax at the rate of 0.5 percent; and additional taxes for continuing professional training at the rate of 1.5 percent. For foreigners, the employer levy at the rate of 11.5 percent is included. [4] Including artisitic creation tax at the rate of 0.2 percent and equipment special tax at the rate of 0.1 percent.
[6] National fiscal stabilisation levy which applies on the CIT base. It is expected to apply from 2018 to 2025.
[8] Including the employer lump sum contribution at the rate of 3.5 percent, professional training tax at the rate of 2 percent, young people employment tax at the rate of 2 percent, and housing tax at the rate of 1
[17] Including the skill development levy at a rate of 0.5 percent and the national pension scheme at a rate of 5 percent. [15] Tax on establishments of an industrial, commercial or professional nature for the benefit of local authorities. Corporate Income Tax (CIT) CIT minimum perception
16
Table 2: Indirect taxes, customs duties and fees in 2018
Indirect taxes Custom duties Non deductible VAT Community Solidarity levy Statistical import charge Community levies [1] OHADA levy [2] Pre‐ shipment inspection tax Taxable base CIF imports value Before tax Goods and services value Algeria 0.3 0.19 0.01 ‐ ‐ ‐ ‐ Angola 0.1 0.14 ‐ ‐ ‐ ‐ ‐ Benin 0.05; 0.1; 0.2; 0.35 0.18 0.008 0.01 0.005 ‐ 0.01 Burkina Faso 0.05; 0.1; 0.2; 0.35 0.18 0.008 0.01 0.005 0.01 Cameroon 0.05; 0.1; 0.2; 0.30 0.1925 0.01 0.01 0.004 0.0005 0.002 Chad 0.05; 0.1; 0.2; 0.30 0.16 0.01 0.01 0.004 0.0005 0.002 Cote d'Ivoire 0.05; 0.1; 0.2; 0.35 0.18 0.008 0.01 0.005 0.01 DRC 0.05; 0.1; 0.2; 0.30 0.16 0.01 0.01 0.004 0.0005 0.002 Egypt 0.05‐0.4 0.1 ‐ ‐ ‐ ‐ Ethiopia 0‐0.35 0.15 ‐ ‐ ‐ ‐ ‐ Ghana 0 ‐ 0.2 0.15 0.035 [3] 0.01 0.005 ‐ ‐ Gabon 0.05; 0.1; 0.2; 0.30 0.18 0.01 0.01 0.004 0.0005 0.002 Guinea 0.05; 0.1; 0.2; 0.35 0.18 0.008 0.01 0.005 ‐ 0.01 Kenya 0 ‐ 0.25 0.16 0.015 [3] 0.02 Madagascar 0.05 ‐ 0.2 0.2 ‐ ‐ ‐ ‐ ‐ Mali 0.05; 0.1; 0.2; 0.35 0.18 0.008 0.01 0.005 ‐ 0.01 Morocco 0‐0.25 0.20 Niger 0.05; 0.1; 0.2; 0.35 0.19 0.008 0.01 0.005 ‐ 0.01 Nigeria 0 ‐ 0.24 0.05 0.005 0.01 Senegal 0.05; 0.1; 0.2; 0.35 0.18 0.008 0.01 0.005 ‐ 0.01 Sierra Leone 0.05; 0.1; 0.2; 0.35 0.15 ‐ 0.01 0.005 ‐ ‐ South Africa 0 ‐ 0.4 0.14 ‐ ‐ Tanzania 0 ‐ 0.25 0.18 0.015 [4] 0.02 Tunisia 0.3 0.19 ‐ ‐ ‐ ‐ ‐ Zambia 0 ‐ 0.25 0.16 ‐ ‐ ‐ ‐
Source: Countries' General tax codes and finances acts.
[2] Organisation pour l'Harmonisation en Afrique du Droit des Affaires.
[3] Including the special import levy at a rate of 0.01 in place from 2018 to 2025 and the national insurance levy at a rate of 0.025. [4] Railway development levy.
CIF imports value
[1] Community integration levy: Communauté des Etats d'Afrique Centrale (CEMAC), Eastern Africa Community (EAC), Economic Community of West African States (ECOWAS), South Africa Custom Union (SACU), Western African Economic and Monetary Union (WAEMU).
17
Table 3: Special taxation in 2018
Special taxes Tax on national traffic Tax on international inbound traffic Numbering fees Telecommunica tion network access tax Universal service fund Research and development fund Regulatory agency financing levy Annual fees on
turnover [5] Spectrum fees
Taxable base Number of interconnected national minutes (Euro/minute) Number of international inbound minutes (Euro/minute) Number of assigned/booke d phone numbers (Euro/number) Turnover (Computed) Algeria - - - 0.01 0.03 0.003 0.005 0.01 0.74% Angola - - 0.20598 - 0.01 - - - 0.74% Benin - *0.1 [1] 0.2286 0.02 0.01 0.005 0.01 - 0.74% Burkina Faso - - 0.61 0.05 [2] 0.02 0.005 0.01 - 1.50% Cameroon - - 0.23 0.03 [3] - - 0.015 - 1.60% Chad - 0.0762 0.2515 - 0.025 0.01 0.035 [4] - 0.74% Cote d'Ivoire - - 0.15 0.05 0.02 [5] 0.005 0.005 - 1.70% DRC 0.00367 [6] 0.0678 [7] 0.38 - - - - 0.03 [8] 2.50% Egypt - - - 0.03 0.005 - - - 2.00% Ethiopia - - - - 0.74% Gabon - 0.0716 [9] 0.686 - 0.01 0.02 - - 1.60% Ghana 0.06 [10] 0.0508 [11] 0.42379 - 0.01 - - 0.01 0.61% Guinea 0.00279 [12] 0.1 0.07 0.03 0.015 0.01 - - 3.00% Kenya - - - - 0.005 - - 0.004 1.85% Madagascar - - - 0.02 0.02 [13] - - - 3.00% Mali - - 0.3 0.05 0.01 - - - 1.10% Morocco 0.0066 for termination call 0.011 for interconnection [14] - - 0.01 0.02 - - - 1.60% Niger - 0.1311 [15] 0.15 - 0.02 0.01 0.02 - 1.30% Nigeria - - 0.02348 - 0.025 - - - 0.17% Senegal - 0.3 0.05 [16] - - - - 2.00% Sierra Leone - - 0.1926 0.005 - - - 0.01 3.50% South Africa - - - - 0.002 - - 0.0035 0.74% Tanzania - 0.0419 [17] 0.1695 - 0.003 - - 0.01 0.47% Tunisia - - 0.1614 0.05 - - - - 0.74% Zambia - - 0.0244 - - - - 0.03 0.74%
Source: National legislations.
[1] Turnover relating to international incoming calls.
[2] Specific tax on telecommunication companies. [9] The tax on international incoming trafic rate is 0.2086 Euro/Minute, of which 65.7 percent is refunded to MNOs. [3] Telecommunication special fund levy. [10] CST on interconnection.
[4] ARCEP administration fee. [11] Applicable to telecommunication operators and internet providers. [5] In addition to the 3 percent annual fees on turnover DRC raises also some managment fees [12] National interconnection fees.
on interconnection activities at the rate of 15 percent of the cost of interconnected minutes. [13] Contribution to the development of telecommunication fund.
[6] Local interconnection tax. [14] It is about the interconnection fees for termination rate of interconnections traffic. [7] Telecommunication regulation tax. [15] This tax was repealed in FY 2018 and restaured by the 2019 Finance Law. [8] Telecommunication special fund levy. [16] Special levy of telecommunications' (CST).
[17] It represents the share returned to the government.
18
3 Results
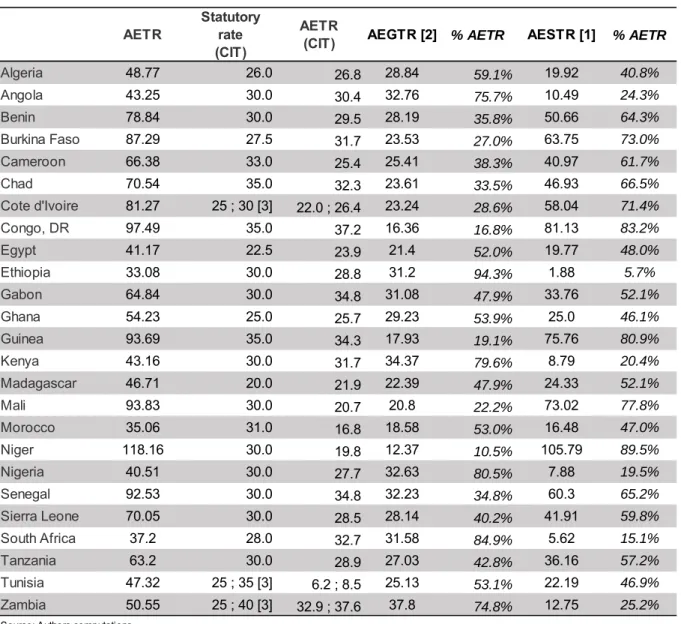
Table 4 displays the AETR results. The tax burden on TELCO exceeds 50 percent in several countries and even 100 percent in some of them, meaning that TELCO’s investors would lose money.20 The AETR varies from 33 percent of generated cash flows in Ethiopia to 118 percent in Niger with an average value of 64 percent across the sample (column 1 of Table 3). We notice that the telecommunication sector in Ethiopia was still State-owned in 2018, the market liberalization process beginning in this country only in June 2019.
We compute the AETR considering only CIT (column 3 in Table 3). This range from 8.5 percent in Tunisia to 37.6 percent in Zambia with an average of 27.9 percent. This average is close to the estimation of the AETR for the information media and telecommunication sector equal to 24.33% computed by Steinmüller et al. (2019). These authors calculate average firm-industry-level ETR for 142 countries over the period 2004 to 2014.
Columns 4 and 6 provide a breakdown of the AETR in term of general (AEGTR)21 and special taxation (AESTR).22 The former expresses the burden of general taxation in each country, as the national Tax and Customs Codes (or Acts) define it, while the AESTR summarizes special taxation applied to the telecommunication sector. The high level of AETRs results mainly from mobile-special taxation. AESTR represents from 2 percent of the pre-tax cash flows in Ethiopia to 106 percent in Niger with an average value of 38 percent. The AESTR is significantly higher than the AEGTR in 14 countries. The online Appendix O.IV displays a sensitivity analysis of our results with respect to the discount rate and the interest rate. Our results remain robust to these variations.
Some special taxes are deductible from CIT. Table 4 displays a striking result in several countries (Benin, Chad, DRC, Gabon, Niger, Senegal, Tanzania, Tunisia), where the AEGTR is below the CIT AETR. It may appear surprising since the computation of the AEGTR encompasses the CIT and other direct taxes. The taxable base of the AEGTR is actually smaller since special taxation are deductible for CIT purpose and are not taken into account in the computation of the CIT AETR. For instance, DRC displays a gap of 21 percent: its CIT AETR is equal to 37.2 percent,
20 In such a case MNOs may obtain additional and particular tax advantages, which may not been publicly disclosed.
21 Average Effective General Tax Rate. 22 Average Effective Special Tax Rate
19
while its AEGTR amounts to 16.4 percent. DRC raises numerous and significant special taxes on MNOs, its AESTR reaching 81.1 percent.
Table 4: AETR (percentage)23
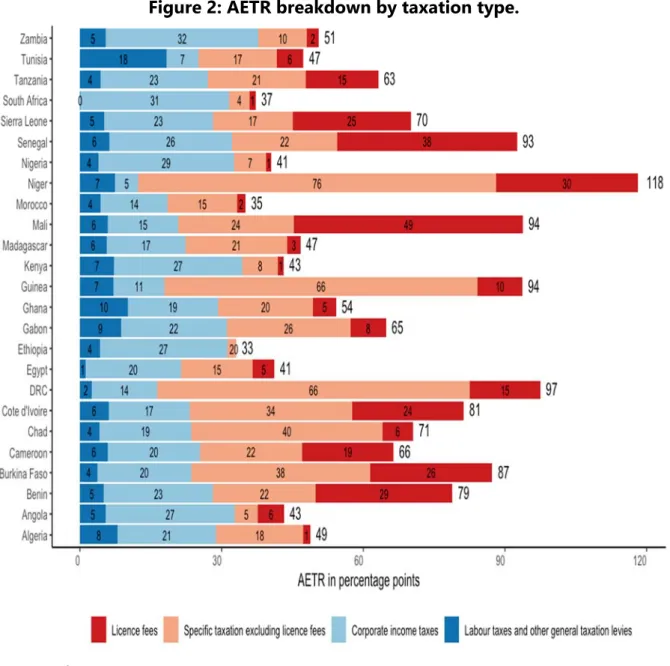
Figure 2 depicts the AETR by type of tax. We distinguish special telecommunication taxes from standard general taxes. We notice that license fees represent more than 50 percent of the AESTR (57 percent of the AESTR in Benin, 67 percent in Mali, 63 percent in Senegal, and 60
23 Online Appendix O.II provides an illustration of our approach for the case of Cameroon. AETR
Statutory rate (CIT)
AETR
(CIT) AEGTR [2] % AETR AESTR [1] % AETR
Algeria 48.77 26.0 26.8 28.84 59.1% 19.92 40.8% Angola 43.25 30.0 30.4 32.76 75.7% 10.49 24.3% Benin 78.84 30.0 29.5 28.19 35.8% 50.66 64.3% Burkina Faso 87.29 27.5 31.7 23.53 27.0% 63.75 73.0% Cameroon 66.38 33.0 25.4 25.41 38.3% 40.97 61.7% Chad 70.54 35.0 32.3 23.61 33.5% 46.93 66.5% Cote d'Ivoire 81.27 25 ; 30 [3] 22.0 ; 26.4 23.24 28.6% 58.04 71.4% Congo, DR 97.49 35.0 37.2 16.36 16.8% 81.13 83.2% Egypt 41.17 22.5 23.9 21.4 52.0% 19.77 48.0% Ethiopia 33.08 30.0 28.8 31.2 94.3% 1.88 5.7% Gabon 64.84 30.0 34.8 31.08 47.9% 33.76 52.1% Ghana 54.23 25.0 25.7 29.23 53.9% 25.0 46.1% Guinea 93.69 35.0 34.3 17.93 19.1% 75.76 80.9% Kenya 43.16 30.0 31.7 34.37 79.6% 8.79 20.4% Madagascar 46.71 20.0 21.9 22.39 47.9% 24.33 52.1% Mali 93.83 30.0 20.7 20.8 22.2% 73.02 77.8% Morocco 35.06 31.0 16.8 18.58 53.0% 16.48 47.0% Niger 118.16 30.0 19.8 12.37 10.5% 105.79 89.5% Nigeria 40.51 30.0 27.7 32.63 80.5% 7.88 19.5% Senegal 92.53 30.0 34.8 32.23 34.8% 60.3 65.2% Sierra Leone 70.05 30.0 28.5 28.14 40.2% 41.91 59.8% South Africa 37.2 28.0 32.7 31.58 84.9% 5.62 15.1% Tanzania 63.2 30.0 28.9 27.03 42.8% 36.16 57.2% Tunisia 47.32 25 ; 35 [3] 6.2 ; 8.5 25.13 53.1% 22.19 46.9% Zambia 50.55 25 ; 40 [3] 32.9 ; 37.6 37.8 74.8% 12.75 25.2%
Source: Authors computations. [1]: Average Effective General Tax Rate. [2]: Average Effective Special Tax Rate.
20
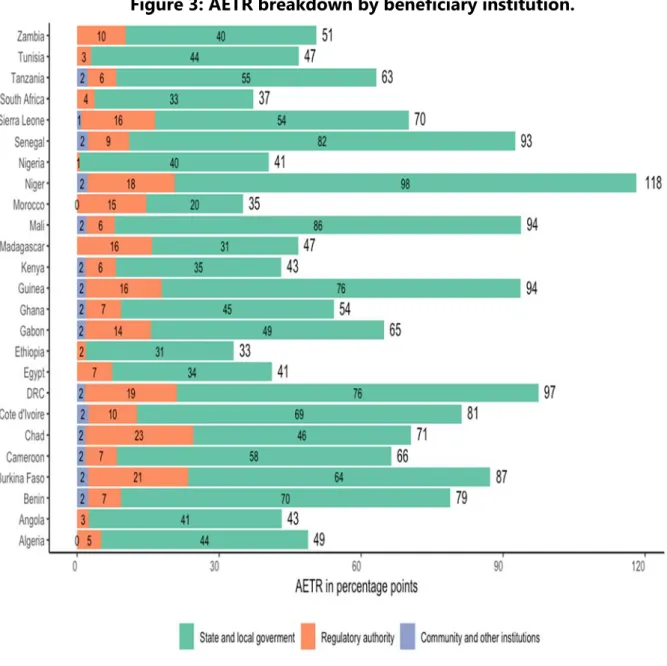
percent in Sierra Leone). In the other countries, the other special mobile phone companies’ taxes explain more than 50 percent of the AESTR. Their share in TELCO’s pre-tax cash flows varies from 2 percent in Ethiopia to 76 percent in Niger. We complete our analysis by breaking down the AETR within all beneficiary institutions namely States and local governments, Regulatory Agencies (RA), and other stakeholders such as Customs Unions24 or other institutions as the pre-shipment inspection firms (see Figure 3). State and local governments are the main beneficiaries of tax revenues with an AETR ranging from 20 percent of TELCO’s pre-tax cash flows in Morocco to 98 percent in Niger. They receive direct taxes, non-deductible VAT on petroleum products, custom duties, and a share of special telecommunication taxes. RAs are the second most important beneficiary as they receive the remaining part of special telecommunication taxes including universal services fund, regulatory taxes and fees, and research and development contributions.
The autonomy or independence of the Telecommunication RA may trigger a race to the top with the Ministry of Finance, which means an excessive tax burden. Keen and Kotsogiannis (2002) formalize the vertical tax competition between two levels of government in a federal State. Both governments tax the same base and this competition, or equivalently the lack of cooperation among them, induces higher tax rates. Such interactions contrast with the standard view of horizontal tax competition (see Wilson, 1986, Zodrow and Mieszkowski, 1986, and Rota-Graziosi, 2018) and its race to the bottom. Beyond vertical tax competition, Berkowitz and Li (2000) develop the notion of tax rights that is the property rights that a government or an agency has on a particular tax base. The over-exploitation of the same tax base by multiple tax agencies involves an excessively high aggregated tax rate, low investments, inefficient public expenditures, and a poor economic performance. The competition or cooperation between the Telecommunication RA and the Ministry of Finance can explain the high level of the AETR of TELCO and its heterogeneity across countries.
21
Figure 2: AETR breakdown by taxation type.
Source: Authors.
22
Figure 3: AETR breakdown by beneficiary institution.
Source: Authors.
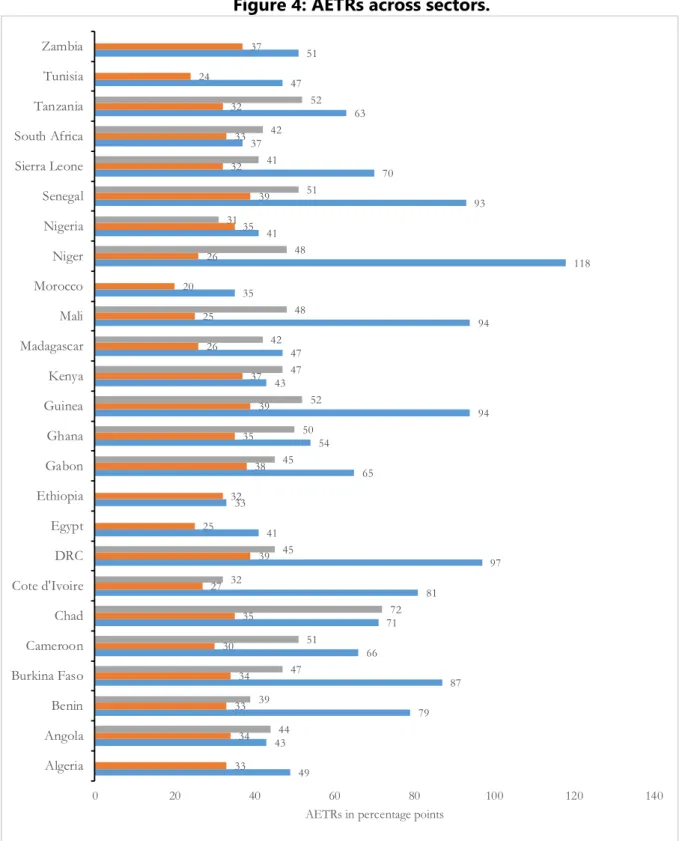
We now compare the AETRs of three sectors in each country: telecommunications, gold mining,25 and a standard economic one.26 An immediate result (see Figure 4) is that mobile phone companies face a higher tax burden than the gold mining sector in fifteen (15) countries. The AETR in the gold mining sector varies from 31 percent in Nigeria to 72 percent in Chad. Its
25 The AETR computation for the gold mining’s comes from https://fiscalite-miniere.ferdi.fr/en consulted on June, 21th 2019. We
retained simulations with a medium grade open- pit mine (3g/t) and a price of 1,300 USD/oz. Details on the FERDI’s representative mining firm are given in the online Appendix O.III (for more details, see Laporte et al., 2019). The gold price is considered to be 1,300 USD in regard with its observed value on June 17th 2019 at 10h30 (1,333.2 USD/oz on
https://www.banque-france.fr/en/statistics/rates/gold-prices-0 consulted on June, 17th 2019). Algeria, Egypt, Ethiopia, Morocco, Tunisia, and Zambia are not covered in the FERDI analysis of gold mining sector.
26 We also compute the AETR of a firm operating in a standard economic sector under the general tax regime and with similar
23
average value is around 46 percent against 68 percent for the mobile sector. In several countries, the special taxation on telecommunications alone is higher than the total tax burden applied to the mining sector. The mining sector remains however more taxed than the standard economic one except in Nigeria.
Figure 4: AETRs across sectors.
Source: Authors. 49 43 79 87 66 71 81 97 41 33 65 54 94 43 47 94 35 118 41 93 70 37 63 47 51 33 34 33 34 30 35 27 39 25 32 38 35 39 37 26 25 20 26 35 39 32 33 32 24 37 44 39 47 51 72 32 45 45 50 52 47 42 48 48 31 51 41 42 52 0 20 40 60 80 100 120 140 Algeria Angola Benin Burkina Faso Cameroon Chad Cote d'Ivoire DRC Egypt Ethiopia Gabon Ghana Guinea Kenya Madagascar Mali Morocco Niger Nigeria Senegal Sierra Leone South Africa Tanzania Tunisia Zambia
AETRs in percentage points
24
The difference of taxation between the mining and telecom sector results from the number and the rates of special taxes. It may appears surprising even inconsistent given the tax base: a non-renewable resource on one side, a limited resource with important positive externalities on the other. This difference can reflect a better coordination, or equivalently a lower tax competition between the MoF and the Minister in charge of the Mining and Petroleum sector than between the former and the Telecommunication RA. Another potential explanation is a more efficient lobbying activity of the extractive industry, which translates into a lower tax burden. For instance, the mining sector enjoys tax stability clauses, which protect investors against any modification of general and special tax rates. The main justification of these clauses is the risky nature of the mining investment given the profile of generated cash flows. Extractive industries have to invest a significant level of capital at the beginning of the exploitation to build the mining plant. This investment is irreversible and linked to the deposit. These characteristics expose the sector to partial expropriation through an increase of the tax burden, or even a complete one with nationalization. Initial investment of the telecommunication sector is however also important, irreversible, and linked to a given territory. Moreover, it may represent a significant share of total capital expenditures (more than 50 percent for our representative firm). Finally, a last explanation of a higher tax burden for telecommunications is the history of each sector, which shapes their respective tax regime: The extractive industry is in place for some time in almost all the studied countries, while the telecommunication sector is relatively new.
4 Conclusion
We estimate the AETR for a standard representative firm, TELCO, in twenty-five (25) African countries using a cash flow model over the length of a telecommunication license. The tax burden varies significantly from one country to another depending on the weight and the characteristics of special taxes applied to telecommunications companies. The AETR varies from 33 percent in Ethiopia to 118 percent in Niger. We distinguish general taxation from sector-special taxation highlighting the risk of a tax competition between the MoF and the Telecommunication RA. Mobile special taxation component explains more than 50 percent of the AETR in many countries. States and RAs are the main beneficiaries of tax revenues. We computing the AETR for CIT only. We observe that this measure is lower for TELCO than for a
25
standard firm since several special telecommunication taxes and fees are deductible from the CIT base.
Telecommunication is generally more taxed than the mining sector. We compare the AETR of TELCO with a representative gold mining firm and a standard firm, which both display the same gross return of investment, around 60 percent. The tax burden of TELCO is higher in 15 countries out of the 19 countries for which we have information over their mining tax regime. We mention some potential explanations such as a more efficient lobbying activity of the mining sector or a vertical tax competition between the MoF and Telecommunication RAs, which deserve more investigations.
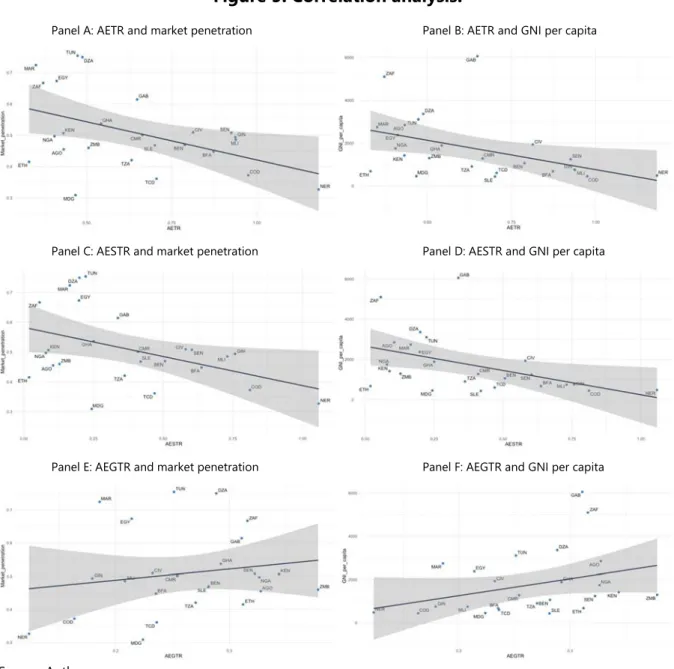
Figure 5 displays a correlation analysis between computed AETRs and market penetration and Gross National Income (GNI) per capita.27 We find a negative correlation between the AETR and these two variables. Countries with lower market penetration rates and GNI per capita experience higher AETRs. These results are driven by special taxes and fees since the correlation is also negative between AESTRs and market penetration or GNI per capita. The correlation is by contrast positive between the standard taxes captured by the AEGTRs and the two variables. Beyond the level of taxation measured through AETR the form of taxation seems to matter in terms of revenue and telecommunication development. Telecommunication RAs can raise very distortionary taxes or fees as Hausman (1998) emphasized it in the case of the US Telecommunication Act of 1996.28 The deductibility of some special taxes from the CIT base may increase the economic inefficiencies of special taxation. Alternatively, theses correlations may also illustrate that more advanced countries in terms of mobile phone market penetration rely less on special taxation. This relationship could result from a more powerful lobbying of MNOs in these countries. Further research would address these issues.
27 The small number of countries limits our capacity to conduct a rigorous empirical analysis.
28 The author highlights the inefficiency of fees raised by the Federal Communications Commission to fund a program providing free internet access to schools and libraries. Despite all the technological innovations in the telecommunication sector over the past decades, several issues addressed in this paper remain highly relevant.
26
Figure 5: Correlation analysis.
Panel A: AETR and market penetration Panel B: AETR and GNI per capita
Panel C: AESTR and market penetration Panel D: AESTR and GNI per capita
Panel E: AEGTR and market penetration Panel F: AEGTR and GNI per capita
Source: Authors.
27
References
Aker, J. and I. Mbiti, (2010), “Mobile phones and economic development in Africa”, Journal of Economic Perspectives, 24 (3), 207-232.
Auerbach, A. and D. Jorgenson, (1980), “Inflation-Proof Depreciation of Assets”, Harvard Business Review, 58(5), 113-118.
Baltagi, B. (2008), Econometric analysis of panel data, Chichester, John Wiley and Sons. Buys, P., S. Dasgupta, T. Thomas, and D. Wheeler. (2009), “Determinants of a Digital Divide in Sub-Saharan Africa: A Spatial Econometric Analysis of Cell Phone Coverage”, World
Development, 37(9): 1494–1505
Berkowitz, D. and L. Wei. (2000), “Tax rights in transition economies: a tragedy of the commons?”, Journal of Public Economics, 76(3), 369-397.
Blake, A. and M. Roberts, (2006), “Comparing petroleum fiscal regimes under oil price uncertainty”, Resources Policy, 31(2), 95‑105.
Boadway, R. and N. Bruce, (1984) “A general proposition on the design of a neutral business tax”, Journal of Public Economics, 24(2), 231‑239.
Bonds, S. and M. Devereux, (1995), “On the design of a neutral business tax under uncertainty”, Journal of Public Economics, 58(1), 57‑71.
Chennells, L. and R. Griffith, (1997), Taxing profits in a changing world, London, The Institute for Fiscal Studies.
Daniel, P., Keen, M., and C. McPherson, (2010), The taxation of petroleum and minerals : Principles, problems and practice, Routledge.
Devereux, M. and R. Griffith, (1998), “Taxes and the location of production : Evidence from a panel of US multinationals”, Journal of Public Economics, 68(3), 335‑367.
Djankov, S., T. Ganser, C. McLiesh, R. Ramalho, and A. Shleifer, (2010), “The Effect of Corporate Taxes on Investment and Entrepreneurship”, American Economic Journal: Macroeconomics, 2 (3): 31-64.
Driscoll, J. C. and A. C. Kraay, (1998), “Consistent covariance matrix estimation with spatially dependent panel data”, Review of economics and statistics, 80(4), 549-560.
Diouf, A., and B. Laporte, (2017), “Oil contracts and government: Issues for Senegal and developing countries”, The Journal of Energy and Development, 43(1/2), 213-234.
Djankov, S., Ganser, T., McLiesh, C., Ramalho, R., and A. Shleifer, (2010), “The Effect of Corporate Taxes on Investment and Entrepreneurship”, American Economic Journal: Macroeconomics, 2(3), 31‑64.
Faccio, M., and L. Zingales, (2017), “Political determinants of competition in the mobile telecommunication industry”, Working Paper 23041, National Bureau of Economic Research. Fane, G. (1987), “Neutral taxation under uncertainty”, Journal of Public Economics, 33(1), 95‑105. Dequiedt, V., Geourjon, A.-.M., and G. Rota-Graziosi, (2012), “Mutual supervision in preshipment inspection programs”, Journal of Development Economics, 99, 282-291.
28
GSMA, 2017, Accelerating affordable smartphone ownership in emerging markets, 116 p. Hausman, J., (1998), “Taxation by telecommunication regulation”, In Poterba, J. (ed.), Tax Policy and the Economy, Vol. 12, p. 29-48, MIT Press.
Henisz, W., Zelner B., and M. Guillén, (2005), “The Worldwide Diffusion of Market-Oriented Infrastructure Reform, 1977-1999,” American Sociological Review, 70(6), 871-897.
Howard, P. and N. Mazaheri, (2009), “Telecommunications reform, internet use and mobile phone adoption in the developing world”, World Development, 37(7), 1159-1169.
ITU, (2013), “Taxing telecommunication/ICT services : An overview.”
https://www.itu.int/en/ITU-D/Regulatory-Market/Documents/Taxation%20Study-final-en.pdf
Keen, M. and C. Kotsogiannis, (2002), “Does federalism lead to excessively high taxes?”, American Economic Review, 92(1):363-370.
Laporte, B., de Quatrebarbes, C., and Y. Bouterige, (2019), “Partage de la rente et progressivité des régimes fiscaux dans le secteur minier : Une analyse sur 21 pays africains producteurs d’or”, FERDI Working Paper P252.
Li, W., and L. C. Xu, (2004), “The Impact of Privatization and Competition in the Telecommunications Sector around the World”, The Journal of Law & Economics, 47(2), 395– 430.
Luca, O., and D. Mesa Puyo, (2016), Fiscal Analysis of Resource Industries : (FARI), http://dx.doi.org/10.5089/9781513575117.005
Matheson, T. and P. Petit, (2020), “Taxing telecommunications in developing countries”, International Tax and Public Finance, forthcoming.
Mistry, J. J. (2005), “A conceptual framework for the role of government in bridging the digital
divide”, Journal of Global Information Technology Management, 8(3), 28–47.
Noll, R. G. (2000), “Telecommunications reform in developing countries”, in A. O. Krueger (Ed.), Economic policy reform: The second wave. Chicago, IL: University of Chicago Press. Pedros, X. and M. Sivakumaran, (2019), Rethinking mobile taxation to improve connectivity, GSMA Intelligence.
Rota-Graziosi, G. (2018), “The supermodularity of the tax competition game”, Journal of Mathematical Economics, 82: 25-35.
Steinmüler, E., Thunecke, G. and G. Wasmer, (2019), “Corporate Income Taxes around the World: a survey on forward-looking tax measures and two applications”, International Tax and Public Finance, 26(2), 418-459.
Summers, L. H., Bosworth, B. P., Tobin, J., and P. M. White, (1981), “Taxation and corporate investment: A q-theory approach”, Brookings Papers on Economic Activity, (1), 67-140.
Wilson, J. D. (1986), “A theory of interregional tax competition”, Journal of Urban Economics 19(3), 296-315.
Zodrow, G. R. and P. Mieszkowski. (1986), “Pigou, Tiebout, property taxation, and the underprovision of local public goods”, Journal of Urban Economics 19(3), 356-370.
29
Appendix A: Some characteristics of the studied countries in 2018
Population GDP/capitaEUR (2018)
Unique subscribers Market penetration Number of MNOs Date of liberalization ARPU by subscriber in EUR 3G network coverage by population SIM cards per subscriber Algeria 42,228,429 3,487.6 74.97% 3 2002 5.19 90.00% 1.57 Angola 30,809,762 2,913.9 45.50% 2 2001 14.12 61.00% 1.04 Benin 11,485,048 1,099.1 46.94% 4 2000 6.07 63.36% 1.66 Burkina Faso 19,751,535 726.5 44.78% 3 2000 4.85 65.00% 2.15 Cameroon 25,216,237 1,359.2 50.08% 4 1998 5.54 74.99% 1.51 Chad 15,477,751 643.2 36.09% 3 1998 5.5 36.89% 1.71
Congo, Dem. Rep. 84,068,091 493.4 37.22% 4 2001 2.42 53.10% 1.23
Cote d'Ivoire 25,069,229 2,039.6 50.94% 4 1997 9.52 94.44% 2.48 Egypt 98,423,595 2,160.6 67.33% 4 2003 2.2 99.00% 1.51 Ethiopia 109,224,559 653.9 41.50% 1 - 0.85 85.00% 1.38 Gabon 2,119,275 7,047.7 61.43% 3 2000 19.15 63.64% 2.23 Ghana 29,767,108 1,950.7 53.69% 6 1990 7.13 85.00% 2.29 Guinea 12,414,318 871.0 49.34% 4 2005 5.58 65.00% 1.75 Kenya 51,393,010 1,512.9 50.64% 3 2000 6.41 88.00% 1.6 Madagascar 26,262,368 467.2 30.86% 4 1998 4.18 81.46% 1.21 Mali 19,077,690 797.3 48.54% 3 2003 7.59 31.63% 2.36 Morocco 36,029,138 2,854.1 72.40% 3 2000 8.11 98.00% 1.7 Niger 22,442,948 506.2 32.66% 4 2002 5.37 62.76% 1.45 Nigeria 195,874,740 1,800.5 49.69% 4 1999 5.75 70.00% 1.57 Senegal 15,854,360 1,298.2 50.78% 3 1997 6.86 85.00% 2.00 Sierra Leone 7,650,154 473.0 46.79% 3 2003 6.33 40.02% 1.64 South Africa 57,779,622 5,645.9 66.69% 4 1994 16.16 99.20% 2.36 Tanzania 56,318,348 939.8 42.03% 6 2005 3.38 48.96% 1.61 Tunisia 11,565,204 3,046.0 75.41% 3 2002 3.93 97.00% 1.95 Zambia 17,351,822 1,378.5 45.96% 3 1995 4.42 40.00% 1.77 Africa 1,303,404,680 2,319.0 49.15% 2.76 - 5.7 69.99% 1.65 World 7,591,932,907 9,646.9 69.58% 3.08 - 17.55 89.85% 1.544
Sources: WDI, GSMA Intelligence, ITU Measuring the Information Society Report 2018 – Volume 2, and google search.
Note: 3G network coverage by population correponds to "3G mobile coverage, expressed as a percentage of the total market population, at the end of the period."
30
Appendix B: Tax advantages (exemption and reduced rates) in 2018
Advantage Number of years
Losses carry forward (Nb.
Years)
Advantage of yearsNumber
Allowance for special taxes on turnover (% of turnover) Other taxes
Algeria Exempt. 3 4 Exempt. 0.15 Professional tax (exempt.), 3 years
Angola Reduced rate: 20%
2 3 0.15
Benin Exempt. 5 3 Exempt. 0.15
Burkina Faso Exempt. CIT min. tax
1 4 Exempt. 0.15 Apprenticeship tax (exempt.), 7 years.
Cameroon Reduced rate: 75%
5 Year 6 to 10
4 Reduced
rate: 5%
- Bussiness licensing fees (exempt.), 2
years.
Chad Exempt. 5 3 Exempt. 0.15
Egypt 5 Reduced 0.15
Ethiopia 5 Exempt. 6 0.15
Gabon Exempt. 2 5 Reduced
-Cote d'Ivoire Tax credit 5 0.05 Tax credit (25%) on Bussiness License fees and payroll charges for national employees. DRC Exempt. 1 Infinite 0.15 Ghana 3 0.15 Guinea Exemption Reduced rate by 50% by 25% Year 1 and 2 Year 3 and 4 Year 5 and 6
3 0.15 Lump-sum levy on salaries,
Apprenticeship tax: Reduction by 100% for the first 2 years, 50% for year 3 and 4, 25% for year 5 to 8.
Kenya Reduce rate at 27%
3 9 0.15
Mali Reduce rate at
25% 15 3 Exempt. 3 0.1 Morocco Exemption Reduce rate at 17.5% 5 Infinite
4 0.15 Local taxes (exempt.), 5 years
Niger Exempt. 7 3 Exempt. 7 0.22
Nigeria Exempt. 5 Infinite 0.15 Apprenticeship tax reduced by 50%.
Senegal 3 Exempt. 3 0.2 Lump-sum levy (exempt.), 3 years.
Sierra Leone Exempt. 5 10 0.15
South Africa Infinite 0.15
Tanzania Exempt. 5 Infinite Exempt.
-Tunisia Exemption Reduce rate by 50% Year 1 to 10 Year 11 to 20 5 0.15
Zambia Exempt. 5 5 Exempt. 5 0.15
Source: Discussions with financial services of some telecommunication companies, investment and general tax codes, and authors assumptions.
Appendix (online)
Appendix O.I: TELCO’s accounting and financial assumptions
Table O.I.1: Descriptive statistics for TELCO's accounting data computation.
Variable Obs Mean Std. Dev. Min Max Percentage of
missing values
Turnover/Final consumption (ToFC) 1,584 .0001264 .0001419 8.15e-09 .0015828 .3764
Opex/Turnover 88 .4938151 .1167453 .319425 .788625 .8425
Capex/Turnover 313 .2210995 .1346501 .00505 .911525 .8768
Tang.Capex/Capex 69 .8691934 .1884045 .2329916 1.013813 .9783
Cost of equipment/Opex 83 .0463415 .0229626 .000539 .0995864 .9752
Cost of personnel/Opex 125 .10545 .0482724 .0002055 .263306 .9661
Domestic inbound minutes of use/Subscriber 58 78.74932 62.06309 7.809492 250.0107 .9606
Domestic outbound minutes of use/Subscriber 30 273.6386 108.9875 121.3219 478.9531 .9622
International inbound minutes of use/Subscriber 63 62.58331 73.94194 .8589212 264.4342 .9579
International outbound minutes of use/Subscriber 77 27.87493 15.79096 2.62794 65.2664 .9618
Total SMS/Subscriber 128 158.5911 185.1106 .1344846 749.5158 .9197
Operator’s subscribers 2,536 1433894 3027245 0 2.80e+07 .0000
National total subscribers 2,540 6961383 1.35e+07 1187 9.38e+07 .0000
Number of operators 2,540 3.797638 1.871406 1 10 .0000
Final consumption 2,216 2.43e+10 5.35e+10 4.14e+8 3.82e+11 .1110
Population 2,540 2.43e+07 3.51e+07 4035 1.93e+08 .0000
Total market penetration 2,540 .1446449 .1821082 0 1.205 .0000
Table O.I.2: Summary of assumptions.
Parameters Percentage
Rental value of business property occupation in Other* Opex
5
Wages and salaries in cost of personnel 70
Sales commission on phone top-ups in Other* Opex
10
Petroleum products share in other Opex 5
Discount rate 10
Imported capex in total capex 80
Share of tangible capex in total capex 95
Debt to capital ratio 60
Equity to capital ratio 40
Interest rate 10
Repayment period 5
Share of salaries paid to foreign workers 5
Source: Authors assumptions.