Vous avez des questions? Nous pouvons vous aider. Pour communiquer directement avec un auteur, consultez la première page de la revue dans laquelle son article a été publié afin de trouver ses coordonnées. Si vous n’arrivez pas à les repérer, communiquez avec nous à [email protected].
Questions? Contact the NRC Publications Archive team at
[email protected]. If you wish to email the authors directly, please see the first page of the publication for their contact information.
https://publications-cnrc.canada.ca/fra/droits
L’accès à ce site Web et l’utilisation de son contenu sont assujettis aux conditions présentées dans le site
LISEZ CES CONDITIONS ATTENTIVEMENT AVANT D’UTILISER CE SITE WEB.
READ THESE TERMS AND CONDITIONS CAREFULLY BEFORE USING THIS WEBSITE. https://nrc-publications.canada.ca/eng/copyright
NRC Publications Archive Record / Notice des Archives des publications du CNRC :
https://nrc-publications.canada.ca/eng/view/object/?id=44e940ff-d25f-4c22-92ee-55dab7f31854
https://publications-cnrc.canada.ca/fra/voir/objet/?id=44e940ff-d25f-4c22-92ee-55dab7f31854
NRC Publications Archive
Archives des publications du CNRC
This publication could be one of several versions: author’s original, accepted manuscript or the publisher’s version. / La version de cette publication peut être l’une des suivantes : la version prépublication de l’auteur, la version acceptée du manuscrit ou la version de l’éditeur.
Access and use of this website and the material on it are subject to the Terms and Conditions set forth at
Three-dimensional analysis of an artificial island
Ser
I-,
-.
--
I -..j , .TH1
N21d
National Research
Conseil national
no.
1279
Council Canada
de recherches Canada
e.
2
IBI9G
THREE-DIMENSIONAL ANALYSIS OF AN
ARTIFICIAL ISLAND
~ r a
AL'QZED
i
f
85- .OF
-
71
FI
i
I
B I ~ L I . T H * ~ Q U E
i
R d .
W ? : m
C - ~ R C-
i1
-
-*...--
7.-
---
Reprinted from
Proceedings of the Conference Arctic '85
ASCE, San Francisco, CA. March 25
-
27, 1985
p. 617 - 6 2 5
DBR Paper No. 1279
Division of Building Research
On a e f f e c t u d u n e a n a l y s e non l i n e a i r e p a r l a k t h o d e d e s Blements f i n i s a f i n d ' e t u d i e r l ' i n f l u e n c e d e l a c h a r g e t r i d i m e n s i o n n e l l e e t de l a geometric s u r l a d e f o r m a t i o n e t l a r u p t u r e d ' u n e I l e a r t i f i c i e l l e . Les r e s u l t a t s d e s c a l c u l s d e l a d e f o r m a t i o n p l a n e e t d e s c a l c u l s t r i d i m e n s i o n n e l s s o n t c o m p a r e s . L e s c a l c u l s i n d i q u e n t q u e l ' a n a l y s e d e l a d e f o r m a t i o n p l a n e n e d o n n e p a s t o u j o u r s d e s r e s u l t a t s c o m p o r t a n t u n e m a r g e a d e q u a t e d e s B c u r i t 6 . S e l o n l a c o n f i g u r a t i o n d e l a c h a r g e , une a n a l y s e t r i d i m e n s i o n n e l l e p e u t p r e d i r e d e s d e f o r m a t i o n s p l u s i m p o r t a n t e s e t une r e s i s t a n c e l a '
--
z ~ - - - 1 1 % r h a r z e g l a c e s u r une f l e ar --sux a x e s d e c n d u i s a n t B I B s i l ' o n 1 a n a l y s e sReprinted from Proceedings o f the Conference Arctic '85/ A S C E / S ~ ~ I+ancisco,
ma march
25-27, I985THREE-DIMENSIONAL ANALYSIS OF AN ARTIFICIAL ISLAND
E. ~ v ~ i n l and N.R. ~ o r ~ e n s t e r n , ~ M. ASCE Abstract
A nonlinear, finite element analysis has been carried out to investigate the influence of three-dimensional loading and geometry on deformation and failure of an artificial island. The results of plane-strain and three-dimensional computations are compared.
Calculations indicate that plane-strain analysis does not always yield results on the safe side. Depending on the loading configuration, a three-dimensional analysis can predict larger deformations and smaller load-carrying capacity. When the ice load on an artificial island increases gradually, the principal stress axes rotate; the paths to failure are significantly different in plane-strain and three- dimensional analyses.
Introduction
In recent years caisson-retained artificial islands have been built to facilitate offshore hydrocarbon exploration in the Canadian
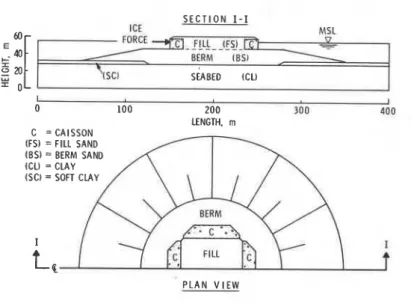
Arctic. In one instance (Figure 1). four concrete caissons were set
down on a previously prepared sand berm built below mean sea level to provide support for fill material. They were not rigidly connected to each other. The design of this type of island requires consideration of the three-dimensional interaction of the ice sheet, the rubble ice, structural components and soils. Ice forces acting on the caissons are eventually transferred to the seabed soils, but the way in which the load transfer takes place depends on the mechanical properties of the different materials and the characteristics of the interaction among them. The pattern of load transfer affects both stability and the magnitude and distribution of deformations.
Most present design practice in geotechnical engineering is based on plane-strain analysis, with the implicit assumption that the results of a two-dimensional analysis are conservative in comparison with predictions made by means of three-dimensional calculations. The validity of this assumption has been demonstrated for some soil structures on land, but it remains to be shown for artificial islands subjected to large ice forces. This paper compares the results of two- and three-dimensional, nonlinear, finite element analyses for an artificial island.
Research Associate, Division of Building Research, National Research
Council of Canada, Ottawa, Canada. K1A 0R6.
2Professor, University of Alberta, Edmonton, Alberta, Canada, T6G 267.
ARCTlC OFFSHORE ENGINEERING MFI
...-
S E C T I O N I 60 FORCE Ibt*-
_F!LL WSI EFRM lBSl y ~ ~ ~ ) SEABED (CLJ 0 1 0 0 2 0 0 3 0 0 4 0 0 I LENGTH. m C =CAISSON (FSJ = FILL SAND (BSJ = BERM SAND BERM\
P L A N V I E WFigure 1. Geometry of a caisson-retained island
I 0 5 0 1 2 0 1 5 0 2 0 0 I
7
R I G H T S I D E I I 200 2 5 0 2 8 0 3 5 0 4 0 0 L E N G T H , rnAnalysis of Caisson-Retained Island
ADINA (1) is a reliable and efficient general-purpose, finite element program for nonlinear analysis of continua, and was used in the present study to predict the behaviour of Tarsiut Island ( 5 ) . The hyperbolic nodel developed by Duncan and Chang ( 2 ) was implemented in ADINA in the allocated space for user-supplied constitutive relations. This capacity has now been extended to two- and three-dimensional cases. Suitable changes were also made to accommodate the initial stresses present in the seabed soils.
Figure 1 shows a cross-section and plan view of the island and the different types of material modelled in the analysis. The as-built profile may well be quite different. Representative parameters were established from the published literature ( 3 ) on similar soils and more detailed information may be found in Reference 4.
Ice forces were applied directly on the face of the caissons 1 m below mean sea level. It was assumed that the ice sheet would provide any desired horizontal force on the structure so that analysis could be carried out until the displacements were very large.
Plane-Strain Analysis
The finite element mesh shown in Figure 2 was used for plane- strain analysis. Layers of berm and fill material were placed on the seabed in sequence to represent stages of the construction. Surcharge on the surface was applied in increments before the island was
subjected to ice forces. The plane-strain curve in Figure 3 shows the horizontal displacement of the front caisson at the point of
application of ice force.
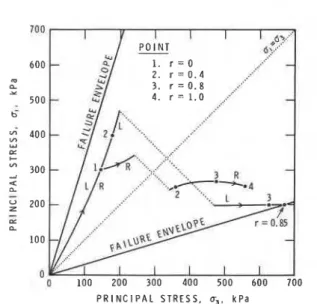
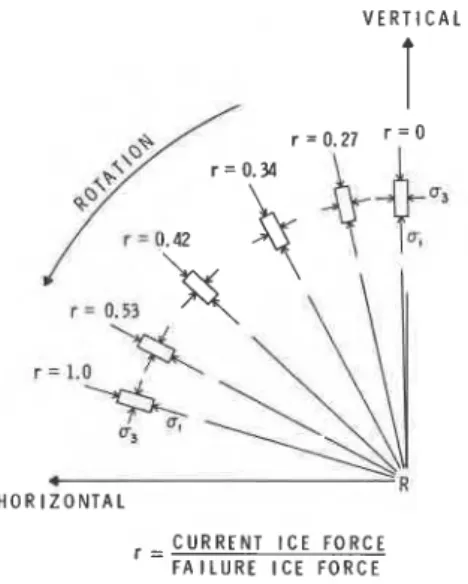
The stress paths followed by soil elements in the berm were calculated at points L and R (Figure 2 ) ; the stress-path for each point is plotted on Figure 4. In order to relate the state of stress on a stress path to the magnitude of ice forces, a load ratio, r, is defined as the ratio of ice load at any instant to the ice load at failure. Under increasing ice loads it appears that rotation of principal stress axes takes place in both cases. For point L, which is on the left side of the centreline, the mobilized strength continues to increase until failure. At point R, which is on the right side of the centreline, the stress-path indicates a decrease in mobilized strength while the hydrostatic component of stress increases until nearly the end of the analysis. As an illustration, the
rotation of principal stress axes is shown on Figure 5 for point R as a function of load ratio. Failure load was assumed to be at the point of maximum curvature on the ice force versus horizontal displacement curve, as indicated on Figure 3.
Three-Dimensional Analysis
The plan view of the mesh used for three-dimensional analysis is shown in Figure 6. The cross-section of the mesh along plane 1-1 is
620 ARCTIC OFFSHORE ENGINEERING I C E F O R C E . M N l m 0 5 10 15 20 ' 25 - 0 . 2 I I 1 I FAILURE ICE
-
LOAD FORz
0 . 2 - u z u 0 . 4 - U-
a2
0 . 6 - 3-0 "3-
n 0 . 8 - 2:
1 . 0-
Z ICE FORCE = q.
do
-
(PER UNIT WIDTH) STRAIN-
w q = ICE PRESSURE
1 . 4
-
d = ICE THICKNESS1 . 6
.
IFigure 3. Comparison of ice force vs horizontal displacement response obtained from plane-strain and 3-D analyses
0 100 200 300 400 500 600 700
P R I N C I P A L S T R E S S . u3, k P a
Figure 4. Stress paths in plane-strain analysis for soil elements at points L and R (shown in Figure 2)
ARTIFICIAL ISLANDS ANALYSIS V E R T I C A L
H O R I Z O N T A L
,
= C U R R E N T I C E F O R C E F A I L U R E I C E F O R C E (NOTE: SEE FIG. 3 FOR FAILURE ICE FORCE)Figure 5. Rotation of principal stress axes at point R in plane-strain analysis
I C E M O V E M E N T
___,
622 ARCTIC OFFSHORE ENGINEERING
identical to that for plane-strain analysis, illustrated in Figure 2. Ice forces were increased gradually from zero up to very large values. In three-dimensional computations the load-displacement predictions depended on how the loads acted on the structure. Types of ice load
applied on the caissons are shown in Figure 7. The selection of the
three loading configurations was based on a separate three-
dimensional, finite element analysis. They reflect different stages of growth of the ice sheet round the island.
Ice forces versus horizontal displacements for caisson CS-1,
facing the ice load, are plotted in Figure 3. As a common criterion,
the normal ice force on caisson CS-1 is shown on the vertical axis in Figure 3. Mfferent curves illustrate how the behaviour of the island changed with different loading patterns, labelled CASE-I, CASE-11 and CASE-111. For example, the curve for CASE-I was produced when normal
ice force was applied only on the face between points A and B; there
was no tangential force. This situation may occur if an ice sheet comes in contact with the front caisson for the first time at the beginning of the winter. The other two predictions were obtained when additional normal and tangential forces were applied on the faces of
the caissons between points B and C for CASE-11, and between each of
points B and C and C and D for CASE-111. Ice forces on the front
caisson, between points A and B, were identical in all three cases.
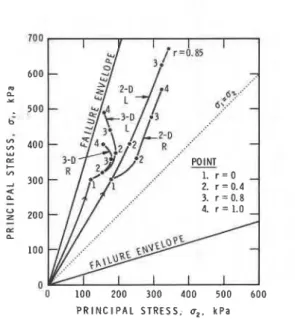
The stress-paths followed by soil elements at points L and R in 3-D analysis for CASE-I1 are shown in Figure 8. Load ratio, r, defined in the section on plane-strain analysis is used. Failure load was
assumed to be 9 MN/m. Comparison of intermediate principal stresses
in plane strain and 3-D analyses is illustrated in Figure 9.
NS = NORMAL STRESS q = ICE PRESSURE ICE FORCE
TS = TANGENTIAL STRESS d = ICE THICKNESS (PER UNIT WIDTH) = q . d
P R I N C I P A L S T R E S S , u,, k P a
Figure 8. Stress paths in 3-D analysis for soil elements at points L and R (shown in Figure 2)
"0 100 200 300 400 500 600 P R I N C I P A L S T R E S S , u,, k P a
Figure 9. Comparison of intermediate principal stresses obtained from plane-strain and 3-D analyses
624 ARCTIC OFFSHORE ENGINEERING Interpretation of Results
With the same load applied on the front face of each caisson, between points A and B, horizontal displacements were different in all three analyses. With additional loads applied on the other faces of the caissons, as for CASE-I1 and CASE-111, displaceme..ts became larger. This is an obvious result that does not need any finite element analysis, but it serves several purposes. If the ice force is measured, in practice, on the front face of caisson CS-1 and a
two-dimensional finite element computation is used to predict displacements, the calculated values will be much less than the displacements predicted by three-dimensional analysis, except for CASE-I. A two-dimensional analysis would therefore give smaller deformations for a given ice pressure.
In addition, if the stability of the island is considered for a measured ice load, for example 12 MN/m on the front caisson, it becomes unsafe to use two-dimensional results because, according to the three-dimensional analyses indicated as CASE-I1 and CASE-111, the structure fails for the same load.
Another important result is the difference in the magnitude of the intermediate principal stresses for different calculations. In a plane-strain analysis, the intermediate principal stress is always equal to the sum of the major and minor principal stresses multiplied by the Poisson's ratio. In 3-D analysis, for example, the
intermediate principal stress for loading CASE-I1 did not increase continuously and was much less than that shown by plane strain analysis. Smaller intermediate principal stresses in 3-D analyses were the result of substantial lateral movements in the horizontal direction perpendicular to the direction of the major ice action. In fact, the horizontal movement of the caisson labelled CS-2 in Figure 7
was 34 cm in the Y direction while at the same time caisson CS-1 moved 135 cm in the X direction.
Conclusion
This study was carried out to explode, the influence of 3-D loading and geometrical effects on displaaements and failure loads of an artificial island subjected to horizontal ice forces. The results of plane strain and 3-D finite element analyses are compared. A general purpose, finite element program, ADINA, was used in all calculations. The main conclusions of the analyses may be summarized as follows:
1) Depending on loading configuration, a two-dimensional analysis may give displacement and failure load larger than those predicted by a three-dimensional analysis.
2) Stress-paths for two- and three-dimensional analyses differ significantly from each other.
3) The intermediate principal stresses calculated in 3-D analysis are much smaller than those of plane strain. This was due mainly to the
ARTIFICIAL ISLANDS ANALYSIS 625
lateral movements of caisson CS-2 and to the fill material, suggesting that:
(a) it may be appropriate to adopt failure criteria more representative than MohrCoulomb,
(b) the limitations should be recognized of any stability analysis that is based on the assumption of no movement in the direction perpendicular to the plane of major mass movement.
1. Bathe, K.J., "ADINA
-
A Finite Element Program for Automatic Dynamic Incremental Nonlinear Analysis," M.I.T., Mechanical Engineering Dept.. Acoustics and Vibration Laboratory, Report 82448-1, 1975.2. Duncan, J.M. and Chang, Y-Y., "Nonlinear Analysis of Stress and Strain in Soils," Journal of Soil Mechanics and Foundation Division, ASCE, Val. 96, No. SM5, (Proc. Paper 7513) 1970, pp. 495-498.
3. Duncan, J.M., Byrne, P.M., Kai, S. and Mabry, P., "Strength, Stress-Strain and Bulk Modulus Parameters for Finite Element Analyses of Stresses and Movements in Soil Mass," University of California. Berkeley, Report No. UCB/GT/80-01, 1980.
4. Evgin, E., and Morgenstern, N.R., "Unified Analysis of Offshore Structures." National Research Council of Canada, Ottawa. Contract OSU83-00111, 1984, 50 p.
5. Fitzpatrick, J. and Stenning, D.G., "Design and Construction of Tarsiut Island in the Canadian Beaufort Sea," Proceedings of Fifteenth Offshore Technology Conference, Houston, Texas, Vol. 2,
T h i s p a p e r , w h i l e b e i n g d i s t r i b u t e d i n r e p r i n t f o r m by t h e D i v i s i o n o f B u i l d i n g R e s e a r c h , r e m a i n s t h e c o p y r i g h t of t h e o r i g i n a l p u b l i s h e r . I t s h o u l d n o t b e r e p r o d u c e d i n whole o r i n p a r t w i t h o u t t h e p e r m i s s i o n of t h e p u b l i s h e r . A l i s t o f a l l p u b l i c a t i o n s a v a i l a b l e f r o m t h e D i v i s i o n may be o b t a i n e d by w r i t i n g t o t h e P u b l i c a t i o n s S e c t i o n , D i v i s i o n o f B u i l d i n g R e s e a r c h , N a t i o n a l R e s e a r c h C o u n c i l o f C a n a d a , O t t a w a , O n t a r i o , K1A 0R6.