HAL Id: hal-02296003
https://hal-enac.archives-ouvertes.fr/hal-02296003
Submitted on 24 Sep 2019
HAL is a multi-disciplinary open access
archive for the deposit and dissemination of
sci-entific research documents, whether they are
pub-lished or not. The documents may come from
teaching and research institutions in France or
abroad, or from public or private research centers.
L’archive ouverte pluridisciplinaire HAL, est
destinée au dépôt et à la diffusion de documents
scientifiques de niveau recherche, publiés ou non,
émanant des établissements d’enseignement et de
recherche français ou étrangers, des laboratoires
publics ou privés.
Creating Accessible Interactive Audio-Tactile Drawings
Using Spatial Augmented Reality
Lauren Thévin, Christophe Jouffrais, Nicolas Rodier, Nicolas Palard, Martin
Hachet, Anke Brock
To cite this version:
Lauren Thévin, Christophe Jouffrais, Nicolas Rodier, Nicolas Palard, Martin Hachet, et al..
Cre-ating Accessible Interactive Audio-Tactile Drawings Using Spatial Augmented Reality. ISS 2019,
ACM International Conference on Interactive Surfaces and Spaces, Nov 2019, Daejeon, South Korea.
�10.1145/3343055.3359711�. �hal-02296003�
Creating Accessible Interactive Audio-Tactile Drawings
Using Spatial Augmented Reality
Lauren Thevin
Inria Bordeaux,
Talence, France
LMU München,
Munich, Germany
[email protected]
Christophe Jouffrais
CNRS, IPAL, UMI2955
Singapore, Singapore
CNRS, IRIT, UMI5505
Toulouse, France
[email protected]
Nicolas Rodier
Université Paul Sabatier, IRIT
Toulouse, France
[email protected]
Nicolas Palard
RealityTech
Pessac, France
[email protected]
Martin Hachet
Inria Bordeaux
Talence France
[email protected]
Anke M. Brock
ENAC – Université de Toulouse,
Toulouse, France
[email protected]
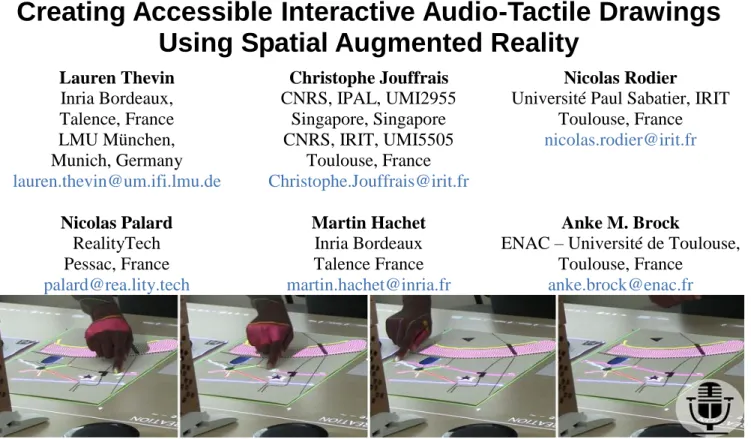
Figure 1.A teacher draws interactive zones directly on a tactile map with his finger and records the associated audio-feedback using a microphone. Touching the same zone will later launch the recorded audio-feedback.
ABSTRACT
Interactive tactile graphics have shown a true potential for people with visual impairments, for instance for acquiring spatial knowledge. Until today, however, they are not well adopted in real-life settings (e.g. special education schools). One obstacle consists in the creation of these media, which requires specific skills, such as the use of vector-graphic software for drawing and inserting interactive zones, which is challenging for stakeholders (social workers, teachers, families of people with visual impairments, etc.). We explored how a Spatial Augmented Reality approach can enhance the creation of interactive tactile graphics by sighted users. We developed the system using a participatory design method. A user study showed that the augmented reality device allowed stakeholders (N=28) to create interactive tactile graphics more efficiently than with a regular vector-drawing software (baseline), independently of their technical background.
Author Keywords
Spatial augmented reality; accessibility; visual impairment; audio-tactile drawings; content creation; accessible maps;
accessible graphics.
CSS Concepts
• centered computing~User studies • centered computing~Interaction devices • Human-centered computing~Accessibility systems and tools
INTRODUCTION
Because students with visual impairments cannot see visual contents well or at all, special education centers for people with visual impairment (PVI) use tactile graphics. Tactile graphics can be explored by touch and are used to make spatial content accessible in STEM, Geography, History, Orientation and Mobility (O&M) classes, etc. Tactile drawings can be produced of raised lines drawing [18], or using real objects [34]. Another possibility is to use small-scale models [11,14]. To provide textual information associated to these graphics (e.g. for labeling), braille is commonly used [33]. Another solution is to make them interactive by associating audio feedback to specific areas. Various technologies have been explored to make tactile graphics and models interactive: multi-touch devices [4], electronics [11], RGB image processing [31], bar-code scanning [15] or depth cameras [1]. Such approaches have two main advantages compared to braille labeling: first they are accessible to people who do not read braille, and second, they can be reconfigured easily.
In most studies, interactive tactile drawings were made by the research teams. Some tools automatically generate
Publication rights licensed to ACM. ACM acknowledges that this contribution was authored or co-authored by an employee, contractor or affiliate of a national government. As such, the Government retains a non-exclusive, royalty-free right to publish or reproduce this article, or to allow others to do so, for Government purposes only.
ISS '19, November 10–13, 2019, Daejeon, Republic of Korea
© 2019 Copyright is held by the owner/author(s). Publication rights licensed to ACM.
ACM ISBN 978-1-4503-6891-9/19/11…$15.00 https://doi.org/10.1145/3343055.3359711
printable tactile maps with audio annotations [18,23,36], but it can be complicated to modify them. Authoring tools for interactive tactile media have been proposed, but only few systems were tested by end users (e.g. special education teachers). Yet, for using interactive tactile media in the classroom, teachers should be able to create their own interactive tactile graphics easily. To reach this objective, we proposed a tool based on Augmented Reality (AR). Our contribution is i) a new concept where the same system is used for creating interactive tactile drawings by the teachers, and accessing them by PVI, ii) a concrete implementation, based on Spatial Augmented Reality (SAR), following a participatory design method, iii) a user study that evaluates the content creation with SAR compared to an existing Graphical User Interface baseline.
RELATED WORK
Alternatives to visual graphics
Digital graphics usually embed a textual description which is rendered on a braille display or as audio output. In practice, the usefulness of such textual descriptions have shown to be limited [13]. Another technique is the use of tactile graphics with braille captions. As stated in the introduction, they are used by PVI, e.g. for education and mobility training. Braille can provide independent reading, however less than 20% of blind and low vision people can read it [26]. Braille labelling on a tactile drawing is challenging [18], as it requires abbreviations on the graphics which refer to a braille key aside the tactile drawing [23]. The lecture of this key interrupts the exploration process, adds complexity and takes room on the map [28]. Finally, tactile exploration is limited to the fingertips [16], so annotations on the drawing can be difficult to associate with the related areas [15]. Previous studies with PVI have shown that interactive maps are more efficient and satisfactory to use [4], and that interactive 3D printed models better support memorization of text and geographic elements than tactile maps with braille [11]. Audio is also adapted for mathematical equations with a spatial organization, where braille is not optimal [27].
Advantage of interactivity for tactile drawings
Audio techniques have been proposed to make digital graphics accessible, e.g. for online [5] and e-book content [13]. Ducasse et al. [7] classified those approaches as DIMs (Digital Interactive Maps). It is also possible to combine audio feedback with interactive physical surfaces (pin array or raised-line drawings). Those approaches were called HIMs (Hybrid Interactive Maps) [7]. Interactivity offers new options in terms of feedback and features. In [1] and [8], two modes for using an interactive map were proposed. The first one (exploration) provides audio captions for an element that the user points to. The second mode (map construction) allows the VI user to build a map by providing audio questions (e.g. “Position the train station on the map”) and directional assistance (e.g. “Move your finger to the left”). Constructive exploration was also proposed by [30] to enhance spatial knowledge acquisition.
Audio and tactile feedback of interactive media
In the literature, audio content is produced with two main techniques: using pre-registered and synthetic audio-files (e.g. [19,20,30]), or TTS synthesis (e.g. [1,23,34]). One system proposes audio-recording on-the-fly by registering the audio feedback with a microphone [24].
Tactile feedback can be physical or digital, from devices as pad and video-game controllers (e.g. [28]) for the general public to adapted devices for special needs users (e.g. [19]). Touch screen exploration has been proposed for virtual maps (e.g. [29]), as well as force feedback (e.g. [30]). Finally, pin arrays systems display digital maps dynamically ([24,37]).
Creation of Accessible Interactive Tactile Drawings
Recent works proposed automatic methods for the creation of interactive tactile drawings. For geographic maps in particular, the content can be retrieved from existing databases or through image processing (e.g. [18,23,36]). However, a comprehensive solution for automatic tactile (let alone interactive) map generation does not exist [35]. Besides, when maps are created automatically, the content is more difficult to modify for the users. In a study with maps on a pin-array [37], the users labelled maps using OpenStreetMap, and a computer with a keyboard. In [24], the user could set the pins’ heights in an 8*8 pin array and register audio feedback for each pin. Special education teachers are used to crafting the tactile content for their classes [31]. We identified two approaches [31] to author accessible interactive tactile content from physical objects. In the first one, the content is embodied directly within the object, e.g. electronics [6,11,12,14]. This approach has low flexibility in associating audio content and requires high prototyping skill. The second consists in digitally modeling the object with the associated content, printing it in 3D and then tracking the object through a camera for detecting the user’s touch [31,32]. Such approach is flexible as the content can evolve, but it requires 3D modelling skills. A variant is to use image processing to recognize an annotated content [10]. In [10], textual annotation is done with a GUI in ten minutes. Even if presented as low-barrier by the authors, these approaches require specific skills, and hinder the adoption by end-users such as specialized teachers or families of PVIs. These approaches do not easily allow them to add audio-content on their existing media.
Authoring tool for Teachers
Only few works aim to provide teachers with the ability to augment their existing tactile media with audio feedback, independently of whether there exists a digital version (e.g. 3D model) of these media or not. GraAuthor [13] is an authoring tool dedicated to professionals and relatives of PVI to create accessible interactive graphics through a GUI associating audio feedback to existing tactile graphics. This system proposes limited interactive elements (simple lines, rectangles, circles, and polygons), and the content creation was not evaluated by the teachers. The Tactile Graphics Helper [10] was presented to two teachers, within the
laboratory, only one teacher interacted with the prototype. The research team created the content which was evaluated by students. In the work presented in [34], six teachers were able to create their own content in a classroom context for VI students. This work also used a GUI interface to associate audio feedback to existing tactile maps, a botanical atlas from real leaves, or small-scale models. Yet, the teachers had to move from a computer with a GUI for creating the content, to a SAR system to test the content. To conclude, we observed that a major factor for increasing the adoption of interactive graphics in classrooms for PVI consists in facilitating the creation of interactive audio-tactile content for stakeholders (e.g. teachers and families of PVI). It includes limiting the necessary skills and time [20].
ITERATIVE DESIGN OF THE SYSTEM
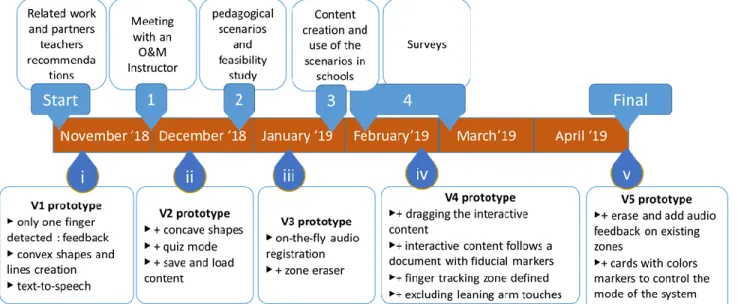
We followed a participatory design approach as summarized in Figure 2. Our process involved more than fifty children with and without VI and more than ten teachers in special education and mainstream schools from three countries (France, Greece and Romania). The teachers prepared six pedagogical scenarios related to their lectures in History, Geography, O&M, Arts and Sports. The system was also presented in a workshop to forty-five professionals or adults with VI in six groups.
Downsides of GUI based content creation
We identified elements to improve from the previous works on content creation. The first element is that the current techniques use GUI-based tools on computers. This requires switching devices between the computer with the GUI (content creation), and the prototype (content exploration). In these conditions, no direct tests of the new content are possible. Moreover, working on a GUI necessitates to work on a digital picture of the tactile media, and not directly on the tactile media. The study of the literature as well as the discussions with the target users led us to the idea of superimposing digital feedback and physical tactile media
(e.g. tactile drawings) [2] for content creation. Similarly, ARtalet [16] uses see-through AR to edit an AR book (audio and tactile feedback). Even if the results are provided on a screen, AR solves the GUI downsides in content creation.
Choosing Spatial Augmented Reality and PapARt
We used SAR to create content directly on tactile media. SAR directly augments existing objects, e.g. by projection [3]. Using the PapARt system [22] we rely on the same device and interaction for content creation and content use. PapARt is a SAR toolkit originally designed for both physical and digital drawings. The PapARt toolkit is composed of hardware (depth and RGB cameras, projector), an API and existing applications. The PapARt API allows tracking a sheet of paper and turns it in an interactive screen. The interaction relies on touch detection by the depth camera. The color camera tracks color and fiducial markers. In the case of the content creation application, tactile maps can be augmented with interactive areas by directly touching the tactile media and recording speech (Figure 3). The content can be played back with the same system (Figure 5). In our study, we specifically addressed the content creation and authoring features. The usability study for the set up and the calibration will be done in the future.
Requirements for our SAR system
We identified the following requirements from the special education schools we worked with and from the literature:
Figure 2. Overview of the participatory design approach and evolution of the prototype.
Figure 3. With SAR, the user draws directly on the graphics with the finger (left) and registers the audio feedback (center) in the creation mode. On the exploration mode, the feedback is played when the user touches the zone (right).
Figure 5. (Top) teachers add interactive audio content on a map of Peloponnese with the SAR toolkit. (Bottom) The same teachers use the interactive map in an inclusive classroom.
R1. Exploring the map with two hands, as it is important for acquiring the relative and absolute spatial layout without vision [24] (PVI; Map exploration); R2. Playing audio caption only on demand, to avoid unwanted or too much audio feedback [4] (PVI, Map exploration); R3. Having two types of interactive zones: closed shapes and lines (Teachers, Map creation); R4. Easily adding audio feedback to an interactive zone (Teachers, Map creation). R1 and R2 concern the exploration of audio-tactile content by PVI and have been explored in our prior work (e.g. [1]). To sum up, we distinguish two handed exploration of the tactile drawing (several touches) from pointing to an object (one touch) to request audio feedback.
R3 (“Having two types of interactive zones”): in existing tactile graphics (e.g. maps and botanical atlas) most of the shapes and lines are more complex than those that can easily be drawn with GUI-based tools (circle, square, straight and curved lines). In those tools, complex shapes can be created with imprecise freehand tools or with Beziers curves mastered by experts. A solution is to draw by touch.
R4 ("Easily adding audio feedback”): adding pre-registered sound files requires navigating in the file system of a computer to store them in a predefined path. For using TTS, text must be written using the keyboard. In AR this is not convenient. Moreover, free TTS APIs are available in a limited number of languages and not necessarily very realistic. Therefore, in our prototype, we integrated a microphone to register audio feedback on the fly.
Final SAR system
We used the PapARt hardware and software as provided by the company RealityTech. The Hardware is composed of a 80 cm laser cut wood stand with a 3D printed base (see Figure 7). A video projector is placed on top of the stand, and an Orbec Astra depth color camera is placed on the stand at 60 cm height. The middleware is the open source Natar API, provided by the company. The API allows detecting finger touches and color patterns with their (x, y, z) coordinates. The visual feedback is computed with Processing. Inputs are done by pressing the associated key of the keyboard. We implemented the following modes: (1a) line creation : every touch draws a point connected to the previous one, (1b) shape creation: the touch of the finger is detected, and a concave closed shape is created when the touch stops, (2) activating the microphone: the recording of the audio annotation starts, (3) deactivating the microphone: the recording stops, (4) exploration: when the user touches inside a shape or at less than 0.5 cm of a line, the audio feedback is played (one feedback after another if multiple touches occur; if a new area is touched, the current feedback stops to play the new one). It is also possible to correct the content if needed: (5) resetting the drawing without annotations, (6) adding audio: if the feedback was not complete, step 2 and 3 can be immediately repeated, or a zone can be selected by touch later to add new sound, (7) eraser: in the eraser mode the user can delete the audio feedback associated to an interactive zone (line or shape) with a long touch on the
Figure 4. The six pedagogical scenarios. From top left to bottom right: map of the twelve labors of Hercules (History), faces with emotion (Arts), Torball (Sports), harbors and roads of Attica (O&M), Eastern Carpathians (Geography), Olympic games (History).
zone and a second long touch to erase the zone completely. The set up consists in fixing the projector and the camera on the stand. The camera, the projector, the microphone and the speakers for the audio-feedback are then plugged in the computer running PapARt. The application dealing with the modes described above is also on the computer. The calibration is provided with PapArt. It consists in a calibration sheet, tracked by the camera, to be positioned eight times at the position displayed by the projector.
In situ tests and questionnaires
We conducted in situ tests with the prototype. Six pedagogical scenarios (Figure 4) for use with the SAR system were provided by Greek and Romanian teachers of Arts, History, Geography, Sports and O&M, both from specialized and inclusive mainstream schools. The teachers implemented their scenarios from scratch with the toolkit, then used their own content in the classroom with VI and sighted students (Figure 5). After these sessions, they completed an online questionnaire in their own language.
Questionnaire
Special education teachers, groups of sighted students and a group of VI students (their answers compiled by the teachers, and called below “sighted child” and “VI child”) were asked to write down elements they noticed during the use of the SAR system called “toolkit”. They could freely indicate pros and cons about the use of the system. The different groups of participants were: “All”, “Child alone”, “Group of children”, “Adult”, “Group of adults”, “Sighted person”, “Person with VI”, “Professor, Professor of…” and “Other group…” (as identified by the participants themselves). Some groups overlap, and the participants were asked to answer twice if relevant. They were invited to mention positive and negative comments at three specific moments in time: (1) during the "familiarization", i.e. the presentation of the system before using it, (2) during the "use", (3) for the prospective future "re-use" of the system. We received nineteen replies: twelve from specialized teachers, one from a sighted child group, and six from VI-child groups. The comments concerned: (1) the sensory modalities—audio, visual, tactile—used with the device, (2) the interactive device itself—interactive modes, innovation/technology—, and (3) its use in context—ease of use/usefulness, curiosity/pedagogy, accessibility.
Questionnaires results
Sensory modalities
According to a specialized teacher there is a great interest for “multi-sensory integration of information (visual, tactile, auditory)”. A sighted child expressed: “I was thinking that the tool would be helpful because it would have audio information” (familiarization), and: “It would help me because it would also give acoustic information” (re-use). Another VI child said: “I was curious to see the machine that made the map speak” (familiarization) and: “I really like the machine talking when I was holding my finger” (use). A specialized teacher “was impressed with
the audio information given by the tool.” There is also interest regarding complementary visual feedback which we provide with a projector. A VI child mentioned: “it makes the paper have good colors”. Yet, audio feedback locations were not easy to find. A specialized teacher stated: “Students find it difficult to locate the marker and identify the point of interest during tactile exploration”.
Interactive Device
VI children generally showed interest in the tool: “great experience for the magic tool, to make the map talking” and “the tool is beautiful and big” (both familiarization), and: “I really liked that we recorded our own voices” (use).
Specialized teachers noted the interaction possibilities: “Additionally, it offers multiple choices at multiple levels (name, quiz, route, instructions ...)”, “It is also enjoyable to use more applications like the quiz”. One of the downsides was the detection of unintentional touches by VI-children, as they do not see the visual feedback indicating touch detections. A VI child said: “I did not know which points I can touch and which I cannot”, and a specialized teacher: “During the use of the system in the educational process it was found that the students, because of their lack of familiarity with the system, placed their entire palm on the map, so that a lot of information was heard at the same time. This decreased the usability of the tool”.
Use in context
Teachers gave good feedback for accessibility and ease of use, content creation and the use in the classroom, even if they found it difficult to use with large groups. They used adjectives like “helpful”, “accessible”, “fun”, “effective”. Teachers also found that “The tool is simple and easy to use”, and “the tool can be applied to any kind of map”. Interactivity with tactile maps was highlighted for use by children and PVI. Specialized teachers stated: “I found that students with VI engaged themselves in the process of learning, to gain the experience of interaction and to develop their wider skills”. The VI and sighted children also showed interest for use (“very good”, “it helps me”, “I liked it very much”), re-use (“It would be fun”), and content creation features. Several comments concerned the use in a pedagogical context. Specialized teachers mentioned “interest and curiosity”, “interesting and different”, “very useful for orientation and mobility teachers”, “The use of the tool has increased the interest and participation of pupils with visual impairments”, “In the future, I would like to be able to use this innovative tool in various courses, e.g. Geography, History and Physics”. VI children mentioned that: “I would like to use it with maps in history and geography”, “It makes the lesson more interesting”, “and it would help us during mobility lessons to hear the names of the roads” (re-use).
Improvements can be made by making the system more accessible as some features are currently not usable without vision, including installation and calibration. Moreover, the
size was perceived as too large (“big size”, “large tool”). Specialized teachers mentioned: “Using the toolkit, I found that visually impaired students are requesting the teacher's assistance to overcome some technological and ergonomic constraints.”, “It's a bit time-consuming to install the tool and focus the camera on the map”. A VI child mentioned: “we do not know if we will have a place in our classroom to install it” (re-use). Teachers also mentioned the “difficulty to obtain the tool” and “the cost”.
Analysis of Use
From the previously mentioned study, we were able to extract recommendations to further improve the system.
Moving the Interactive Content
The teachers created the audio content in advance and saved it. One of the issues when loading a recorded map was to position the tactile map exactly at the same place than during the creation. Thus, we developed two additional features:
1) dragging the interactive content to make it fit to the new position of the map, and 2) creating the zones on a tactile map with fiducial makers, so that the interactive content follows the tactile maps when moved. This was done by PVI during the tests to adapt the orientation and the distance between them and the tactile graphic. It can also help to support an ego-centric representation of the route [9,17].
Defining the Interactive Area
Since unintended touches were disturbing the users, we limited the interactivity by defining a rectangular interactive area. Before, all the elements of the table could be augmented, this area needs to be drawn with two fingers. This feature prevented false positives by restricting audio feedback to touches inside the defined area only. We also detected and removed touches related to leaning arms.
Tactile Elements with Audio Feedback
We recommended adding tactile cues on “Points of Interest”, as in [36]. Those cues can be both perceived tactilely and visually. Because it is possible to change the audio content dynamically, such cues should be repositionable.
Audio-zones for PVI and non-PVI
Sighted users do not explore interactive drawings in the same way as PVI. Sighted people directly point inside a zone, similar to using a button. PVI explore the contour of a zone to understand its shape. Consequently, the interactive zones with audio feedback should be larger than the contour
to detect touches from PVI.
Limited Amount of Information
The number of information that can be presented on a tactile drawing is limited by its physical dimensions [28]. Adding a “saving/ loading” feature can overcome this problem, by making it possible to define several layouts for the same map.
Creating Content and Visual Feedback Offset
Our system is adapted to the resolution of the fingertips [18], since zones are drawn with the spatial resolution of the finger. The system was resilient to calibration offset, as the interactive zones are created with the same offset than finger detection. If the finger was detected 5 mm away when drawing, it was detected with the same offset when exploring (Figure 6). However, the visual feedback in this case was a problem for sighted people since they tried to correct the perceived offset by moving the finger.
Selection of Modes
In the first version of the prototype, the users had to use a keyboard to change between modes (creation of lines, of shapes, exploration, etc. as mentioned above). As proposed by some participants, we designed tangible cards with a three-color pattern to change modes more easily.
General Insights
First, a clear interaction is required, as no standard exists. In this context, we developed a clear interactive space, feedback about the detection of input tracked by the system, feedback when an action is launched by the system, feedback about the current mode of the system. This can be visual and audio at least, as the large size of the possible workspace may not be efficiently accessible by vision only. Second, the re-usability of the content should be ensured: save and load a content prepared in advance, position the loaded content regarding the physical content even if the calibration changed, allow adding new content to the existing content, alternate between content creation and content use for testing and enhancing the augmentation incrementally. The third insight is to ensure content modification: changing / erasing / adding interactive zones, changing / erasing / adding audio feedback and augmenting with any tactile medium. We represented independently the interactive zone and the associated feedback, to ensure this flexibility.
To ensure the users are confident before using the system in real situations, we recommend a plug and play setup with a unique application that includes a wizard for the calibration.
EVALUATION
Research objectives and Hypotheses
We aimed at verifying that the prototype provided potential users with the ability to create audio-tactile diagrams ( Figure 7). We compared the prototype (referred to as SAR in the following) with a more conventional drawing software (Inkscape, referred to as GUI in the following). Inkscape has been found usable by teachers in [34] and is a
Figure 6. A student explores the Torball tactile graphics. Interactive audio content zones are colored by projection.
well-known software for SVG drawings. The reader can refer to the metrics for the SAR prototype only. We propose the GUI comparison as a reasonable baseline. We defined three hypotheses.
H1: The participants can rapidly create interactive audio-tactile content using SAR.
H2: Creation is possible without requiring any specific technology related skills.
H3: Content creation is easier with SAR than with the GUI baseline.
Material: Hardware, Software, and Interaction
We used the SAR system described previously. Regarding the GUI system, we use Inkscape and a DELL laptop computer. Inkscape is a vector drawing software. All feedback is the native Inkscape feedback. The inputs are mouse and keyboard. The users can (1a) create a line: with a Bezier curve tool, (1b) create a shape: with pre-defined tools (e.g. ellipse or rectangle), (2) write text to be rendered later by vocal synthesis (open the XML editor and write the annotation with the keyboard in the description field), (3) validate the description: clicking on “Define” button. It is also possible to correct the content if needed, (4) explore the content is not within Inkscape,(5) reset the drawing: if the result from 1a or 1b is not good, the user can click on it before using the “Delete” key, (6) add audio: if the text was not complete, step 2 and 3 can be immediately repeated, or the user can click on the drawing to select it and modify the text later, (7) eraser: the user can select the line or shape drawing with the mouse, delete the text and click on “Define” or can delete directly the drawing using the “Delete” key. Exploration of the created audio-tactile content is not possible on Inkscape. For this, the user has to load the SVG file on the SAR device and to (4) explore in the same way as described above.
Precisions on the experimental design
Choosing the baseline: beyond the use of this software in the related work, we chose Inkscape1 since the
professionals using vector drawing in our panel (mainly the transcriptors) used Inkscape. We argue that Inkcape is a baseline that gives a good reference of usability. While users may not know Inkscape, none of them knew about SAR or the interaction with the SAR prototype. To guarantee that all the participants can create the content, a familiarization phase was done. The participants learned to create all the shapes and annotations necessary to complete the interactive maps. To verify Inkscape was usable after a familiarization phase, we did pretests with people novice to
vector drawings.
1 Inkscape is described as a best or highly recommended
free alternative to Illustrator:
techradar.com/news/the-best-free-adobe-illustrator-alternatives (26th June 2019)
Participants
Twenty-eight users (10M, 17F, 1 other) participated in the experiment, including seven students in computer and cognitive sciences, sixteen workers in a special education school for PVI, and five people working in a braille transcription center. Thirteen participants had a professional occupation related to VI: five interns in accessibility for VI three O&M instructors, three occupational therapists, two orthoptists, three special education teachers, a social worker, a specialist in assistive technologies, a librarian, a psychologist, five tactile document makers, one director of a braille transcription center. The average age was 37 years (min=21, max=59, SD=11.6). Except for the students, the average working time in relation with VI was 10 years (min=1, max=36, SD=10.2).
We selected participants with different levels of expertise in interactive technologies which we evaluated based on questions related to their knowledge on: Operating Systems, Programming, Fabrication techniques (FabLab), Vector Drawing, AR or VR applications, and Creation of Interactive tactile media. We chose these skills since they may be required for creating interactive tactile prototypes. All participants were familiar with Windows, 22 with Apple OS, and 6 with Linux. Twelve participants knew how to program; seven of them had used 3D printing and/or laser cutting several times. 13 had heard about creating electronic circuits. Ten participants had used vector drawing software several times or were (quasi-)autonomous with it, and 10 already created interactive tactile content (seven using PenFriend audio labeler of the Royal National Institute of Blind People2). One participant had created AR
content, and two VR content before. We decided to include people with diverse backgrounds (experienced inkscape
2
https://shop.rnib.org.uk/accessible-technology/note- taking-and-embossers/voice-recorders/new-rnib-penfriend2-voice-recorder-labeller.html
Figure 7. Teachers creating audio-tactile content, using SAR (top) and GUI (bottom).
users versus novices). None of the participants had experience with SAR to create content.
Material: Maps
We designed two maps based on two real cities (MP based on Toulouse, and MC based on Bordeaux, France, see Figure 8). They were modified not to be recognizable, to avoid bias through prior spatial knowledge of the participants. We controlled that both maps included the same number of items (20) with similar orientation and position for most of the elements in a nine-cell grid of three rows and three columns. Each map contained curved lines, vertical, horizontal and inclined lines, bold circular shapes, a truncated ellipse, an L-shape, a rectangle, a star, a circle, and a triangle. The condition order was counterbalanced (see Table 1). To avoid spatial bias (some elements could be easier to draw on the right or on the left side due to participants’ laterality), the maps were rotated by 0°, 90°, 180° and 270° every four participants.
Experimental protocol
The two conditions (SAR and GUI) were tested after a 10 min familiarization phase. During the test, the participants had to add interactive zones to an A3 tactile map (two maps in total, one per system GUI and SAR). The audio content to be added was provided on a printed sheet to the participants and was standardized for length of words. We chose to limit the creation to 10 minutes to avoid a ceiling effect. In a pilot study we had tested that this is not enough to create an entire map, but sufficient to create parts of the map. For comparison purpose, experts from the research team needed between 4 and 7 min to annotate the entire map.
More precisely, we conducted the following protocol:
Step 0: introduction, consent form (5 min)
Step A.1: familiarization with the content creation features (circle, rectangle and star shapes, straight and curved lines, adding textual descriptions for the TTS in the properties of the XML file for GUI and sound registration with a microphone for SAR, erasing shapes); presentation of a manual with a reminder of the instructions and of the controls of the system. (10 min)
Step A.2: Creation of interactive content, with the possibility to consult the manual provided during the familiarization phase. Participants had to stop after 10 min even if the task was not completed. We collected the number of items and order of completion, the number of deleted elements and modifications. (10 min)
Step A.3: Satisfaction evaluation (2min) and Attrakdiff questionnaire [21] for the first system (5 min).
The next steps were identical for the second system. Step B.1: familiarization; Step B.2: content creation; Step B.3: evaluation.
Step 4: Questionnaire regarding personal characteristics. There was one major difference regarding the use of SAR and GUI: with SAR participants were able to create content and test it at the same time since the same hardware was used for map creation and exploration. With GUI, this was not possible. We decided to allow this, since it corresponds to the way the systems would be used in real life. However, we are aware that this might slow down the use of SAR.
RESULTS
For each participant, we measured the average time for creating elements. We used a logarithmic transformation to compensate the asymmetry of time variables, and the Shapiro-Wilk test to verify the normality of the samples. We compared the difference between the conditions (per participant) with the paired t-test for the mean.
H1: Average creation time
The sample of the creation time between SAR and GUI (for each participant) for shapes (W=0.94, p<0.01) and for lines (W=0.98, p<0.01) were normally distributed. As noted in Table 2, participants needed on average 32.6 seconds for creating an element with SAR (SD=7.1), and 56.9 seconds for GUI (SD=36.0). SAR was significantly faster for all
Figure 8. Familiarization Map (left), map MP representing the imaginary city of Citya (center), and Polisea (right). All are A3.
Participants 1st system 1st map
P1, P5*, P9, P13, P17*, P21, P25 P2, P6*, P10*, P14, P18, P22, P26 P3, P7*, P11*, P15, P19, P23, P27 P4, P8*, P12*, P16*, P20, P24*, P28 GUI SAR GUI SAR MC MP MP MC
Table 1. Participants and order of conditions. * indicates at least one FabLab and one creation experience regarding AR, VR or audio-tactile content (seven participants out of ten are in this category including experience with Pen Friend). The underlined participants have prior experience with Inkscape
kinds of elements (one-tail paired t-test t-statistics t= 4.74 with 27 degrees of freedom, α< 0.001). In details, SAR was significantly faster for shapes (t=6.18 with 27 degrees of freedom, α< 0.001) and lines (t-statistics t=2.73 with 26 degrees of freedom, α< 0.01). Thus, we can conclude that SAR is quicker to use than the GUI baseline.
H2: Average completion number
On average, with GUI 59.65% of the 20 elements of the map were made interactive (SD=25.01%) and with SAR 76.25% (SD=20.12%). The average difference for completion per participant between SAR and GUI was 16.60% (SD=24.42%). SAR allows to complete significantly more elements of the maps than GUI (t=5.29 with 27 degrees of freedom, α < 0.001). In detail, twelve participants (n=28) completed 90% or more of the map (five 100%) with SAR. Four participants completed 90% or more of the map (one 100%) with GUI. The minimum completion was 35% with SAR and 15% with GUI, within 10 minutes. These results included the performance of eighteen participants without technical skills (25 if we do not consider the content creation with PenFriend as technical knowledge). No participants had prior experience with SAR content creation, while nine participants knew how to use the GUI system beforehand. We can therefore conclude that a higher number of elements can be made interactive even by novice users with SAR.
H3: Satisfaction and User Experience
Quantitative analysis:
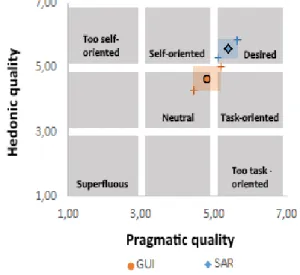
Results from the Attrakdiff questionnaire [21] show that the SAR is “desired” and GUI “neutral’ (Figure 9). This difference is significant. We used a Pearson confidence interval (α=0.05, n=28, paired sample). We also found that the majority of participants rated SAR system better than GUI for the four scales of Attrakdiff (Figure 10). Twenty participants gave a better score for the pragmatic quality PQ scale (71%), i.e. rated the SAR system more appropriate to reach their goals. Twenty-four participants gave a better score for the hedonic-stimulation HS-S quality scale (86%), i.e. rated SAR system more oriented to the stimulation needs (originality, creativity, innovation). Twenty-two participants gave a better score for hedonic-identification HQ-I quality scale (79%), i.e. rated SAR system more professional, presentable or integrative (originality, creativity, innovation). Twenty-three participants gave a better score for global attractiveness ATT quality scale
(81%), i.e. rated SAR system better, more attractive, and pleasant.
Qualitative analysis
Several participants preferred the SAR system. P9 mentioned the “simplicity of use”. P14 said “I prefer PapArt, because (as always) mastering a computer is time demanding to me”. P18 said that SAR is “simple to master”, even if he would choose a GUI for a higher precision. SAR is “lacking precision” P9, P13, P21), and the GUI provides a more “precise drawing” (P19). However, P11 and P19 found SAR easier for curves. Participants did not mention strategies when using SAR, but mentioned it using GUI (e.g. P19, P21, P15). P10 said “I admit, I did the easiest” and P17 made a similar statement. P15 stated “The shape #1 (the river), I don’t
Figure 10. Top-left to bottom right: For the PQ, the HQ-S, the HQ-I, and the ATT the majority of the participants rated SAR better than the GUI baseline.
Figure 9. The results of Comparing GUI and SAR Attrakdiff portfolio. The confidence interval is shown as blue and orange zones around the system markers, n=28.
Zones GUI SAR
All 56.96 sec (SD=36.01) 32.61 sec (SD=7.08) Shapes 73.18 sec (SD=47.18) 34.11 sec (SD=10.93)
Lines 85.79 sec (SD=226.79) 29.68 sec (SD=7.20)
Table 2. Average times for creating interactive zones with GUI and SAR for all (shapes and lines), only shapes and only lines.
know how to do it”. P19 said “I will go the fastest”. P21 mentioned “I do not see at all [how to do it]”. Participants tried to draw the easiest elements first on the GUI (straight lines and existing shapes), but not with SAR. This confirms that SAR is “intuitive” (citation of P12) and more embodied than GUI. Moreover, P19 mentioned a “better hand-eye coordination”, that “touch interaction is more alive, vibrant”, and that “the notion of pleasure is important with PapARt”. P8 stated that SAR is “easier […]. The children and adults we work with can make the tools on their own”. However, P22 claimed that some prior experience would avoid some misuse. The participants explicitly mentioned SAR as more “playful” (P8, P10, P12, P13, P15, P16, P17, P19, P20, P21, P23, P27). P21 also said that “as it is colorful, it is better, nicer”. P13 found SAR “attractive”. P8 said “It is truly nice the [SAR] system, it’s intuitive”. The GUI drawing necessitates position, rotation and scale adjustments. SAR allows to draw directly with the good scale, position and rotation, but does not allow adjustments on existing lines and shapes, P15: “Could we imagine a pen for small shapes? It would be more precise”. On the other hand, since in the case of GUI the hardware is not the same for content creation and exploration, GUI may lead to the creation of unusable zones, e.g. too small to touch with a finger. Regarding audio, some participants indicated they do not like to hear their own voice, and that TTS provides more “stable audio feedback” (P22), especially for “teenagers and adults” (P21). Yet, records are “more human” (e.g. P21, P22) to “use with children”.
Some participants found the SAR system technical. P20 stated: “I could finish it with more practice” and P14, P21 and P27 “need of a bit of training for more expertise”. SAR requires professionals with system knowledge to train other users. Moreover, it requires “a dedicated room” for registering sound (P8, P11). It also forces users to deal with bugs and the environment, e.g. “light conditions” (P11, P16). P17, an advisor in assistive technologies, said “some people are reluctant about plugging two wires. [With GUI] I think we are rapidly autonomous with a small training. Me, I would be less afraid by this system. [SAR] is more playful if everything is already installed. But […]: as soon as there is a concern it is complicated. It is what I observe in my practice”. P18, P17 indicated the need of training users “Or it will end like our 3D printer: if there is a bug to solve before to use it, I will not do it myself”. On the other hand, the GUI also works in a “noisy environment” (P11, P12). The GUI could be preferred by participants due to easier portability and familiarity (P17). Indeed, maps can be “parameterized anywhere without needing the [SAR] tool” (P12). Collaborative use is seen as possible with SAR, but not with GUI (P13, P21, P18, P20). Finally, SAR provides visual feedback, used to trigger already added audio content, and the possibility to directly test the added content (P8, P20).
DISCUSSION
Our study shows that both GUI and SAR are interesting for content creation. SAR presented advantages regarding the time, number of created elements and user experience. GUI has the advantage of being portable (since it does not require the AR system) and a familiar working environment but may require several hours of learning for non-experts. SAR requires a dedicated room and quite environment for use in specialized schools to record speech. SAR produces direct results independently of technical skills, compensates for detection errors, and is playful and embodied. It uses an unfamiliar system but is intuitive and easy to learn. However, SAR installation and bug resolution are unfamiliar and thus a challenge for teachers who are not technical experts. Finally, audio also presents downsides for learning orthography, and is only adapted for hearing users.
CONCLUSION AND PERSPECTIVES
In this paper we presented the implementation of a system based on Spatial Augmented Reality (using the PapARt toolkit) which allows teachers and families of PVI to create interactive media. This tool was designed in a participatory design approach. We observed its use it in an international workshop with visually impaired and sighted students and their teachers. Moreover, we compared this system to a GUI baseline in a controlled user study. The SAR condition presented several advantages over the GUI baseline condition, including time, number of created elements and user experience.
While in this paper the content creation system is used by sighted teachers for PVI, in our future work we would like to enable PVI to create content for themselves. Therefore, we started using a set of tangible cards to change modes (exploration, content creation). The cards can be made accessible, e.g. with tactile stickers, and thus open equal co-building perspectives. Another challenge to make the system truly accessible concerns the question of providing feedback about touch detection without vision. Another perspective is the usability of the set up and of the calibration. This includes the device (portability) and the process (installation).
We hope that this work will lay the groundwork to enable teachers of specialized schools to create audio-tactile content for accessible interactive media, and thus increase the adoption of such novel technologies in the classroom.
ACKNOWLEDGMENTS
This work was founded by the Erasmus+ Program of the European Union Pr. no 2016-1-EL01-KA201-023731, and AccessiMap ANR-14-CE17-0018. We thank the lab “Cherchons pour Voir”, special education centers IJA and IRSA, the transcription center CTEB, and professionals and people with visual impairment participating in the studies.
REFERENCES
[1] Jérémy Albouys-Perrois, Jérémy Laviole, Carine Briant,
and Anke Brock. 2018. Towards a Multisensory Augmented Reality Map for Blind and Low Vision People: a Participatory Design Approach. In CHI’18 - CHI
Conference on Human Factors in Computing Systems.
[2] R. Azuma, Y. Baillot, R. Behringer, S. Feiner, S. Julier, and B. MacIntyre. 2001. Recent advances in augmented reality. IEEE Computer Graphics and Applications 21, 6: 34–47. https://doi.org/10.1109/38.963459
[3] Oliver Bimber and Ramesh Raskar. 2005. Spatial
Augmented Reality: Merging Real and Virtual Worlds. A. K.
Peters, Ltd. Retrieved November 27, 2014 from http://dl.acm.org/citation.cfm?id=1088894
[4] Anke M. Brock, Philippe Truillet, Bernard Oriola, Delphine Picard, and Christophe Jouffrais. 2015. Interactivity Improves Usability of Geographic Maps for Visually Impaired People. Human-Computer Interaction 30: 156– 194.
[5] Tania Calle-Jimenez and Sergio Luján-Mora. 2016. Accessible Online Indoor Maps for Blind and Visually
Impaired Users. 309–310.
https://doi.org/10.1145/2982142.2982201
[6] Claudia Daudén Roquet, Jeeeun Kim, and Tom Yeh. 2016. 3D Folded PrintGami. In Proceedings of the 2016 ACM
Conference on Designing Interactive Systems - DIS ’16,
187–191. https://doi.org/10.1145/2901790.2901891 [7] Julie Ducasse, Anke Brock, and Christophe Jouffrais. 2017.
Accessible Interactive Maps for Visually Impaired Users.
Mobility in Visually Impaired People - Fundamentals and ICT Assistive Technologies.
[8] Julie Ducasse, Marc J-M Macé, Marcos Serrano, and Christophe Jouffrais. 2016. Tangible Reels: Construction and Exploration of Tangible Maps by Visually Impaired Users. In Proceedings of the 2016 CHI Conference on
Human Factors in Computing Systems, 2186–2197.
https://doi.org/10.1145/2858036.2858058
[9] Alistair D N Edwards, Nazatul Naquiah, Abd Hamid, and Helen Petrie. 2015. Exploring Map Orientation with Interactive Audio-Tactile Maps. In Human-Computer
Interaction–INTERACT 2015, 72–79. https://doi.org/10.1007/978-3-319-22701-6
[10] Giovanni Fusco, San Francisco, and Valerie S Morash. The Tactile Graphics Helper : Providing Audio Clarification for Tactile Graphics Using Machine Vision Categories and Subject Descriptors. 97–106.
[11] Stéphanie Giraud, Anke M. Brock, Marc J.-M. Macé, and Christophe Jouffrais. 2017. Map Learning with a 3D Printed Interactive Small-Scale Model: Improvement of Space and Text Memorization in Visually Impaired
Students. Frontiers in Psychology 8, 930.
https://doi.org/10.3389/fpsyg.2017.00930
[12] Stéphanie Giraud and Christophe Jouffrais. 2016. Empowering Low-Vision Rehabilitation Professionals with “Do-It-Yourself” Methods. . Springer, Cham, 61–68. https://doi.org/10.1007/978-3-319-41267-2_9
[13] Cagatay Goncu and Kim Marriott. 2015. Creating eBooks
with Accessible Graphics Content. 89–92.
https://doi.org/10.1145/2682571.2797076
[14] Timo Götzelmann. 2016. LucentMaps: 3D Printed Audiovisual Tactile Maps for Blind and Visually Impaired People. In Proceedings of the 18th International ACM
SIGACCESS Conference on Computers and Accessibility -
ASSETS ’16, 81–90.
https://doi.org/10.1145/2982142.2982163
[15] Timo Götzelmann and Klaus Winkler. 2015.
SmartTactMaps: a smartphone-based approach to support blind persons in exploring tactile maps. In
Proceedings of the 8th ACM International Conference on PErvasive Technologies Related to Assistive Environments -
PETRA ’15, 1–8.
https://doi.org/10.1145/2769493.2769497
[16] Taejin Ha, Woontack Woo, Youngho Lee, Junhun Lee, Jeha Ryu, Hankyun Choi, and Kwanheng Lee. 2010. ARtalet: Tangible user interface based immersive augmented reality authoring tool for digilog book. Proceedings - 2010
International Symposium on Ubiquitous Virtual Reality,
ISUVR 2010: 40–43.
https://doi.org/10.1109/ISUVR.2010.20
[17] Nazatul Naquiah Abd Hamid and Alistair D.N. Edwards. 2013. Facilitating route learning using interactive audio-tactile maps for blind and visually impaired people. In CHI
EA ’13 Extended Abstracts on Human Factors in Computing
Systems, 37–42.
https://doi.org/10.1145/2468356.2468364
[18] R.D. Jacobson. 1998. Navigating maps with little or no sight: An audio-tactile approach. In Proceedings of Content
Visualization and Intermedia Representations, 95–102.
[19] Gunnar Jansson, Imre Juhasz, and Arina Cammilton. 2006. Reading virtual maps with a haptic mouse: Effects of some modifications of the tactile and audio-tactile information.
British Journal of Visual Impairment 24, 2: 60–66.
https://doi.org/10.1177/0264619606064206
[20] Yeongmi Kim, Jongeun Cha, Jeha Ryu, and Ian Oakley. 2011. A tactile glove design and authoring system for immersive multimedia. IEEE Multimedia 17, 3: 34–45. https://doi.org/10.1109/mmul.2010.5692181
[21] C. Lallemand, V. Koenig, G. Gronier, and R. Martin. 2015. Création et validation d’une version française du questionnaire AttrakDiff pour l’évaluation de l’expérience utilisateur des systèmes interactifs. Revue Europeenne de
Psychologie Appliquee 65, 5: 239–252. https://doi.org/10.1016/j.erap.2015.08.002
[22] Jeremy Laviole and Martin Hachet. 2012. PapARt: Interactive 3D graphics and multi-touch augmented paper for artistic creation. IEEE Symposium on 3D User Interfaces
2012, 3DUI 2012 - Proceedings: 3–6. https://doi.org/10.1109/3DUI.2012.6184167
[23] Joshua A Miele, Steven Landau, and Deborah Gilden. 2006. Talking TMAP: Automated generation of audio-tactile maps using Smith-Kettlewell’s TMAP software. British
https://doi.org/10.1177/0264619606064436
[24] Hiroki Minagawa, Noboru Ohnishi, and Noboru Sugie. 1996. Tactile-audio diagram for blind persons. IEEE
Transactions on Rehabilitation Engineering 4, 4: 431–437.
[25] Valerie S Morash, Allison E Connell Pensky, Steven T W Tseng, and Joshua A Miele. 2014. Effects of using multiple hands and fingers on haptic performance in individuals who are blind. Perception 43, 6: 569–588.
[26] National Federation of the Blind. 2009. The Braille
Literacy Crisis in America: Facing the Truth, Reversing the Trend, Empowering the Blind.
[27] Azadeh Nazemi, Iain Murray, and Nazanin Mohammadi. 2012. Mathspeak: An audio method for presenting mathematical formulae to blind students. International
Conference on Human System Interaction, HSI: 48–52.
https://doi.org/10.1109/HSI.2012.17
[28] Peter Parente and Gary Bishop. 2003. BATS : The Blind Audio Tactile Mapping System. In Proceedings of ACM
South Eastern Conference.
[29] Benjamin Poppinga, Charlotte Magnusson, Martin Pielot, and Kirsten Rassmus-Gröhn. 2011. TouchOver map: Audio-Tactile Exploration of Interactive Maps. In
Proceedings of the 13th International Conference on Human Computer Interaction with Mobile Devices and
Services - MobileHCI ’11, 545.
https://doi.org/10.1145/2037373.2037458
[30] Jochen Schneider and Thomas Strothotte. 2000. Constructive exploration of spatial information by blind users. In Proceedings of the fourth international ACM
conference on Assistive technologies - Assets ’00, 188–192.
https://doi.org/10.1145/354324.354375
[31] Lei Shi, Holly Lawson, Zhuohao Zhang, and Shiri Azenkot. 2019. Designing Interactive 3D Printed Models with Teachers of the Visually Impaired. In Proceedings of the
2019 CHI Conference on Human Factors in Computing
Systems - CHI ’19, 1–14.
https://doi.org/10.1145/3290605.3300427
[32] Lei Shi, Yuhang Zhao, and Shiri Azenkot. 2017. Markit and Talkit: A Low-Barrier Toolkit to Augment 3D Printed Models with Audio Annotations. In Proceedings of the 30th
Annual ACM Symposium on User Interface Software and Technology - UIST ’17, 493–506. https://doi.org/10.1145/3126594.3126650
[33] A.F. Tatham. 1991. The design of tactile maps: theoretical and practical considerations. In Proceedings of
international cartographic association: mapping the nations, 157–166.
[34] Lauren Thevin and Anke M. Brock. 2018. Augmented Reality for People with Visual Impairments: Designing and Creating Audio-Tactile Content from Existing Objects.
193–200.
https://doi.org/10.1007/978-3-319-94274-2_26
[35] Jakub Wabiński and Albina Mościcka. 2019. Automatic (Tactile) Map Generation—A Systematic Literature Review. ISPRS International Journal of Geo-Information 8,
7: 293. https://doi.org/10.3390/ijgi8070293
[36] Zheshen Wang, Baoxin Li, Terri Hedgpeth, and Teresa Haven. 2009. Instant Tactile-Audio Map: Enabling Access to Digital Maps for People with Visual Impairment. In
Assets ’09 Proceedings of the 11th international ACM SIGACCESS conference on Computers and accessibility, 43–
50. https://doi.org/10.1145/1639642.1639652
[37] Limin Zeng and Gerhard Weber. 2012. ATMap: Annotated Tactile Maps for the Visually Impaired. In COST 2102
International Training School, Cognitive Behavioural Systems, LNCS Volume 7403, 2012 (Lecture Notes in
Computer Science), 290–298.