Artificial diets modulate infection rates by Nosema
1ceranae in bumblebees
2 3
Tamara Gómez-Moracho1, Tristan Durand1, Cristian Pasquaretta1, Philipp Heeb2,
4
Mathieu Lihoreau1,*
5 6
1 Research Center on Animal Cognition (CRCA), Center for Integrative Biology (CBI);
7
CNRS, University Paul Sabatier, Toulouse, France. 8
2 Laboratoire Evolution et Diversité Biologique, UMR 5174 Centre National de la
9
Recherche Scientifique, Université Paul Sabatier, ENSFEA, Toulouse, France. 10
11
*Author for correspondence: Mathieu Lihoreau (Mathieu.lihoreau@univ-tlse3.fr) 12
13 14
Abstract
15Parasites alter the physiology and behaviour of their hosts. In domestic honey bees, 16
the microsporidia Nosema ceranae induces an energetic stress and impairs the 17
behaviour of foragers, potentially leading to colony collapse. Whether this emerging 18
parasite similarly affects wild pollinators is little understood because of the low 19
success rates of experimental infection protocols. Here we established a new 20
apporach for infecting bumblebees (Bombus terrestris) with controlled amounts of N. 21
ceranae, by briefly exposing individual bumblebees to a sucrose solution containing
22
parasite spores, before feeding them with artificial diets. We validated our protocol by 23
testing the effect of two spore dosages and two diets varying in their protein to 24
carbohydrate ratio, on the prevalence of the parasite (proportion of infected bees), 25
the intensity of infection (spore count in the gut), and the survival of bumblebees. 26
Insects fed a low-protein high-carbohydrate diet showed highest parasite prevalence 27
(up to 70%) but lived longest, suggesting that immunity and survival of bumblebees 28
are maximised at different protein to carbohydrate ratios. Spore dosage had no effect 29
on parasite infection rate and host survival. The identification of experimental 30
conditions for successfully infecting bumblebees with N. ceranae in the lab will 31
facilitate investigations of the sub-lethal effects of this parasite on the behaviour and 32
cognition of wild pollinators. 33
34
Keywords: Bombus terrestris, Nosema ceranae, nutrition, experimental infection, 35
survival analyses, PCR. 36
37 38
1. Introduction
39Bees face a high diversity of parasites and pathogens that negatively affect their 40
metabolism (Li et al., 2018; Mayack and Naug, 2009), immune system (Antúnez et 41
al., 2009; Li et al., 2017), behaviour and cognition (Gómez-Moracho et al., 2017), 42
altogether compromising the fitness of individuals and colonies (Goulson et al. 2015; 43
Klein et al., 2017). 44
The microsporidia Nosema ceranae is one of the most prevalent parasites of 45
honey bees worldwide and is thought to be a major cause of colony declines (Martín-46
Hernández et al., 2018). N. ceranae invades the epithelial cells of the honey bee 47
midgut where it replicates (García-Palencia et al., 2010; Higes et al., 2007). At the 48
physiological level, this parasite disrupts the carbohydrate (Aliferis et al., 2012; 49
Mayack and Naug, 2009) and lipid (Li et al., 2018) metabolism of the host, which 50
ensures the availability of nutrients for its own replication. This causes an energetic 51
stress on infected honey bees that consume more sucrose solution than non-infected 52
conspecifics (Alaux et al., 2010; Martín-Hernández et al., 2011; but see Aufauvre et 53
al., 2012). N. ceranae also alters gene expression in the brain (Holt et al., 2013), 54
inhibits the apoptosis of epithelial cells (Martín-Hernández et al., 2017) and 55
deregulates immune responses (Martín-Hernandez et al., 2018). At the behavioural 56
level, infected honey bees start foraging earlier in life (Goblirsch et al., 2013; Higes et 57
al., 2009; Perry et al., 2015), exhibit more frequent but shorter foraging flights 58
(Dosselli et al., 2016; Dussaubat et al., 2013; Kralj and Fuchs, 2010), show reduced 59
homing abilities (Wolf et al., 2014) and lower olfactory learning performances 60
(Piiroinen and Goulson, 2016; Gage et al., 2018; but see Charbonneau et al., 2016). 61
Over the past ten years, N. ceranae has been identified in an increasing 62
number of wild bee species (bumblebees: (Graystock et al., 2013; Li et al., 2012; 63
Plischuk et al., 2009), stingless bees: (Porrini et al. 2017)) as well as in some wasps 64
(Porrini et al., 2017) and butterflies (Malysh et al., 2018). In the field, horizontal 65
transmission to wild pollinators may occur through contamination of flower pollen by 66
infected honey bees. This possibility is particularly concerning since many of these 67
wild pollinators are solitary or present simple social organisations (Michener, 2000), 68
and therefore lack complex social immunity behaviours that allow honey bees to 69
collectively limit infection risks and combat parasites (Cremer et al., 2007). 70
The effects of N. ceranae on wild pollinators have been best investigated in 71
bumblebees. Recent studies suggest that N. ceranae impairs the cognitive abilities of 72
bumblebees, potentially reducing the foraging performances of entire colonies 73
(Piiroinen et al., 2016; Piiroinen and Goulson, 2016). However, the diversity of 74
experimental infections protocols used in these studies, and their relatively low 75
success rates (i.e. from 0% in (Piiroinen et al., 2016) to 62% in (Graystock et al., 76
2013)), make it difficult to draw definitive conclusions and call for more robust 77
standardised approaches. By contrast, 100% of infections are routinely reached in 78
honey bee studies (Doublet et al., 2015; Roberts and Hughes, 2015). 79
The age of bumblebees, their level of starvation prior to exposure, and the 80
amount of parasite spores to which they are exposed to, are all potentially important 81
parameters that vary across current infection protocols. Highest infections levels 82
were obtained by starving bumblebees of uncontrolled age for 8h before feeding 83
them with 6500 spores (an empirically measured infection intensity in wild colonies) 84
in 40% sucrose solution individually administered with a pipette (Graystock et al., 85
2013). Bumblebees were then maintained in smalls groups of 10 individuals with ad 86
libitum access to 40% sucrose solution. Under these conditions, 62% of the
87
bumblebees showed spores in their gut, which considerably reduced their lifespan. 88
Exposure to higher spore dosages caused different results. Fürst et al., (2014) 89
starved 2-days old bumblebees for 1h before feeding them with 100K spores 90
administered in a 10 μL drop of sucrose and maintained them individually with 50% 91
sucrose and artificial pollen ad libitum. Here, 34% of the bumblebees developed an 92
infection but no effect was observed on survival (Fürst et al., 2014). Piiroinen and 93
Goulson (2016) and Piiroinen et al., (2016) administered bumblebees of uncontrolled 94
age 180K and 130K N. ceranae spores respectively with a pipette and maintained 95
them in small groups of 10 with ad libitum access to 50% sucrose and pollen. In 96
these experiments, where the bumblebees were provided high numbers of spores 97
but starved for only 2h, 3% (Piiroinen and Goulson, 2016) or none (Piiroinen et al., 98
2016) of the individuals developed an infection. 99
Another potentially important parameter, so far unexplored, is the nutritional 100
composition of diets provided to bumblebees after parasite exposure. Nutrition is as a 101
key mediator of host-parasite interactions (Ponton et al., 2011) and should therefore 102
be carefully controlled when developing standard infection procedures. Many insects 103
increase their consumption of dietary protein in order to develop stronger 104
immunological responses and combat parasites (Cotter et al., 2011; Lee et al., 2006; 105
Povey et al., 2014). Increasing evidence indicate that bees given a choice of foods 106
can carefully adjust their intake of nutrients to reach target levels maximizing fitness 107
traits (e.g. Vaudo et al., 2016; Kraus et al., 2019; Ruedenauer et al., 2020). Although 108
there is no direct demonstration that diet modifies the ability of bees to fight 109
infections, bumblebees fed a low-protein diet have a reduced immune response 110
(Brunner et al., 2014). Honey bees infected by Nosema apis (Rinderer and Elliott, 111
1977) and N. ceranae (Jack et al., 2016; Porrini et al., 2011; Tritschler et al., 2017) 112
survive longer when provided protein rich pollen. Since protein consumption is 113
needed for synthesising peptides in immune pathways (Lee et al., 2006; Mason et 114
al., 2014; Povey et al., 2014), these results suggest that bees can adjust their 115
nutrient intake for self-medication (Poissonnier et al., 2018). 116
Here we developed an experimental protocol to efficiently infect bumblebees with 117
N. ceranae by briefly exposing individuals to controlled amounts of parasite spores
118
and feeding them with artificial diets varying in their protein to carbohydrate ratios. 119
We calibrated our approach by testing two spore dosages and two diets. We 120
analysed parasite prevalence (proportion of infected bumblebees based on 121
polymerase chain reactions, PCR), parasite intensity (spore counts in the gut) and 122
host survival to identify best conditions for infecting bumblebees at sub-lethal doses. 123
124
2. Materials and Methods
125126
2.1. Bees 127
Experiments were conducted in December 2017. Bumblebee workers (Bombus 128
terrestris) of unknown age were obtained from two commercial colonies (Biobest,
129
Belgium). Prior to the experiments, 15 workers from each colony were sampled for 130
parasite screening (Graystock et al., 2013). The absence of N. ceranae and other 131
common parasites of bumblebees (N. bombi and Crithidia bombi) in these samples 132
was confirmed in a monoplex PCR with the primers 218MITOC (N. ceranae: Martín-133
Hernández et al., 2007), Nbombi-SSU-J (N. bombi: Klee et al., 2006) and CB-ITS1 134
(C. bombi: Schmid-Hempel and Tognazzo, 2010). 135
To validate our approach on bumblebees, Honey bees (Apis mellifera) were used 136
as positive controls for parasite infection. Honey bee workers of unknown age were 137
obtained from a Nosema-free (N. ceranae and N. apis) colony maintained at our 138
experimental apiary (University Paul Sabatier, Toulouse). The absence of parasite in 139
the colony was confirmed in a duplex PCR with the primers 218MITOC and 321APIS 140
on a sample of 15 workers (Martín-Hernández et al., 2007). 141
2.2. Parasites 143
N. ceranae spores were obtained from a naturally infected honey bee colony. The
144
abdomens of 15 honey bee foragers were crushed into dH2O, and the homogenate
145
was examined using light microscopy (x400). Samples showing spores were checked 146
in a duplex PCR (Martín-Hernández et al., 2007) to verify for the presence of N. 147
ceranae and the absence of N. apis (spores of both parasites have similar
148
morphologies; Fries et al., (2006)). Positive honey bee gut homogenates were used 149
to prepare the spore solutions for the experimental infections, following a standard 150
purification protocol (Fries et al., 2013). Spore solutions were prepared no more than 151
one week before the infections. Briefly, 1 mL of the honey bee gut homogenate was 152
centrifuged at 5000 rpm for 5 min. The supernatant containing tissue debris was 153
discarded and the pellet containing the spores was re-suspended in 0.5 mL of dH2O
154
by vortexing. The sample was centrifuged and washed into dH2O two times more to
155
obtain a spore solution of 85% purity (Fries et al., 2013). N. ceranae spores were 156
counted using an improved Neubauer haemocytometer (Cantwell, 1970) in a light 157
microscope (x400). Counts were made in five squares of 0.2 x 0.2 mm2 area in both 158
chambers of the haemocytometer and the total number of spores was averaged. The 159
final inoculum concentration was adjusted to either 7500 spores/μL or 15000 160
spores/μL in 20% (v/v) of sucrose solution. All the inocula were prepared the day of 161
the experimental infections. 162
163
2.3. Infections 164
Bumblebees and honey bees were exposed to solutions of N. ceranae spores on the 165
same day. Based on preliminary observations showing that different starvation 166
durations are needed to elicit feeding in bumblebees and honey bees, bumblebees 167
and honey bees were manipulated separately. At 9.00 am (GMT+1), 300 168
bumblebees were isolated in empty Petri Dishes (20 mm Ø) and starved for 5h. At 169
12.00 pm, 300 honey bees were isolated in the same conditions but for 2h only. At 170
2.00 pm, bumblebees were individually exposed to a drop of 20 μL of sucrose 171
solution (20% v/v) containing either 0 spore (control), 150K spores or 300K spores. 172
Honey bees were exposed to a drop of sucrose solution containing either 0 spore 173
(control) or 150K spores. The sucrose was delivered with a micropipette in the Petri 174
dish of each bee. Only the bees that consumed the entire drop within 2 two hours 175
were kept for the experiments (272 out of the 300 bumblebees, 258 out of 300 honey 176
bees, see details in supplementary Table 1). 177
178
2.4. Artificial diets 179
Immediately after parasite exposure, bees were allocated to one of two artificial diets, 180
which generated 10 experimental groups. The number of individuals in each group 181
varied between 44 and 50 for bumblebees, and 47 and 77 for honey bees 182
(supplementary Table 1). Diets were liquid solutions containing either a low protein to 183
carbohydrate ratio (P:C 1:150, hereafter “low-protein diet”) or a high protein to 184
carbohydrate ratio (P:C 1:5, hereafter “high-protein diet”). The two diets were 185
prepared with a fixed total amount of nutrients (P + C content of 170 g/L). 186
Carbohydrates were supplied as sucrose (Euromedex, France). Proteins consisted in 187
a mixture of casein and whey (4:1) (Nutrimuscle, Belgium). Both diets contained 188
0.5% of vitamin mixture for insects (Sigma, Germany). 189
190
2.5. Survival 191
Bumblebees and honey bees were individually kept in a Petri dish with a hole (1 cm 192
Ø) on the top lid, in which was placed a gravity feeder containing one of the two 193
diets. The feeder consisted in a 1.5 mL Eppendorf tube with a hole at its basis 194
through which the bees could insert their proboscis and ingest liquid food. All bees 195
were kept in two identical incubators (Pol-Eko, Poland) at 26ºC, with a photoperiod of 196
12h light: 12h dark, for 21 days. Each incubator contained the same proportion of 197
bees from the 10 experimental groups (supplementary Table 1). Every day, diets 198
were renewed and dead bees were stored at -20 ºC for molecular analyses. Bees 199
that survived the entire experiment were freeze-killed on day 21. 200
201
2.6. Prevalence and intensity of N. ceranae 202
Parasite prevalence (presence in the gut of bees) was assessed in bumblebees and 203
honey using PCR (see example Figure 1A). The gut of each bee was extracted and 204
homogenised in dH2O and vortexed with 2 mm glass beads (Labbox Labware,
205
Spain). Genomic DNA was extracted using Proteinase K (20 mg/mL; Euromedex, 206
France) and 1 mM of Tris-EDTA Buffer (pH = 8). PCR conditions were adapted from 207
Martín-Hernández et al., (2007) for a monoplex PCR with the 218MITOC primers 208
specific for N. ceranae. PCR reactions were carried out in 48-well microtitre plates in 209
a S1000™ Thermal Cycler (Biorad, CA). Each reaction contained 1.5 U of Taq 210
Polymerase (5 U/μL; MP Biomedicals, CA), 1x PCR Direct Loading Buffer (MP 211
Biomedicals, CA), 0.4 μM of each pair of primers (Martín-Hernández et al., 2007), 212
200 μM of dNTPs (Jena Biosciences, Germany), 0.48 μg/μL of BSA (Sigma, 213
Germany) and 2.5 μL of DNA sample in a final volume of 25 μL. Thermal conditions 214
consisted in an initial denaturing step of 94 °C for 2 min, followed by 35 cycles of 94 215
°C for 30 s, 61.8ºC for 45 s and 72 °C for 2 min, with a final elongation step of 72 °C 216
for 7 min. The length of PCR products (i.e. 218 pb) was checked in a 1.2% agarose 217
gel electrophoresis stained with SYBR Safe DNA Stain (Edvotek, Washington DC). 218
Parasite intensity (spore load in the gut) was estimated in positive PCR 219
bumblebee samples under a light microscope (x400). The number of spores was 220
counted as described above (see Section 1.2 and example Figure 2A). Random 221
samples of Nosema-negative PCR bumblebees were also screened to confirm the 222
absence of parasite spores. 223
224
2.7. Statistical analyses 225
Bumblebees were analysed for parasite prevalence, parasite intensity and survival. 226
Honey bees were used as positive control for parasite infection, and were therefore 227
only analysed for parasite prevalence. All analyses were performed in R v. 1.0.143 228
(R Development Core Team). All means are shown with standard errors (mean ± 229
S.E). 230
The effects of diet, spore dosage and their interaction on parasite prevalence 231
(proportion of individuals infected after parasite exposure) were tested using 232
Generalized Linear Models with a binomial error structure (binomial GLMs). The 233
effect of diet, spore dosage and their interaction on the proportion of bees showing N. 234
ceranae spores in their gut were tested using a binomial GLM. The effect of diet,
235
spore dosage and their interaction on parasite intensity (number of spores per bee) 236
were tested using a negative binomial GLM (because of the large over-dispersion of 237
the data). The parasite loads of individuals bees that survived until the end of the 238
experiment (day 21) and those that died before were compared using a negative 239
binomial GLM with a binary predictor (e.g. dead or alive at day 21) as fixed effect. 240
GLMs with binomial distribution errors were fitted using the glm function in the R 241
package "stats". GLMs with a negative binomial error distribution were fitted using 242
the glm.nb function in the R package “MASS” (Venables and Ripley, 2002). All the 243
models were tested for interactions among predictors (e.g. diet, dosage and PCR 244
results). Interactions that did not improve the fitting were removed from the models 245
using the Akaike information criterion (AIC) for model comparison (Akaike, 1985). 246
The survival of bumblebees was analysed using a Kaplan-Meier test curve 247
with the function survfit in the R package “Survival” (Therneau and Grambsch, 2000). 248
The effects of spore dosage, diet, infectious status and their interactions were 249
analysed using Cox proportional-hazards regression models (function coxph in the R 250
package “Survival”), followed by a Tukey post-hoc test to account for pairwise 251
comparisons. In all models, colony origin and incubator identity were included as 252 random factors. 253 254
3. Results
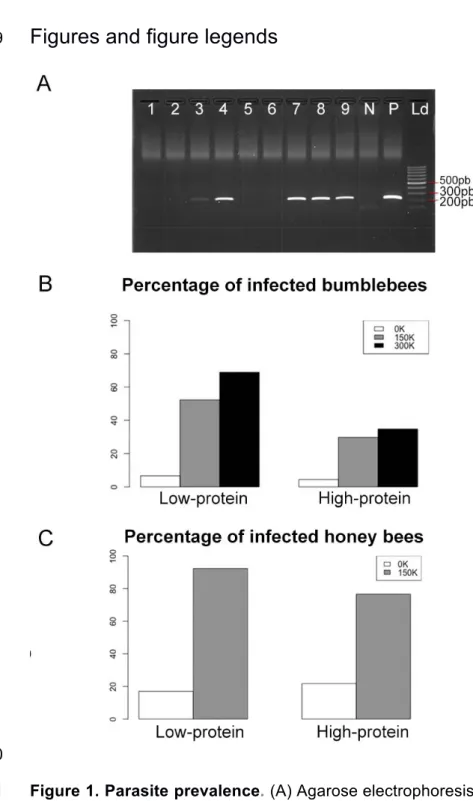
255 256 3.1. Parasite prevalence 257To assess infection rates, bumblebees and honey bees were analysed with PCR for 258
the presence of parasites after the 21 days of the experiment. In total, 46.15% of the 259
bumblebees (84 out of 182, Figure 1B and Table 1) and 83.8% of the honey bees 260
(119 out of 142, Figure 1C) exposed to N. ceranae were PCR positive, which 261
validates our protocol. Note however that a proportion of control (non-exposed) 262
individuals (5.5% of bumblebees, 19.8% honey bees) were found PCR positive 263
(Figures 1B and 1C). This suggests that our colonies were not entirely free of 264
parasites prior to the experiments or that horizontal cross-contamination occurred 265
during the experiments. All these infected control bees were excluded from further 266
analyses. 267
Diets significantly influenced the proportion of bees that became infected after 268
exposure to the parasite (Figures 1B and 1C; Table 1). A significantly larger number 269
of bumblebees became infected when fed the low-protein diet than when fed the 270
high-protein diet (GLMbinomial: Estimate = 1.186 (± 0.313), z = 3.79, p < 0.001),
271
irrespective of spore dosage (GLMbinomial: Estimate = 0.4870 (± 0.313), z = 1.503, p =
272
0.133). Likewise, a larger number of honey bees were infected when fed the low-273
protein than when fed the high protein-diet (GLMbinomial: Estimate = 1.298 (± 0.538), z
274
= 2.41, p = 0.016). Therefore, feeding a low-protein diet induced highest infection 275
rates in both species. Interestingly all the bumblebees that were fed the low-protein 276
diet and that survived until day 21 were PCR positive to N. ceranae (6 bumblebees 277
for 150K, 9 bumblebees for 300K). By contrast, the only bumblebee that was fed the 278
high-protein diet and that survived until day 21 (300K) was not infected. 279
3.2. Parasite loads 281
To assess the intensity of the infection, the gut homogenates of dead PCR positive 282
bumblebees were screened under microscope for the presence of N. ceranae 283
spores. 284
Spores were observed in bumblebee guts for both diets (Figures 2B-E; see 285
supplementary Table 1 for details). Comparing the presence of spores in 286
bumblebees that did not die on the same day yield some information about the 287
dynamics of spore production. For the low-protein diet, spores were seen from day 3 288
to day 20 post exposure with 150K spores (Figure 2B) and from day 4 to day 20 post 289
exposure with 300K spores (Figure 2C). Spores were never observed between day 8 290
and day 15. This may be due to the low mortality rate of bumblebees on these days. 291
For the high-protein diet, spores were seen from day 2 to 8 post exposure with 150K 292
spores (Figure 2D), and from day 3 to day 9 post exposure with 300K spores (Figure 293
2E). 294
Overall 30.9% (26 out of 84) of the infected bumblebees showed N. ceranae 295
spores in their gut (Table 1). This estimation of prevalence based on spore loads is 296
lower than that based on PCR screening (Figure 1B and Table 1) because, here, the 297
intracellular stages of the parasite (e.g. meronts, sporonts) cannot be detected. The 298
proportion of bumblebees with spores in their gut was similar irrespective of the diet 299
(GLMbinomial_diet: Estimate = 0.176 (± 0.489), z = 0.36, p = 0.718) and the spore
300
dosage (GLMbinomial_spore dosage: Estimate = 0.109 (± 0.477), z = 0.23, p = 0.819). Spore
301
loads were highly variable across individuals, with an average of 367.31 (± 72.03) 302
spores per bumblebee. Thespore dosage the bees were exposed to had no effect 303
on the spore loads found in their gut (GLMnegative-binomial: Estimate = -0.002 (± 0.002),
304
z = -0.73, p = 0.464). On the contrary, the diet had a significant effect on spore load 305
(GLMnegative-binomial: Estimate = 1.294 (± 0.347), z = 3.73, p < 0.001), leading to higher
306
amounts of spores in bumblebees fed the high-protein diet (662.50 ± 222.71 spores 307
per bee) than in bumblebees fed the low-protein diet (182.81 ± 40.99 spores per 308
bee). 309
Considering bumblebees that were fed the low-protein diet and that survived 310
until day 20 post exposure, only 4 out of 6 individuals exposed to 150K spores (175 ± 311
87.5 spores per bee; Figure 2B) and 4 out 9 individuals exposed to 300K spores (125 312
± 62.5 spores per bee; Figure 2C) showed spores in their gut. These bumblebees 313
showed similar spore loads than those fed the same diet but that died before day 20 314
post exposure (GLMnegative-binomial: Estimate = -0.363 (± 0.389), z = -0.93, p = 0.350).
316
3.3. Survival 317
To test the effect of spore dosage and diet on the physiology of bumblebees, survival 318
was analysed during the 20 days after parasite exposure. Here the infection status of 319
each bumblebee was based on the PCR results. 320
Overall, bumblebees fed the high-protein diet had lower survival than 321
bumblebees fed the low-protein diet (Figure 3; Cox: estimate = - 0.75 (± 0.14), z = - 322
5.17, p < 0.001). Bumblebees fed the high-protein diet (Figure 3A) showed similar 323
mortality rate irrespective of spore dosage (Table 2) and infectious status 324
(supplementary Table 2). By contrast, bumblebees fed the low-protein diet (Figure 325
3B) had a significantly reduced survival when exposed to spores than when non-326
exposed (Table 2). For this diet, 50% of exposed bumblebees died between days 6 327
and 7 post exposure. This lethal time 50 (LT50) was not reached for the non-exposed
328
(control) bumblebees. Interestingly, in the low-protein diet, infected bumblebees 329
tended to die faster than control bumblebees, but survived significantly longer than 330
bumblebees exposed and non-infected (Figure 3B; supplementary Table 2). 331
Therefore, both parasite exposure and infection had negative effects on the survival 332
of bumblebees maintained on the low-protein diet. 333
334
4. Discussion
335336
Several recent studies suggest that N. ceranae negatively affect bee behaviour and 337
cognition, which may have dramatic consequences for colony growth and survival 338
(Gage et al., 2018; Piiroinen and Goulson, 2016). In bumblebees, these results 339
remain difficult to interpret due to the low efficiency of experimental infection 340
protocols. Here we exploited recent insight into the nutritional ecology of bees (e.g. 341
Vaudo et al., 2016; Kraus et al., 2019; Ruedenauer et al., 2020) to develop a reliable 342
method to infect bumblebees with N. ceranae. We identified key effects of diet 343
composition on bumblebee infection rates and survival, indicating a complex 344
interaction between diet, parasite development and host health. 345
Overall 46% of the bumblebees exposed to N. ceranae spores were infected, 346
a percentage that increased up to 70% when only considering bumblebees that were 347
exposed to 300K spores and maintained on a low-protein high-carbohydrate diet. 348
These levels of prevalence are similar to those obtained by Graystock et al., (2013) 349
(62% infection rate) who used a 20 to 45 times lower infection dose (measured in 350
naturally infected colonies: 6500 spores/bee) administered with a micropipette 351
directly into the bee mouth parts. These rates of successful infections are higher than 352
all previous studies where bumblebees were exposed to an order of 105 spores/bee
353
either delivered as a drop of solution in a Petri Dish (39%; Fürst et al., 2014) or with a 354
micropipette directly into the bee mouth (0-3%; Piiroinen and Goulson, 2016; 355
Piiroinen et al., 2016). 356
We did not find any clear effect of parasite dosage (150K or 300K spores per 357
bee) on prevalence and survival. Comparing our results to that of previous studies 358
does not indicate such effect neither, which suggests that above a certain 359
concentration of parasite spores (e.g. 6500 spores/bee in Graystock et al. 2013), 360
parasite dosage is not an important factor determining the success of an infection. By 361
contrast, we found a strong effect of diet on parasite prevalence and spore loads. 362
Previous studies indicate that pollen intake affects honey bee physiology and 363
tolerance to N. ceranae (Basualdo et al., 2014; Di Pasquale et al., 2013). Using 364
artificial diets with controlled amounts of protein and carbohydrates, we demonstrate 365
that food macronutrient balance substantially influences both the infection rate and 366
the survival of bumblebees. A higher number of bumblebees were infected when fed 367
the low-protein high-carbohydrate diet, suggesting that different blends of nutrients 368
differently affect the germination of the parasite (but see Jack et al., 2016). The 369
digestion of the different macronutrients in the bumblebee gut, whose microbiota is 370
mostly composed by sugar-fermentative bacteria (Mohr and Tebbe, 2006), may lead 371
to changes in the gut environment that could favour the parasite germination, such as 372
shifts in pH (Wittner and Weiss, 1999). Furthermore, because N. ceranae exploits the 373
metabolism of carbohydrates to obtain energy from its host (Mayack and Naug, 374
2009) a higher carbohydrate consumption by infected bumblebees may benefit the 375
establishment of N. ceranae. Alike previous studies on honey bees that showed that 376
the supplement of pollen in diet increase the parasite intensity (Basualdo et al., 2014; 377
Fleming et al., 2015; Jack et al., 2016), we found that bumblebees with access to 378
higher amounts of protein show higher spore loads in their gut, suggesting that 379
proteins benefit the replication of the parasite. 380
The effect of diet was also evident on bumblebee survival. N. ceranae 381
reduced the survival of bumblebees, specifically in the low-protein high-carbohydrate 382
diet, where mortality rate increased by day 3 post exposure. This result is consistent 383
with the time described for N. ceranae to produce new spores in the honey bee gut 384
(Higes et al., 2007). Similarly to Graystock et al., (2013), we found that most of the 385
infected bumblebees (67.5%) died without showing spores in their gut, suggesting 386
that the parasite was not able to complete its cycle at a detectable level (i.e. produce 387
new spores). The lack of spores in the bumblebee guts could be due to a migration of 388
the parasite to the fat body of their host where it cannot reproduce (Graystock et al., 389
2013). Alternately, this could be a consequence of a high virulence of the parasite. 390
Emergent parasites can be very virulent for a novel host causing its death before 391
reproducing and releasing their offspring (Schmid-Hempel, 1998). Although it is not 392
clear when N. ceranae started to colonise bumblebee hosts (including B. terrestris), 393
the parasite was first identified in bumblebees in 2005 (Plischuk et al., 2009), 394
implying a short coevolution time in which the parasite may not have had time to fully 395
adapt its virulence to its diverse host species. Interestingly, the absence of parasite 396
spores in the gut of bumblebees that died at different times could reflect the ability of 397
bumblebees to clear the parasite. The fact that infected bumblebees fed the low-398
protein high-carbohydrate diet survived longer than exposed non-infected 399
bumblebees fed the same diet suggests that the mechanisms allowing parasite 400
clearance incur a higher metabolic cost, here manifested as a reduction of 401
bumblebee lifespan, than parasite tolerance. Nonetheless, given that only dead 402
bumblebees were checked for spores and that spore loads are generally higher in 403
live bees than in dead ones (Zheng et al., 2014), studying the dynamics of N. 404
ceranae spore production in live bumblebees (for instance by analysing faeces) will
405
be necessary to determine whether these insects are able to get rid of the parasite. 406
The fact that bumblebees showed low parasite prevalence but died faster 407
when fed a high-protein low-carbohydrate diet suggests that immunity and lifespan 408
are maximized at different nutritional balances. Several studies show how an 409
animals’ diet can differently influence the expression of key life-history traits, forcing 410
animals to trade-off between optimizing multiple traits simultaneously (e.g. Bunning 411
et al., 2016, 2015; Rapkin et al., 2018). In insects, lifespan is typically enhanced on 412
high-carbohydrate diets whereas reproduction is maximized on high-protein diets 413
(fruit flies: Lee et al., 2008; Fanson et al., 2009; Reddiex et al., 2013; Jensen et al., 414
2015; Semaniuk et al., 2018, crickets: Maklakov et al., 2008). Immunity and 415
reproduction also display differences in nutritional requirements (fruit flies: Ponton et 416
al., 2011, 2015; decorated crickets: Rapkin et al., 2018; leafworm: Cotter et al., 417
2011). Honey bees survive longer on high-carbohydrate diets (Altaye et al., 2010) 418
and pollen (the main source of protein) favours the survival of individuals infected 419
with N. ceranae (Basualdo et al., 2014; Fleming et al., 2015; Jack et al., 2016; Zheng 420
et al., 2014). Whether sterile bumblebee workers trade-off between over-ingesting 421
protein and under-ingestion of carbohydrates in order to reduce parasite 422
establishment at the expense of a shorter lifespan is an open question. In these 423
social insects, such individual strategy may considerably reduce the risks of 424
contamination of other workers within the colony (Poissonnier et al., 2018). 425
Developing standard protocols to characterize the sublethal effects of parasites 426
and pathogens on bees has become a major challenge for understanding bee 427
population declines (Gómez-Moracho et al., 2017). Here we demonstrated that diet is 428
key in determining infection rates of bumblebees exposed to N. ceranae. Highest 429
infection rates and longest survivals were obtained with a high-carbohydrate low-430
protein diet, thereby providing ideal conditions for investigating potential effects of N. 431
ceranae on bee behaviour and cognition. Other parameters, not tested here, may
432
also be of importance and investigated in future studies. For instance, both our study 433
and that of Graystock et al. (2013) starved bumblebees for at least 5 h prior to 434
parasite exposure, which may have increased the probability of parasite 435
establishment. Variations in the age of the bumblebee tested may also explain some 436
of these differences. In the only study that controlled for age, Fürst et al., (2014) 437
infected 2-days old bumblebees (post eclosion from the pupa) and obtained a lower 438
infection rate than that presented here and no effect on bumblebee mortality, 439
suggesting that young bumblebees are less susceptible to the parasite. Finally, we 440
cannot exclude differences in the virulence of the N. ceranae strains used for 441
experimental infection across studies (but see Van der Zee et al., 2014). We hope 442
that our infection protocol will facilitate further studies on the interactions between N. 443
ceranae and bumblebees in order to better assess the risks this emergent parasite
444
represents for wild pollinators. 445
446
Acknowledgements
447We thank Pascale Belenguer, Lucie Hotier, Audrey Dussutour and Enikö Csata for 448
their help and advice. 449
450
Funding
451TGM was funded by a postdoctoral fellowship from the Fyssen Foundation. PH was 452
funded by the ‘Laboratoire d’Excellence (LABEX)’ TULIP (ANR-10-LABX-41). TD, CP 453
and ML were funded by a grant from the Agence Nationale de la Recherche to ML 454 (ANR-16-CE02-0002-01). 455 456
References
457Akaike, H., 1985. Prediction and Entropy, in: A celebration of statistics. Springer New 458
York, New York, NY, pp. 1–24. doi:10.1007/978-1-4613-8560-8_1 459
Alaux, C., Brunet, J.-L., Dussaubat, C., Mondet, F., Tchamitchan, S., Cousin, M., 460
Brillard, J., Baldy, A., Belzunces, L.P., Le Conte, Y., 2010. Interactions between 461
Nosema microspores and a neonicotinoid weaken honeybees (Apis mellifera).
462
Environ. Microbiol. 12, 774–82. doi:10.1111/j.1462-2920.2009.02123.x 463
Aliferis, K., Copley, T., Jabaji, S., 2012. Gas chromatography-mass spectrometry 464
metabolite profiling of worker honey bee (Apis mellifera L.) hemolymph for the 465
study of Nosema ceranae infection. J. Insect Physiol. 58, 1349–59. 466
doi:10.1016/j.jinsphys.2012.07.010 467
Altaye, S.Z., Pirk, C.W.W., Crewe, R.M., Nicolson, S.W., 2010. Convergence of 468
carbohydrate-biased intake targets in caged worker honeybees fed different 469
protein sources. J. Exp. Biol. 213, 3311–3318. doi:10.1242/jeb.046953 470
Antúnez, K., Martín-Hernández, R., Prieto, L., Meana, A., Zunino, P., Higes, M., 471
2009. Immune suppression in the honey bee (Apis mellifera) following infection 472
by Nosema ceranae (Microsporidia). Environ. Microbiol. 11, 2284–2290. 473
doi:10.1111/j.1462-2920.2009.01953.x 474
Aufauvre, J., Biron, D.G., Vidau, C., Fontbonne, R., Roudel, M., Diogon, M., Viguès, 475
B., Belzunces, L.P., Delbac, F., Blot, N., 2012. Parasite-insecticide interactions: 476
a case study of Nosema ceranae and fipronil synergy on honeybee. Sci. Rep. 2, 477
326. doi:10.1038/srep00326 478
Basualdo, M., Barragán, S., Antúnez, K., 2014. Bee bread increases honeybee 479
haemolymph protein and promote better survival despite of causing higher 480
Nosema ceranae abundance in honeybees. Environ. Microbiol. Rep. 6, 396–
481
400. doi:10.1111/1758-2229.12169 482
Brunner, F.S., Schmid-Hempel, P., Barribeau, S.M., 2014. Protein-poor diet reduces 483
host-specific immune gene expression in Bombus terrestris. Proc. R. Soc. B 484
Biol. Sci. 281, 20140128–20140128. doi:10.1098/rspb.2014.0128 485
Bunning, H., Bassett, L., Clowser, C., Rapkin, J., Jensen, K., House, C.M., Archer, 486
C.R., Hunt, J., 2016. Dietary choice for a balanced nutrient intake increases the 487
mean and reduces the variance in the reproductive performance of male and 488
female cockroaches. Ecol. Evol. 6, 4711–4730. doi:10.1002/ece3.2243 489
Bunning, H., Rapkin, J., Belcher, L., Archer, C.R., Jensen, K., Hunt, J., 2015. Protein 490
and carbohydrate intake influence sperm number and fertility in male 491
cockroaches, but not sperm viability. Proc. R. Soc. B Biol. Sci. 282. 492
doi:10.1098/rspb.2014.2144 493
Cantwell G.E. 1970. Standard methods for counting Nosema spores, Am. Bee J. 494
110, 222–223. 495
Cotter, S.C., Simpson, S.J., Raubenheimer, D., Wilson, K., 2011. Macronutrient 496
balance mediates trade-offs between immune function and life history traits. 497
Funct. Ecol. 25, 186–198. doi:10.1111/j.1365-2435.2010.01766.x 498
Cremer, S., Armitage, S.A.O., Schmid-Hempel, P., 2007. Social Immunity. Curr. Biol. 499
17, R693–R702. doi:10.1016/j.cub.2007.06.008 500
Di Pasquale, G., Salignon, M., Le Conte, Y., Belzunces, L.P., Decourtye, A., 501
Kretzschmar, A., Suchail, S., Brunet, J.-L., Alaux, C., 2013. Influence of pollen 502
nutrition on honey bee health: do pollen quality and diversity matter? PLoS One 503
8, e72016. doi:10.1371/journal.pone.0072016 504
Dosselli, R., Grassl, J., Carson, A., Simmons, L.W., Baer, B., 2016. Flight behaviour 505
of honey bee (Apis mellifera) workers is altered by initial infections of the fungal 506
parasite Nosema apis. Sci. Rep. 6, 36649. doi:10.1038/srep36649 507
Doublet, V., Natsopoulou, M.E., Zschiesche, L., Paxton, R.J., 2015. Within-host 508
competition among the honey bees pathogens Nosema ceranae and Deformed 509
wing virus is asymmetric and to the disadvantage of the virus. J. Invertebr. 510
Pathol. 124, 31–34. doi:10.1016/j.jip.2014.10.007 511
Dussaubat, C., Maisonnasse, A., Crauser, D., Beslay, D., Costagliola, G., 512
Soubeyrand, S., Kretzchmar, A., Le Conte, Y., 2013. Flight behavior and 513
pheromone changes associated to Nosema ceranae infection of honey bee 514
workers (Apis mellifera) in field conditions. J. Invertebr. Pathol. 113, 42–51. 515
doi:10.1016/j.jip.2013.01.002 516
Fanson, B.G., Weldon, C.W., Pérez-Staples, D., Simpson, S.J., Taylor, P.W., 2009. 517
Nutrients, not caloric restriction, extend lifespan in Queensland fruit flies 518
(Bactrocera tryoni). Aging Cell 8, 514–523. doi:10.1111/j.1474-519
9726.2009.00497.x 520
Fleming, J.C., Schmehl, D.R., Ellis, J.D., 2015. Characterizing the impact of 521
commercial pollen substitute diets on the level of Nosema spp. in honey bees 522
(Apis mellifera L.). PLoS One 10. doi:10.1371/journal.pone.0132014 523
Fries, I., Chauzat, M.-P., Chen, Y.-P., Doublet, V., Genersch, E., Gisder, S., Higes, 524
M., McMahon, D.P., Martín-Hernández, R., Natsopoulou, M., Paxton, R.J., 525
Tanner, G., Webster, T.C., Williams, G.R., 2013. Standard methods for Nosema 526
research. J. Apic. Res. 52, 1–28. doi:10.3896/IBRA.1.52.1.14 527
Fries, I., Martín, R., Meana, A., García-Palencia, P., Higes, M., 2006. Natural 528
infections of Nosema ceranae in European honey bees. J. Apic. Res. 47, 230– 529
233. doi:10.3896/IBRA.1.45.4.13 530
Fürst, M.A., McMahon, D.P., Osborne, J.L., Paxton, R.J., Brown, M.J.F., 2014. 531
Disease associations between honeybees and bumblebees as a threat to wild 532
pollinators. Nature 506, 364–366. doi:10.1038/nature12977 533
Gage, S.L., Kramer, C., Calle, S., Carroll, M., Heien, M., DeGrandi-Hoffman, G., 534
2018. Nosema ceranae parasitism impacts olfactory learning and memory and 535
neurochemistry in honey bees (Apis mellifera). J. Exp. Biol. 221, jeb161489. 536
doi:10.1242/jeb.161489 537
García-Palencia, P., Martín-Hernández, R., González-Porto, A.-V., Marin, P., Meana, 538
A., Higes, M., 2010. Natural infection by Nosema ceranae causes similar lesions 539
as in experimentally infected caged-workers honey bees (Apis mellifera). J. 540
Apic. Res. 49, 278–283. doi:10.3896/IBRA.1.49.3.08 541
Goblirsch, M., Huang, Z.Y., Spivak, M., 2013. Physiological and behavioral changes 542
in honey bees (Apis mellifera) induced by Nosema ceranae infection. PLoS One 543
8, e58165. doi:10.1371/journal.pone.0058165 544
Gómez-Moracho, T., Heeb, P., Lihoreau, M., 2017. Effects of parasites and 545
pathogens on bee cognition. Ecol. Entomol. 42, 51–64. doi:10.1111/een.12434 546
Graystock, P., Yates, K., Darvill, B., Goulson, D., Hughes, W.O.H., 2013. Emerging 547
dangers: deadly effects of an emergent parasite in a new pollinator host. J. 548
Invertebr. Pathol. 114, 114–119. doi:10.1016/j.jip.2013.06.005 549
Higes, M., García-Palencia, P., Martín-Hernández, R., Meana, A., 2007. 550
Experimental infection of Apis mellifera honeybees with Nosema ceranae 551
(Microsporidia). J. Invertebr. Pathol. 94, 211–7. doi:10.1016/j.jip.2006.11.001 552
Higes, M., Martín-Hernández, R., Garrido-Bailón, E., González-Porto, A. V, García-553
Palencia, P., Meana, A., Del Nozal, M.J., Mayo, R., Bernal, J.L., 2009. 554
Honeybee colony collapse due to Nosema ceranae in professional apiaries. 555
Environ. Microbiol. Rep. 1, 110–113. doi:10.1111/j.1758-2229.2009.00014.x 556
Holt, H.L., Aronstein, K. a, Grozinger, C.M., 2013. Chronic parasitization by Nosema 557
microsporidia causes global expression changes in core nutritional, metabolic 558
and behavioral pathways in honey bee workers (Apis mellifera). BMC Genomics 559
14, 799. doi:10.1186/1471-2164-14-799 560
Jack, C.J., Uppala, S.S., Lucas, H.M., Sagili, R.R., 2016. Effects of pollen dilution on 561
infection of Nosema ceranae in honey bees. J. Insect Physiol. 87, 12–19. 562
doi:10.1016/j.jinsphys.2016.01.004 563
Jensen, K., McClure, C., Priest, N.K., Hunt, J., 2015. Sex-specific effects of protein 564
and carbohydrate intake on reproduction but not lifespan in Drosophila 565
melanogaster. Aging Cell 14, 605–615. doi:10.1111/acel.12333
566
Klee, J., Tek Tay, W., Paxton, R.J., 2006. Specific and sensitive detection of Nosema 567
bombi (Microsporidia: Nosematidae) in bumble bees (Bombus spp.;
568
Hymenoptera: Apidae) by PCR of partial rRNA gene sequences. J. Invertebr. 569
Pathol. 91, 98–104. doi:10.1016/j.jip.2005.10.012 570
Klein, S., Cabirol, A., Devaud, J.-M., Barron, A.B., Lihoreau, M., 2017. Why bees are 571
so vulnerable to environmental stressors. Trends Ecol. Evol. 572
doi:10.1016/j.tree.2016.12.009 573
Kralj, J., Fuchs, S., 2010. Nosema sp. influences flight behavior of infected honey 574
bee (Apis mellifera) foragers. Apidologie 41, 21–28. doi:10.1051/apido/2009046 575
Kraus, S., Gomez-Moracho, T., Pasquaretta, C., Latil, G., Dussutour, A., Lihoreau, 576
M., 2019. Bumblebees adjust protein and lipid collection rules to the presence of 577
brood. Curr Zool. 65, 437–446. doi:10.1093/cz/zoz026 578
Lee, K.P., Cory, J.S., Wilson, K., Raubenheimer, D., Simpson, S.J., 2006. Flexible 579
diet choice offsets protein costs of pathogen resistance in a caterpillar. Proc. R. 580
Soc. B. Biol. Sci. 273, 823–829. doi:10.1098/rspb.2005.3385 581
Lee, K.P., Simpson, S.J., Clissold, F.J., Brooks, R., Ballard, J.W.O., Taylor, P.W., 582
Soran, N., Raubenheimer, D., 2008. Lifespan and reproduction in Drosophila: 583
new insights from nutritional geometry. Proc. Natl. Acad. Sci. U.S.A. 105, 2498– 584
2503. doi:10.1073/pnas.0710787105 585
Li, J., Chen, W., Wu, J., Peng, W., An, J., Schmid-Hempel, P., Schmid-Hempel, R., 586
2012. Diversity of Nosema associated with bumblebees (Bombus spp.) from 587
China. Int. J. Parasitol. 42, 49–61. doi:10.1016/j.ijpara.2011.10.005 588
Li, W., Chen, Y., Cook, S.C., 2018. Chronic Nosema ceranae infection inflicts 589
comprehensive and persistent immunosuppression and accelerated lipid loss in 590
host Apis mellifera honey bees. Int. J. Parasitol. 48, 433–444. 591
doi:10.1016/j.ijpara.2017.11.004 592
Li, W., Evans, J.D., Li, J., Su, S., Hamilton, M., Chen, Y., 2017. Spore load and 593
immune response of honey bees naturally infected by Nosema ceranae. 594
Parasitol. Res. 116, 3265–3274. doi:10.1007/s00436-017-5630-8 595
Maklakov, A.A., Simpson, S.J., Zajitschek, F., Hall, M.D., Dessmann, J., Clissold, F., 596
Raubenheimer, D., Bonduriansky, R., Brooks, R.C., 2008. Sex-Specific Fitness 597
Effects of nutrient intake on reproduction and lifespan. Curr. Biol. 18, 1062– 598
1066. doi:10.1016/j.cub.2008.06.059 599
Malysh, J.M., Ignatieva, A.N., Artokhin, K.S., Frolov, A.N., Tokarev, Y.S., 2018. 600
Natural infection of the beet webworm Loxostege sticticalis L. (Lepidoptera: 601
Crambidae) with three Microsporidia and host switching in Nosema ceranae. 602
Parasitol. Res. doi:10.1007/s00436-018-5987-3 603
Martín-Hernández, R., Bartolomé, C., Chejanovsky, N., Le Conte, Y., Dalmon, A., 604
Dussaubat, C., García-Palencia, P., Meana, A., Pinto, M.A., Soroker, V., Higes, 605
M., 2018. Nosema ceranae in Apis mellifera : a 12 years postdetection 606
perspective. Environ. Microbiol. 20, 1302–1329. doi:10.1111/1462-2920.14103 607
Martín-Hernández, R., Botías, C., Barrios, L., Martínez-Salvador, A., Meana, A., 608
Mayack, C., Higes, M., 2011. Comparison of the energetic stress associated 609
with experimental Nosema ceranae and Nosema apis infection of honeybees 610
(Apis mellifera). Parasitol. Res. 109, 605–612. doi:10.1007/s00436-011-2292-9 611
Martín-Hernández, R., Higes, M., Sagastume, S., Juarranz, Á., Dias-Almeida, J., 612
Budge, G.E., Meana, A., Boonham, N., 2017. Microsporidia infection impacts 613
the host cell’s cycle and reduces host cell apoptosis. PLoS One 12, e0170183. 614
doi:10.1371/journal.pone.0170183 615
Martín-Hernández, R., Meana, A., Prieto, L., Salvador, A.M., Garrido-Bailón, E., 616
Higes, M., 2007. Outcome of colonization of Apis mellifera by Nosema ceranae. 617
Appl. Environ. Microbiol. 73, 6331–8. doi:10.1128/AEM.00270-07 618
Mason, A.P., Smilanich, A.M., Singer, M.S., 2014. Reduced consumption of protein-619
rich foods follows immune challenge in a polyphagous caterpillar. J. Exp. Biol. 620
217, 2250–2260. doi:10.1242/jeb.093716 621
Mayack, C., Naug, D., 2009. Energetic stress in the honeybee Apis mellifera from 622
Nosema ceranae infection. J. Invertebr. Pathol. 100, 185–8.
623
doi:10.1016/j.jip.2008.12.001 624
Michener, C.D., 2000. The bees of the world, The Johns Hopkins University Press. 625
Baltimore. 626
Mohr, K.I., Tebbe, C.C., 2006. Diversity and phylotype consistency of bacteria in the 627
guts of three bee species (Apoidea) at an oilseed rape field. Environ. Microbiol. 628
8, 258–272. doi:10.1111/j.1462-2920.2005.00893.x 629
Perry, C.J., Søvik, E., Myerscough, M.R., Barron, A.B., 2015. Rapid behavioral 630
maturation accelerates failure of stressed honey bee colonies. Proc. Natl. Acad. 631
Sci. U. S. A. 112, 3427–32. doi:10.1073/pnas.1422089112 632
Piiroinen, S., Botías, C., Nicholls, E., Goulson, D., 2016. No effect of low-level 633
chronic neonicotinoid exposure on bumblebee learning and fecundity. PeerJ 4, 634
e1808. doi:10.7717/peerj.1808 635
Piiroinen, S., Goulson, D., 2016. Chronic neonicotinoid pesticide exposure and 636
parasite stress differentially affects learning in honeybees and bumblebees. 637
Proc. R. Soc. B Biol. Sci. 283, 20160246. doi:10.1098/rspb.2016.0246 638
Plischuk, S., Martín-Hernández, R., Prieto, L., Lucía, M., Botías, C., Meana, A., 639
Abrahamovich, A.H., Lange, C., Higes, M., 2009. South American native 640
bumblebees (Hymenoptera: Apidae) infected by Nosema ceranae 641
(Microsporidia), an emerging pathogen of honeybees (Apis mellifera). Environ. 642
Microbiol. Rep. 1, 131–5. doi:10.1111/j.1758-2229.2009.00018.x 643
Poissonnier, L.-A., Lihoreau, M., Gomez-Moracho, T., Dussutour, A., Buhl, J., 2018. 644
A theoretical exploration of dietary collective medication in social insects. J. 645
Insect Physiol. 106, 78–87. doi:10.1016/j.jinsphys.2017.08.005 646
Ponton, F., Wilson, K., Cotter, S.C., Raubenheimer, D., Simpson, S.J., 2011. 647
Nutritional immunology: a multi-dimensional approach. PLoS Pathog. 7, 1–4. 648
doi:10.1371/journal.ppat.1002223 649
Ponton, F., Wilson, K., Holmes, A., Raubenheimer, D., Robinson, K.L., Simpson, 650
S.J., 2015. Macronutrients mediate the functional relationship between 651
Drosophila and Wolbachia. Proc. R. Soc. B Biol. Sci. 282, 20142029–20142029.
652
doi:10.1098/rspb.2014.2029 653
Porrini, M.P., Porrini, L.P., Garrido, P.M., de Melo e Silva Neto, C., Porrini, D.P., 654
Muller, F., Nuñez, L.A., Alvarez, L., Iriarte, P.F., Eguaras, M.J., 2017. Nosema 655
ceranae in south american native stingless bees and social wasp. Microb. Ecol.
656
2–5. doi:10.1007/s00248-017-0975-1 657
Porrini, M.P., Sarlo, E.G., Medici, S.K., Garrido, P.M., Porrini, D.P., Damiani, N., 658
Eguaras, M.J., 2011. Nosema ceranae development in Apis mellifera : influence 659
of diet and infective inoculum. J. Apic. Res. 50, 35–41. 660
doi:10.3896/IBRA.1.50.1.04 661
Povey, S., Cotter, S.C., Simpson, S.J., Wilson, K., 2014. Dynamics of macronutrient 662
self-medication and illness-induced anorexia in virally infected insects. J. Anim. 663
Ecol. 83, 245–255. doi:10.1111/1365-2656.12127 664
Rapkin, J., Jensen, K., Archer, C.R., House, C.M., Sakaluk, S.K., Castillo, E. Del, 665
Hunt, J., 2018. The geometry of nutrient space–based life-history trade-offs: 666
sex-specific effects of macronutrient intake on the trade-off between 667
encapsulation ability and reproductive effort in decorated crickets. Am. Nat. 191, 668
452–474. doi:10.1086/696147 669
Reddiex, A.J., Gosden, T.P., Bonduriansky, R., Chenoweth, S.F., 2013. Sex-Specific 670
Fitness consequences of nutrient intake and the evolvability of diet preferences. 671
Am. Nat. 182, 91–102. doi:10.1086/670649 672
Rinderer, T.E., Elliott, K.D., 1977. Worker honey bee response to infection with 673
Nosema apis: Influence of diet. J. Econ. Entomol. 70, 431–433.
674
doi:10.1093/jee/70.4.431ADDIN 675
Ruedenauer, F.A., Raubenheimer, D., Kessner-Beierlein, D., Grund-Mueller, N., 676
Noack, L., Spaethe, J., Leonhardt, S.D. 2020. Best be(e) on low fat: linking 677
nutrient perception, regulation and fitness. Ecol Lett. 23, 545–554. 678
doi:10.1111/ele.13454 679
Roberts, K.E., Hughes, W.O.H., 2015. Horizontal transmission of a parasite is 680
influenced by infected host phenotype and density. Parasitol. 142, 395–405. 681
doi:10.1017/S0031182014001243 682
Schmid-Hempel, P., 1998. Parasites in social insects. Princeton University Press, 683
Princeton, New Jersey. 684
Schmid-Hempel, R., Tognazzo, M., 2010. Molecular divergence defines two distinct 685
lineages of Crithidia bombi (Trypanosomatidae), parasites of bumblebees. J. 686
Eukaryot. Microbiol. 57, 337–45. doi:10.1111/j.1550-7408.2010.00480.x 687
Semaniuk, U., Feden’ko, K., Yurkevych, I.S., Storey, K.B., Simpson, S.J., Lushchak, 688
O., 2018. Within-diet variation in rates of macronutrient consumption and 689
reproduction does not accompany changes in lifespan in Drosophila 690
melanogaster. Entomol. Exp. Appl. 166, 74–80. doi:10.1111/eea.12643
691
Therneau, T.M., Grambsch, P.M., 2000. Modeling survival data: extending the cox 692
model, statistics for biology and health. New York: Springer 693
Tritschler, M., Vollmann, J.J., Yañez, O., Chejanovsky, N., Crailsheim, K., Neumann, 694
P., 2017. Protein nutrition governs within host race of honey bee pathogens. 695
Sci. Rep. 7, 14988. doi:10.1038/s41598-017-15358-w 696
Vaudo, A.D., Patch, H.M., Mortensen, D.A., Tooker, J.-F., Grozinger, C.M., 2016. 697
Macronutrient ratios in pollen shape bumble bee (Bombus impatiens) foraging 698
strategies and floral preferences. Proc Natl Acad Sci USA. 113, E4035–E4042. 699
doi:10.1073/pnas.1606101113 700
Van der Zee, R., Gómez-Moracho, T., Pisa, L., Sagastume, S., García-Palencia, P., 701
Maside, X., Bartolomé, C., Martín-Hernández, R., Higes, M., 2014. Virulence 702
and polar tube protein genetic diversity of Nosema ceranae (Microsporidia) field 703
isolates from Northern and Southern Europe in honeybees (Apis mellifera 704
iberiensis). Environ. Microbiol. Rep. 6, 401–413. doi:10.1111/1758-2229.12133
705
Venables, W.N., Ripley, B.D., 2002. Modern applied statistics with S. New York: 706
Springer 707
Wittner, M., Weiss, L., 1999. The Microsporidia and microsporidiosis. American 708
Society of Microbiology. doi:10.1128/9781555818227 709
Wolf, S., McMahon, D.P., Lim, K.S., Pull, C.D., Clark, S.J., Paxton, R.J., Osborne, 710
J.L., 2014. So near and yet so far: harmonic radar reveals reduced homing 711
ability of Nosema infected honeybees. PLoS One 9, e103989. 712
doi:10.1371/journal.pone.0103989 713
Zheng, H.Q., Lin, Z.G., Huang, S.K., Sohr, A., Wu, L., Chen, Y.P., 2014. Spore loads 714
may not be used alone as a direct indicator of the severity of Nosema ceranae 715
infection in honey bees Apis mellifera (Hymenoptera:Apidae). J. Econ. Entomol. 716 107, 2037–2044. doi:10.1603/ec13520 717 718 719 720
Tables and Table legends
721Table 1. Number of bumblebees exposed to N. ceranae, infected with parasite 722
(PCR positive), and showing spores in their gut. The percentage of bumblebees 723
infected relative to those exposed, and the percentage of bumblebees showing 724
spores in their gut relative to the number of PCR positive individuals are given into 725 brackets. 726 727 728 729 730
Diet Spore dosage Exposed Infected Showing spores Low-protein 150K 44 23 (52.27%) 7 (30.4%)
300K 45 31 (68.88%) 9 (29.03%) High-protein 150K 47 14 (29.78%) 4 (28.5%)
300K 46 16 (34.78%) 6 (37.5%)
Table 2. Cox Regression Model testing the effect of spore dosage on the 731
survival of bumblebees for each diet. 732
Diet Spore dosage Estimate S.E. z p High-protein 150K 0.2766 0.2115 1.308 0.191 300K 0.1440 0.2151 0.669 0.503 Low-protein 150K 1.2595 0.2792 4.511 < 0.001 300K 1.1021 0.2808 3.925 < 0.001 733 734 735 736 737 738
Figures and figure legends
739740
Figure 1. Parasite prevalence. (A) Agarose electrophoresis gel with negative (lanes
741
1, 2, 5 and 6) and positive (lanes 3, 4, 7-9) bumblebees to N. ceranae determined by
742
PCR. N: negative control of PCR; P: positive control of PCR; Ld: molecular size
743
marker (100 pb). Percentage of (B) bumblebees and (C) honey bees infected by N.
744
ceranae (PCR positive) for all diets and spore dosages. Bumblebee groups
745
contained between 44 and 50 individuals. Honey bee groups contained between 47 746
and 77 individuals (see details in supplementary Table 1). 747
749
Figure 2. Parasite loads. (A) N. ceranae spores observed in an infected bumblebee 750
(optical microscope, x 400). (B-E) Proportion of dead bumblebees at different days 751
post exposure that were positive to N. ceranae in a PCR (grey bars) and showed 752
spores in their gut (black bars), for both diets (high- and low-protein diets) and spore 753
dosages (150K and 300K). Each group contained between 44 and 50 individuals 754
(see details in supplementary Table 1). 755
756
Figure 3. Survival analyses. Survival probability of bumblebees fed the high-protein 757
diet (A) and the low-protein diet (B), for the different spore dosages (control, 150K 758
and 300K) across time. Infected (dashed lines) and non-infected (solid lines) 759
bumblebees are differentiated. Different letters associated to curves indicate 760
statistical differences in survival (p<0.05; post-hoc Tukey test after Cox-regression 761
model in a Kaplan Meier test curve, see supplementary Table 3). Each group 762
contained between 44 and 50 individuals (see details in supplementary Table 1). 763