HAL Id: hal-00806028
https://hal.archives-ouvertes.fr/hal-00806028
Submitted on 29 Mar 2013
HAL is a multi-disciplinary open access
archive for the deposit and dissemination of
sci-entific research documents, whether they are
pub-lished or not. The documents may come from
teaching and research institutions in France or
abroad, or from public or private research centers.
L’archive ouverte pluridisciplinaire HAL, est
destinée au dépôt et à la diffusion de documents
scientifiques de niveau recherche, publiés ou non,
émanant des établissements d’enseignement et de
recherche français ou étrangers, des laboratoires
publics ou privés.
FESEM and EIS Study of Sealed AA2024 T3 Anodized
in Sulfuric Acid Electrolytes: Influence of Tartaric Acid
Grégory Boisier, Nadine Pébère, Catherine Druez, Martine Villatte, Stéphane
Suel
To cite this version:
Grégory Boisier, Nadine Pébère, Catherine Druez, Martine Villatte, Stéphane Suel. FESEM and
EIS Study of Sealed AA2024 T3 Anodized in Sulfuric Acid Electrolytes: Influence of Tartaric Acid.
Journal of The Electrochemical Society, Electrochemical Society, 2008, vol. 155, pp.C521-C529.
�10.1149/1.2969277�. �hal-00806028�
O
pen
A
rchive
T
oulouse
A
rchive
O
uverte (
OATAO
)
OATAO is an open access repository that collects the work of Toulouse researchers and
makes it freely available over the web where possible.
This is an author-deposited version published in:
http://oatao.univ-toulouse.fr/
Eprints ID : 2407
To link to this article :
URL :
http://dx.doi.org/10.1149/1.2969277
To cite this version :
Boisier, Grégory and Pébère, Nadine and Druez, Catherine
and Villatte, Martine and Suel, Stéphane ( 2008)
FESEM and EIS Study of Sealed
AA2024 T3 Anodized in Sulfuric Acid Electrolytes: Influence of Tartaric Acid.
Journal of The Electrochemical Society (JES), vol. 155 (n° 11). C521-C529. ISSN
0013-4651
Any correspondence concerning this service should be sent to the repository
administrator:
staff-oatao@inp-toulouse.fr
FESEM and EIS Study of Sealed AA2024 T3 Anodized in
Sulfuric Acid Electrolytes: Influence of Tartaric Acid
Grégory Boisier,a,
*
Nadine Pébère,a,**
,zCatherine Druez,bMartine Villatte,band Stéphane Suelba
Institut Carnot CIRIMAT/UMR CNRS 5085, ENSIACET, 31077 Toulouse Cedex 04, France
b
EADS IW, 92152 Suresnes Cedex, France
The present study investigates the effect of tartaric acid on anodic film morphology and on corrosion resistance of hydrothermally sealed anodized AA2024. Anodizing treatment was performed in dilute sulfuric acid electrolyte with or without addition of tartaric acid. Hydrothermal sealing was carried out in boiling water for each anodized specimen. The morphology of the sealed anodic films was examined using field-emission scanning electron microscopy共FESEM兲. Electrochemical impedance spectroscopy 共EIS兲 was performed to assess sealing quality and corrosion resistance of the anodic films. It was shown that the sealing was more efficient in the case of anodic films formed in tartaric acid electrolyte mainly due to their lower porosity. It was also observed that the properties of the barrier layer were higher when sealing was performed on specimens anodized in the presence of tartaric acid. This suggests a specific role of the species on the barrier layer, which contributes to the enhancement of the performance in terms of corrosion resistance of the sealed anodic films. The present study clearly validates the beneficial role of tartaric acid in anodizing baths for the corrosion protection of AA2024.
关DOI: 10.1149/1.2969277兴
Chromic acid共CA兲 anodizing is widely used in the aeronautic industry to improve corrosion resistance of aluminum alloys.1The incorporation of Cr共VI兲 and Cr共III兲 into the oxide gives higher cor-rosion resistance than that produced by other anodizing processes. Since the beginning of the 1990s, the high toxicity associated with Cr共VI兲 has imposed restrictions on their use in industrial applica-tions. As a consequence, numerous attempts have been made to find less toxic alternatives, but with limited success.2,3During the last decade, attention to sulfuric acid anodizing and boric-sulfuric acid anodizing as alternatives to replace CA anodizing has increased.4-6 Anodizing with more dilute sulfuric acid共DSA兲 has been introduced to obtain thin anodic films共1–5 m兲 that increase fatigue resistance for specific structural materials.7Even though the fatigue resistance of the specimens anodized in DSA are increased, the corrosion re-sistance is lower than that of specimens anodized in CA. Alenia Aeronautica S.P.A. has proposed a new anodizing procedure involv-ing the addition of tartaric acid in dilute sulfuric acid electrolyte, called tartaric-sulfuric acid共TSA兲 anodizing.8Tartaric acid is some-times used as anodizing electrolyte for pure aluminum due to its ability to form anodic films with self-ordered pores.9,10 However, the use of TSA mixtures as anodizing electrolytes is poorly reported in the literature. Iglesias-Rubianes et al. have investigated the influ-ence of the addition of tartaric acid to sulfuric acid electrolyte on anodizing of sputtering-deposited Al–Cu alloy and AA2024-T3 alloy.11The authors showed that the addition of tartaric acid reduced by ⬃20% the steady-state current during film growth at constant voltage. Transmission electron microscopy 共TEM兲 observations showed that the presence of tartaric acid in the anodizing bath did not change the film morphology. Marzocchi et al. observed similar trends when investigating the anodizing of AA2024-T3 in a DSA 共0.46 M兲 solution and in an alternative sulfuric 共0.46 M兲 + tartaric acid共0.53 M兲 solution.12The authors concluded that the morphol-ogy of the anodic films formed in the two solutions was similar. Neither of the research groups attempted to investigate corrosion behavior.11,12 The role of tartaric acid in the anodizing bath still remains unclear.
The present study aimed for a better understanding of the effect of tartaric acid on the anodic film morphology and on the corrosion resistance of hydrothermally sealed anodized AA2024. Anodizing treatment was performed in DSA electrolyte with共TSA兲 or without 共DSA兲 addition of tartaric acid. Hydrothermal sealing was carried
out in boiling deionized共DI兲 water for each anodized specimen. The morphology of the unsealed and hydrothermally sealed anodic films was examined using field-emission scanning electron microscopy 共FESEM兲. FESEM was found to be a powerful tool to visualize changes in oxide film morphology after anodizing and sealing treatments.5,9,13-15 Electrochemical impedance spectroscopy 共EIS兲 was carried out to characterize the properties of the sealed and un-sealed anodic films. The sensitivity of EIS makes it a successful technique for assessing the sealing quality and corrosion resistance of the anodic films.5,12,14,16-21 The electrochemical parameters ob-tained from a fitting procedure of the impedance diagrams allowed the corrosion behavior difference of the two specimens to be shown and discussed. The electrochemical results were correlated with the FESEM observations.
Experimental
Materials and conditions.— The material used was a 2024 T3
aluminum alloy. The average chemical composition of the alloy is given in Table I. The specimens consisted of 125⫻ 80 ⫻ 1.6 mm plates machined from an AA2024 T3 rolled plate. Before anodizing, the samples were degreased共pH 9兲 for 15 min and then etched in an acid bath at 35°C for 10 min. Anodizing treatment was performed in a 40 g L−1共0.41 M兲 sulfuric acid 共H
2SO4兲 solution in the presence
or absence of 80 g L−1共0.53 M兲 tartaric acid 共C
4H6O6兲. Anodizing
experiments were carried out at a constant cell voltage of 14 V for 20 min reached after a 5 min voltage ramp. The operating tempera-ture was fixed at 37°C. Sealing was carried out in DI water 共 ⬎ 1500 k⍀ cm兲 at a temperature of ⬎96°C.
Scanning electron microscope (SEM) observations.— The
mor-phology of the anodic layers was investigated before and after seal-ing usseal-ing an LEO 435 VP SEM. For higher-resolution observations, a JEOL JSM 6700F FESEM was used. Sealed and unsealed anod-ized specimens were coated with a 1 nm thick layer of platinum to reduce the charging effect on the surface observed and thus to im-prove the image quality.
*Electrochemical Society Student Member.
**Electrochemical Society Active Member.
z
E-mail: Nadine.Pebere@ensiacet.fr
Table I. Chemical composition (in weight percent) of 2024 T3 aluminum alloy.
Cu Mg Mn Si Fe Zn Ti Al
Electrochemical experiments.— A three-electrode
electrochemi-cal cell was used. It contained a platinum grid as auxiliary electrode 共area of ⬃30 cm2兲, a saturated calomel reference electrode, and the
anodized AA2024 T3 specimens as working electrode共exposed area of 28 cm2兲. Electrochemical impedance measurements were carried
out using a Solartron 1287 electrochemical interface and a Solartron 1250 frequency response analyzer. The impedance diagrams were plotted under potentiostatic conditions at the corrosion potential over a frequency range of 65 kHz to 9.54 mHz with 6 points per decade. The electrochemical cell was kept at room temperature and open to air. The electrochemical properties of the unsealed anodic films were characterized after 2 h of immersion in a 0.5 M Na2SO4 solution. Sodium sulfate was chosen for its low corrosiveness to-ward aluminum and aluminum alloys. The corrosion behavior of sealed anodic films was investigated in a 0.5 M NaCl solution, at different exposure times reaching 35 days共840 h兲.
Results and Discussion
Characterization of the anodic films.— Figure 1 shows the SEM
micrographs of cross sections of unsealed AA2024 T3 specimens anodized in DSA共Fig. 1a兲 and in TSA electrolytes 共Fig. 1b兲. The anodic layer thickness was 2.9 and 2.4m for the anodic films formed in DSA and TSA, respectively. Figure 2 shows the FESEM images of the surface of unsealed anodic film formed in DSA共Fig. 2a兲 and TSA 共Fig. 2b兲. The porous oxide layer morphology appears differently. For the anodic film formed in DSA, the pores are not well defined and the distribution is irregular. Some pores seem to
have coalesced, because in some parts of the surface, the distance between the pore walls reaches about 30–40 nm. For the anodic films formed in TSA共Fig. 2b兲, the pores are well distributed and appear to be better organized. The average pore diameter varied between 10 and 15 nm. From the surface observations, the pore volume seems to be higher in the case of the anodic film formed in DSA. FESEM observations of film cross sections共Fig. 3兲 corrobo-rate these assumptions. The area between pore walls共in black兲 is larger for the anodic film formed in DSA than for the film formed in TSA. High tortuosity of the internal porous structure is observed for both types of anodic films, which is the characteristic morphology of films formed on 2XXX series aluminum alloys. The coarse interme-tallic particles and the presence of alloying elements in the alumi-(a)
(b)
Figure 1. SEM observations of cross sections of unsealed anodic films
formed in共a兲 DSA and 共b兲 TSA solutions.
(a)
(b)
Figure 2. FESEM observations of the surface of unsealed anodic films
num matrix significantly modify the anodic film morphology.22 Par-ticularly, the Cu present in solid solution oxidizes and leads to the generation of oxygen bubbles during film growth, inducing film dis-ruptions. The changing directions of pores propagation contribute to the three-dimensional共3D兲 aspect of the pore morphology.23-28The morphology encountered from the metal-oxide interface all the way up to the upper part of the oxides was the same共not shown兲.
FESEM observations revealed that the presence of tartaric acid decreased the pore volume of the anodic film. Tartaric acid is known to be a weak acid, not very aggressive toward the metal and its oxide, which requires high temperature and voltage共⬎150 V兲 to produce a dissolving action similar to that of sulfuric acid.9,10,29-31
As a consequence, it is obvious that tartaric acid cannot contribute to the formation of the anodic film at the voltage applied共14 V兲 and that sulfuric acid is the main reservoir of mobile protons involved in the growth of the oxide layer. Because all the anodizing parameters were the same for both systems, the decrease in pore volume ob-served for the anodic film formed in TSA may be attributed to a decrease of the dissolution rate occurring at the pore base during pore formation. It can be assumed that tartaric acid influences the field-assisted dissolution process during pore initiation as proposed by Iglesias-Rubianes et al., limiting the dissolution of the outwardly mobile Al3+species present in the pore precursor sites.11
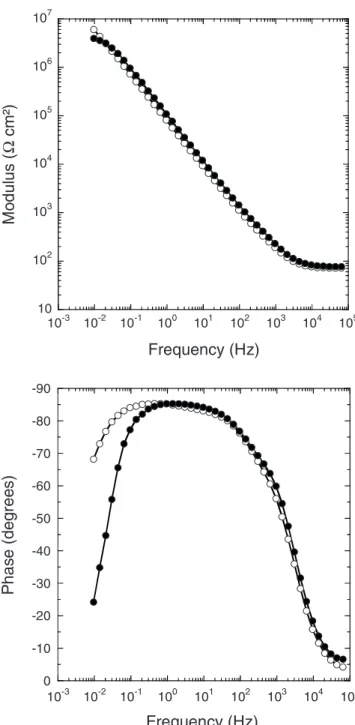
The electrochemical behavior of both unsealed anodic layers was investigated by impedance spectroscopy. The diagrams obtained af-ter 2 h of immersion in a 0.5 M Na2SO4 solution for the anodic films formed in DSA and TSA are presented in Fig. 4. The spectra are relatively similar, except in the low-frequency range, and present (a)
(b)
Figure 3. FESEM observations of cross sections of unsealed anodic films
formed in共a兲 DSA and 共b兲 TSA solutions 共zone in the bulk of the oxide layer兲. 10 102 103 104 105 106 107 10-3 10-2 10-1 100 101 102 103 104 105
Mo
du
lu
s
(Ω
cm
²)
Frequency (Hz)
-90 -80 -70 -60 -50 -40 -30 -20 -10 0 10-3 10-2 10-1 100 101 102 103 104 105P
has
e
(d
egr
e
e
s
)
Frequency (Hz)
Figure 4. Bode plots of the unsealed anodic films formed in共䊊兲 DSA and in
two time constants that are not well separated. The time constant in the high-frequency part of the diagram共characteristic frequency at ⬃103Hz兲 is assumed to represent the response of the pore walls,
and the low-frequency part is attributed to the barrier layer.16-18,20 An equivalent circuit containing two time constants 共Fig. 5兲 was needed to fit the data as proposed by Hoar and Wood.16For the pore wall, constant phase element共CPE兲 was introduced instead of ca-pacitance共with ␣ close to 0.90兲.32For the barrier layer,␣ param-eters were close to 1共0.94–0.99兲, and thus, a capacitance, Cb, was used in the circuit. For the sake of simplicity, only the parameters associated to the barrier layer are reported in Table II. The results show a higher Rbvalue for the anodic film formed in DSA than for the anodic film formed in TSA. This shows that the barrier layer is affected by the presence of tartaric acid in the anodizing bath. For both unsealed anodic films, the barrier layer thickness eb can be
calculated with the following expression that defines capacitance
Cb= 0rS
eb
关1兴 with the dielectric permittivity of vacuum 0= 8.854
⫻ 10−14F cm−1, the relative dielectric constant of alumina r= 10,
and the exposed surface area S. Calculations of ebfrom Eq. 1 gave:
21 and 25 nm for the anodic films formed in DSA and TSA,
respec-tively, which is in good agreement with the values reported by Mar-zocchi et al.关17 nm 共DSA兲 and 23 nm 共TSA兲 measured by TEM兴.12 The higher Rb value of the anodic film formed in DSA cannot be explained by a greater thickness of the barrier layer. This disagree-ment may be due to the dielectric properties of the barrier layer, which are affected by the presence共or not兲 of tartaric acid in the anodizing electrolyte. Further investigations to determine the action of tartaric acid on the barrier layer would be necessary. The results show that the porous structure of the anodic films differs with the anodizing electrolyte; thus, the sealing of the pores in boiling water may give different results in terms of pore-filling quality and, there-fore, in terms of corrosion resistance.
Characterization of the hydrothermal sealing mechanism.—
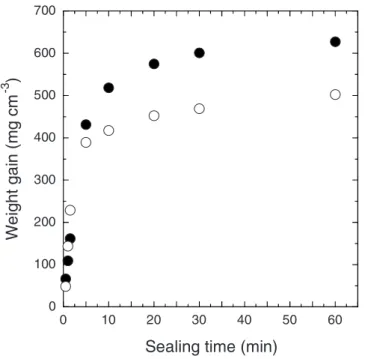
Figure 6 presents the variation of the weight gain with the sealing time in boiling DI water for the anodic films formed in DSA and TSA. The weight gain is expressed vs anodic film volume by taking into account the initial thickness of the anodic films. In agreement with the literature, the curves present the usual parabolic shape and can be divided into two domains.33-37 During the initial step 共0–90 s兲, a high rate of sealing of ⬃150 mg cm−3min−1 for the
anodic film formed in DSA and a lower rate of sealing of ⬃100 mg cm−3min−1for the anodic film formed in TSA was
ob-served. Then, it slowed down to ⬃1 mg cm−3min−1 between 20
and 60 min of sealing for both anodic films. These results highlight the significant transformation of the porous structure occurring in the early stages of the sealing process for both types of anodic film. The significant difference in sealing rates observed at the beginning of the reaction corroborates the higher porosity of the anodic film formed in DSA previously observed by FESEM. Indeed, the higher the available surface area 共pore volume兲 is, the faster the initial water uptake and the greater the weight gain is. Furthermore, after a longer sealing time 共⬎20 min兲, a difference in weight gain was observed between the anodic films. For 60 min of sealing, the weight gain reached 630 and 500 mg cm−3 for the anodic films
formed in TSA and DSA, respectively. This shows that the precipi-tation of aluminum hydroxide was greater in the anodic film formed in TSA, suggesting a more complete sealing of the porous structure than for the anodic films formed in DSA.
FESEM observations of the surface of anodic films formed in TSA after different sealing times corroborated the variation of
Table II. Fitted parameter values associated to the barrier layer and corresponding thickness, for the unsealed anodic films formed in DSA and in TSA solutions (obtained after 2 h of im-mersion in 0.5 M Na2SO4). Rb 共M⍀ cm2兲 Cb 共F cm−2兲 共nm兲eb DSA 22 0.41 21 TSA 6 0.35 25
Figure 5. Equivalent circuit used to model the electrochemical behavior of
unsealed anodic films共Re: electrolyte resistance, Re⬘: resistance of the
solu-tion in the pores, Rb: barrier layer resistance, Cb: capacitance associated to
the barrier layer, and Qpwand␣pw: CPE parameters associated to the pore wall兲. 0 100 200 300 400 500 600 700 0 10 20 30 40 50 60
W
e
ig
ht
ga
in
(m
g
c
m
-3)
Sealing time (min)
Figure 6. Variation of weight gain with sealing time in boiling DI water for
weight gain共Fig. 7兲. After 30 s of reaction 共Fig. 7a兲, a reduction of pore diameter is clearly seen since the upper part of the pore walls has swollen. After 60 s of sealing共Fig. 7b兲, the formation of a very short “plug” in the pore mouths and the growth of “petal”-shaped crystals on the surface are clearly observed. Then, 90 s of sealing 共Fig. 7c兲 induce the quasi-plugging of the pore mouths. For the longest sealing times 共Fig. 7d兲, a dense layer of these crystals is present on the surface and only grows slightly after 5 min of reac-tion. Similar modifications were observed after short and long seal-ing times of the anodic films formed in DSA共not shown兲. After long sealing times, both anodic film surfaces presented a dense layer of acicular crystals. The observation of pore sealing is in good agree-ment with the literature. Initial dissolution of the pore walls is fol-lowed by diffusion and precipitation of aluminum hydroxide on the pore mouths leading to the formation of a plug in the upper part of the pore, which greatly restricts the transfer of water molecules down the entire length of the pores.13,16,33-39The formation of petal-shaped crystals on the surface, so-called smudge, is the result of aluminum salt precipitation.2,14,15,36,37,39According to Wefers, the chemical nature of the crystals seems to be close to pseudoboehmite or boehmite and their morphology reflects the chemical and thermal conditions prevailing during the sealing treatment.36,37
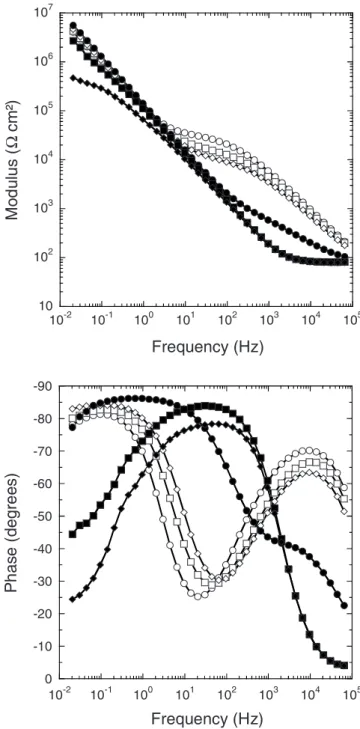
The various transformations of the porous structure occurring during the sealing process were evaluated by impedance spectros-copy for both types of anodic film. First, the results obtained with the anodic films formed in TSA are presented and then the results obtained for films formed in DSA. Figure 8 shows the impedance diagrams obtained after 2 h of immersion in a 0.5 M NaCl solution for the anodic films formed in TSA and for different sealing times in boiling DI water. They are characterized by two time constants. Several studies have shown that the physical transformations in-volved during sealing are reflected in the high- and medium-frequency ranges of the impedance diagrams by the appearance of a new time constant, which characterizes the sealed porous layer prop-erties, while the barrier layer properties are characterized in the low-frequency range.5,12,14,16-21The impedance data were analyzed by different equivalent circuits.16,17,20The circuit that gave the best
fits is presented in Fig. 9. It is relatively similar to the one proposed by González et al. with the difference that the intermediate layer and pore wall resistances were respectively too low and too high, and have been deleted because they do not contribute to improve the fitting quality of our experimental data.20It can be noted that for 30 and 90 s of sealing, the impedance diagrams are typical of unsealed 共partially sealed兲 materials, and thus, the electrochemical parameters are extracted only from 2 min of sealing共Table III兲. The resistance
Rp, which gives an indication of the sealing quality, increases with the sealing time. The longer the sealing time is, the better the sealing quality is. At least 5 min of sealing are required to obtain sufficient filling of the pores, which corresponds to the transition between the high and low rates of weight gain observed in Fig. 6. However, Rp
increased progressively with the sealing time while the weight gain
Figure 7. FESEM observations of the surface of anodic films formed in TSA
solution after different sealing times in boiling water:共a兲 30 s, 共b兲 60 s, 共c兲 90 s, and共d兲 5 min. 10 102 103 104 105 106 107 10-2 10-1 100 101 102 103 104 105
Mo
d
u
lu
s
(Ω
cm²
)
Frequency (Hz)
-90 -80 -70 -60 -50 -40 -30 -20 -10 0 10-2 10-1 100 101 102 103 104 105Ph
a
s
e
(deg
re
e
s
)
Frequency (Hz)
Figure 8. Bode plots of anodic films formed in TSA solution sealed after
different times in boiling DI water:共⽧兲 30 s, 共䊏兲 90 s, 共쎲兲 2 min, 共〫兲 5 min,共䊐兲 20 min, and 共䊊兲 60 min 共obtained after 2 h of immersion in 0.5 M NaCl兲.
slowed down and stabilized. Thus, the decrease of the residual po-rosity by successive precipitation of aluminum hydroxide has a sig-nificant influence on the resistivity of the porous layer.␣pvalues are low, independently of the sealing time. To analyze this parameter more accurately, it would be necessary to consider a transmission line model to take into account the porous structure.40From Table III, it can be seen that Rb, Qb, and␣bremain quasi-constant,
what-ever the sealing time.
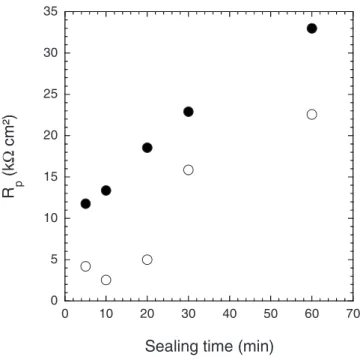
The impedance diagrams obtained after different sealing times 共5, 10, 20, and 30 min兲 for the anodic films formed in DSA 共not shown兲 have the same shape as those obtained for the films formed in TSA. Figure 10 compares the Rp values for both systems. It appears that for the anodic films formed in TSA, the variation is linear; whereas for the films formed in DSA it is not, and the Rp
values always remain lower than those obtained with TSA. For the shortest sealing time, Rp was ⬍5 k⍀ cm2, which reveal the low
level of pore filling. Sealing times of ⬎30 min are necessary to obtain acceptable sealing of the porous structure. FESEM observa-tions of cross secobserva-tions of sealed films formed in DSA and TSA共Fig. 11兲 were performed to observe possible morphology differences of the sealed porous layer, which could explain the differences in Rp
values. The micrographs reveal differences only in the zone adjacent
to the base metal. The sealed layer of the anodic films formed in TSA共Fig. 11b兲 appears as a dense block, where the initial porosity and pore structure are no longer distinguishable. The sealed layer of the anodic films formed in DSA共Fig. 11a兲 appear to be less dense, in parts. Fine acicular particles coming from aluminum hydroxide precipitation are clearly observable, surrounded by a small propor-tion of dark areas, which can be assimilated to residual porosity. These observations show that the lower part of the porous structure of the anodic film formed in DSA was not perfectly sealed after 30 min of reaction, corroborating the trends deduced from electro-chemical impedance results.
The impedance results stress that pore sealing differs, depending on the initial anodic film. A better sealing efficiency共higher Rp兲 was
obtained for the anodic films formed in the presence of tartaric acid. Then, to investigate the influence of sealing quality on the corrosion of sealed anodized AA2024 specimens, the corrosion resistance of the sealed anodic films formed in DSA and TSA was investigated by plotting the impedance diagrams vs exposure time共from 2 to 840 h兲 in a 0.5 M NaCl solution.
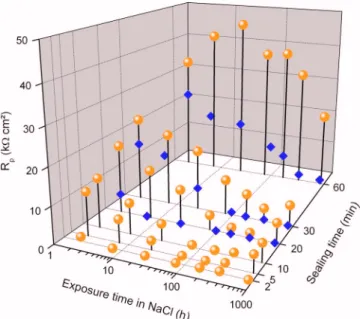
Characterization of corrosion resistance of sealed specimens.—
Figure 12 shows a 3D plot of the fitted Rpvalues for the anodic films
formed in TSA and for different sealing times as a function of ex-posure time in a 0.5 M NaCl solution. The results obtained for the specimens anodized in DSA and sealed in boiling DI water for 20, 30, and 60 min are reported for comparison. For the anodic films formed in TSA, Rpdecreases as the exposure time in the aggressive
solution increases for each sealing time, except for the specimen
Table III. Fitted parameter values for the hydrothermally sealed anodic films formed in TSA solution (obtained after 2 h of immersion in 0.5 M NaCl). Sealing time 共min兲 共⍀ cmRe 2兲 Rp 共k⍀ cm2兲 Qp 共⍀−1cm−2s␣兲 ␣ p Rb 共M⍀ cm2兲 Qb 共⍀−1cm−2s␣兲 ␣ b Cpw 共nF cm−2兲 2 78 1.1 16.74 0.52 ⬃34 1.21 0.96 28.5 5 81 11.8 0.83 0.63 ⬃133 1.49 0.95 11.7 10 85 13.4 0.92 0.60 ⬃15 1.56 0.94 12.4 20 84 18.6 0.76 0.60 ⬃56 1.56 0.94 11.5 30 81 22.9 0.56 0.62 ⬃48 1.55 0.94 10.6 60 79 33.0 0.32 0.67 ⬃38 1.62 0.94 9.3
Figure 9. Equivalent circuit used to model the electrochemical behavior of
sealed anodic films共Re: electrolyte resistance, Rp: porous layer resistance, Qp and␣p: CPE parameters associated to the porous layer, Rb: barrier layer
resistance, Qband␣b: CPE parameters associated to the barrier layer, and
Cpw: capacitance associated to the pore wall兲.
0 5 10 15 20 25 30 35 0 10 20 30 40 50 60 70
R
p(k
Ω
cm
²)
Sealing time (min)
Figure 10. Rpvalues vs sealing time for the anodic films formed in共䊊兲 DSA
sealed for 60 min. The decrease of Rpvalues during the first 336 h
of immersion indicates penetration of the electrolyte and an en-hancement of the ionic conduction along the pores by degradation of the sealed porous layer.18,19The Rpvalue of the specimen sealed for
60 min remains high and constant during the first 336 h of immer-sion, which indicates that 60 min of sealing induces a strong densi-fication of the porous layer preventing electrolyte penetration during a longer time than for the other specimens. With specimens sealed for 5, 10, 20, and 30 min, a slight increase of Rpcan be seen after
840 h of immersion. This is attributed to a self-sealing mechanism occurring after a long contact time with the water molecules at room temperature. For the anodic films formed in DSA, the variation of
Rpis similar but with a sharper decrease. After only 6, 96, and 336 h of immersion in the aggressive solution for the specimens sealed for 20, 30, and 60 min, respectively, the time constant associated to the sealed porous layer completely vanishes. Moreover, no self-sealing phenomenon is observed for longer immersion times. The fast de-crease of Rpstresses the fact that the sealed layers of the anodic
films formed in DSA are less compact than those of anodic films formed in TSA.
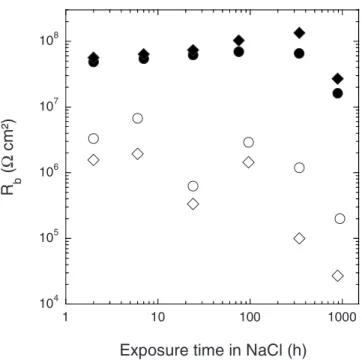
Figure 13 presents the variation of the fitted Rbvalues as a func-tion of exposure time in the 0.5 M NaCl solufunc-tion for 20 and 30 min sealed anodic films formed in TSA and DSA. The Rb values
ob-tained for the anodic films formed in TSA are high and remain constant for the first 336 h of immersion, indicating that the barrier layer is unattacked. This is consistent with the fact that the porous layer is homogeneously sealed along the entire length of the pores, preventing the degradation of the barrier layer. In contrast, the Rb values obtained for the anodic films formed in DSA remain rela-tively constant only during the first 96 h of immersion and then decrease sharply, indicating a significant degradation of the barrier layer due to the low protection afforded by the sealed porous layer. Furthermore, Fig. 13 shows that after a short immersion time in the aggressive solution, the Rb values obtained for the sealed films
formed in DSA were lower by about one order of magnitude com-pared to sealed films formed in TSA. These differences can be at-tributed to a modification of the barrier layer by sealing when the alloy is anodized in the presence of tartaric acid. Thus, the corrosion protection afforded by sealing on anodic films formed in DSA does not last as long as that gained with anodic films formed in TSA.
Discussion.— The present study highlights that the corrosion
re-sistance of sealed specimens was significantly enhanced when the alloy was anodized in the electrolyte containing tartaric acid. Com-parison of the EIS measurements showed differences between the anodic films concerning both the sealing quality and the barrier layer properties. A drastic fall of Rp and a progressive decrease of Rb
during immersion in the NaCl solution was observed for the sealed anodic films formed in DSA, accounting for surface degradation, whereas the anodic films formed in TSA showed higher Rpand Rb values during the whole immersion time, indicating a higher corro-sion resistance. These results are the consequence of the more effi-cient sealing of the porous structure of the anodic films formed with tartaric acid.
(a)
(b)
Figure 11. FESEM observations of cross sections of anodic films formed in
共a兲 DSA and 共b兲 TSA solutions, after 30 min of sealing in boiling DI water 共zone adjacent to the base metal兲.
Figure 12.共Color online兲 Rpvalues for the anodic films formed in共⽧兲 DSA
and共gray circle兲 TSA solutions vs sealing times and vs exposure time in a 0.5 M NaCl solution.
FESEM image共Fig. 2 and 3兲 clearly show a lower porosity of the anodic films formed in TSA by comparison to the anodic films formed in DSA. Moreover, the variation of weight gain during seal-ing in boilseal-ing DI water revealed that the initial rate is lower for the anodic films formed in TSA, which is in agreement with their lower porosity. It is well known that the sealing reaction begins in the external part of the pore by the formation of a plug, decreasing water molecule transfer.13,16,33-39 Radial displacement of the pore walls toward the pore center continues due to crystallization of alu-minum hydroxide. It is obvious that the lower the initial pore diam-eter is, the faster the pores will be filled to reach complete closing. Consequently, the lower pore diameter observed for the anodic film formed in TSA contributes to better pore filling compared to the film formed in DSA.
In addition, a difference in chemical composition of the anodic films should be taken into account. Although the two anodic films formed in DSA and TSA may have a similar proportion of sulfate ions incorporated in their porous structure, the main difference arises from the use of tartaric acid in the anodizing bath, which may also induce incorporation of tartarate anions into the porous structure.33-37,41Some of the incorporated species are released via dissolution of the pore walls during the initial step of the sealing process.13,33-37,39The presence of such species in the electrolyte can influence the rate of the sealing reaction.33-37In the present study, the hydrolysis of aluminum salt共formed with tartarate anions兲 by reaction with water may account for the more efficient sealing ob-tained with the anodic film formed in TSA. It can be assumed that chemical conditions inside the pores, such as pH, are more favorable for aluminum hydroxide precipitation when tartarate salts are hydro-lyzed in addition to sulfate salts. Thus, the combination of the chemical action of tartaric acid during sealing and the lower porosity of the anodic film may contribute to the better sealing of the pores of the anodic film formed in TSA.
From Fig. 13, differences in terms of barrier layer resistance can be seen. Tartaric acid may be involved in barrier layer modification occurring on sealing of the anodic films formed in TSA, but its specific action remains unclear and requires further investigations. However, the enhancement of barrier layer resistance must be taken into account to explain the better corrosion resistance observed for
the sealed films formed in TSA because a porous layer correctly sealed is not sufficient to ensure high performance in terms of cor-rosion resistance.
Conclusion
The sealing quality and the corrosion resistance of AA2024 T3 anodized in sulfuric acid with or without addition of tartaric acid were investigated by FESEM and EIS techniques. The following points emerged:
1. Anodizing of AA2024 T3 in the presence of tartaric acid led to the formation of anodic films with lower porosity than those obtained in DSA.
2. Characterization of hydrothermal sealing by EIS measure-ments showed that the sealing quality was better for the anodic films formed in TSA than in DSA in agreement with the lower pore vol-ume of the anodic films formed in TSA.
3. The corrosion behavior evaluated by EIS measurements re-vealed that the sealed films formed in TSA are significantly more resistant to corrosion than the sealed films formed in DSA. This enhancement of corrosion resistance is mainly associated with the higher compactness of the porous layer and higher resistance of the barrier layer obtained after hydrothermal sealing of specimens an-odized in TSA.
This work showed the beneficial effect of tartaric acid addition in sulfuric acid baths for the improvement of the corrosion resistance of the anodic films, which was clearly seen after hydrothermal seal-ing. In addition, this study pointed out the complementarity of FESEM observations and EIS measurements to obtain a better knowledge of anodic film behavior.
Acknowledgments
This work was carried out with the technical and financial sup-port of the Délégation Générale pour l’Armement and the European Aeronautic Defence and Space Company. In addition, we thank D. Oquab and Y. Thebault for time on the JEOL JSM 6700F FESEM instruments.
Centre National de la Recherche Scientifique assisted in meeting the publication costs of this article.
References
1. E. Eichinger, J. Osborne, and T. Van Cleave, Met. Finish., 95, 36共1997兲. 2. V. Moutarlier, M. P. Gigandet, L. Ricq, and J. Pagetti, Appl. Surf. Sci., 183, 1
共2001兲.
3. V. Moutarlier, M. P. Gigandet, J. Pagetti, and B. Normand, Surf. Coat. Technol.,
161, 267共2002兲.
4. G. E. Thompson, L. Zhang, C. J. E. Smith, and P. Skeldon, Corrosion (Houston),
55, 1052共1999兲.
5. L. Domingues, J. C. S. Fernandes, M. Da Cunha Belo, M. G. S. Ferreira, and L. Guerra-Rosa, Corros. Sci., 45, 149共2003兲.
6. G. W. Critchlow, K. A. Yendall, D. Bahrani, A. Quinn, and F. Andrews, Int. J.
Adhes. Adhes., 26, 419共2006兲.
7. K. J. Kallenborn and J. R. Emmons, NASA Conf. Publ., 3298, 267共1995兲. 8. A. Dattilo, S. Tamiro, and C. Romero, European Pat. EP1 233 084 A2共2002兲. 9. S. Ono, M. Saito, and H. Asoh, Electrochim. Acta, 51, 827共2005兲.
10. G. Gorokh, A. Mozalev, D. Solovei, V. Khatko, E. Llobet, and X. Correig,
Elec-trochim. Acta, 52, 1771共2006兲.
11. L. Iglesias-Rubianes, S. J. Garcia-Vergara, P. Skeldon, G. E. Thompson, J. Fergu-son, and M. Beneke, Electrochim. Acta, 52, 7148共2007兲.
12. V. Marzocchi, L. Iglesias-Rubianes, G. E. Thompson, and F. Bellucci, Corrosion
Reviews, 25, 461共2007兲.
13. J. A. Gonzalez, V. Lopez, E. Otero, and A. Bautista, J. Electrochem. Soc., 147, 984 共2000兲.
14. V. Lopez, M. J. Bartolomé, E. Escudero, E. Otero, and J. A. González, J.
Electro-chem. Soc., 153, B75共2006兲.
15. M. J. Bartolomé, V. Lopez, E. Escudero, and J. A. González, Revista de
Meta-lurgia, 43, 209共2007兲.
16. T. P. Hoar and G. C. Wood, Electrochim. Acta, 7, 333共1962兲.
17. J. Hitzig, K. Jüttner, W. J. Lorenz, and W. Paatsch, J. Electrochem. Soc., 133, 887 共1986兲.
18. F. Mansfeld and M. W. Kendig, J. Electrochem. Soc., 135, 828共1988兲. 19. N. Celati, M. C. Sainte Catherine, M. Keddam, and H. Takenouti, Mater. Sci.
Forum, 192, 335共1995兲.
20. J. A. González, V. Lopez, A. Bautista, and E. Otero, J. Appl. Electrochem., 29, 229 共1999兲. 104 105 106 107 108 1 10 100 1000
R
b(Ω
cm
²)
Exposure time in NaCl (h)
Figure 13. Rbvalues for the anodic films formed in DSA after two different
sealing times共〫兲 20 min and 共䊊兲 30 min and for the anodic films formed in TSA after two different sealing times共⽧兲 20 min and 共쎲兲 30 min vs expo-sure time in a 0.5 M NaCl solution.
21. J. J. Suay, E. Giménez, T. Rodríguez, K. Habbib, and J. J. Saura, Corros. Sci., 45, 611共2003兲.
22. M. Curioni, M. Saenz de Miera, P. Skeldon, G. E. Thompson, and J. Ferguson, J.
Electrochem. Soc., 155, C387共2008兲.
23. G. E. Thompson, Thin Solid Films, 297, 192共1997兲.
24. Y. Liu, P. Skeldon, G. E. Thompson, H. Habazaki, and K. Shimizu, Corros. Sci.,
44, 1133共2002兲.
25. T. Dimogerontakis, L. Kompotiatis, and I. Kaplanoglou, Corros. Sci., 40, 1939 共1998兲.
26. X. Zhou, G. E. Thompson, H. Habazaki, M. A. Paez, K. Shimizu, P. Skeldon, and G. C. Wood, J. Electrochem. Soc., 147, 1747共2000兲.
27. M. A. Paez, O. Bustos, G. E. Thompson, P. Skeldon, K. Shimizu, and G. C. Wood,
J. Electrochem. Soc., 147, 1015共2000兲.
28. S. J. Garcia-Vergara, K. El Khazmi, P. Skeldon, and G. E. Thompson, Corros. Sci.,
48, 2937共2006兲.
29. G. A. Dorsey, J. Electrochem. Soc., 113, 169共1966兲.
30. G. A. Dorsey, J. Electrochem. Soc., 113, 172共1966兲. 31. G. A. Dorsey, J. Electrochem. Soc., 113, 284共1966兲.
32. G. J. Brug, A. L. G. Van Den Eeden, M. Sluyters-Rehbach, and J. H. Sluyters, J.
Electroanal. Chem. Interfacial Electrochem., 176, 275共1984兲.
33. R. C. Spooner and W. J. Forsyth, Plating, 55, 336共1968兲. 34. R. C. Spooner and W. J. Forsyth, Plating, 55, 341共1968兲. 35. R. C. Spooner and W. J. Forsyth, Plating, 55, 463共1968兲. 36. K. Wefers, Aluminium, 49, 553共1973兲.
37. K. Wefers, Aluminium, 49, 622共1973兲.
38. L. Hao and B. R. Cheng, Met. Finish., 98, 8共2000兲.
39. M. J. Bartolomé, V. Lopez, E. Escudero, G. Caruana, and J. A. Gonzalez, Surf.
Coat. Technol., 200, 4530共2006兲.
40. A. Lasia, J. Electroanal. Chem., 428, 155共1997兲.
41. K. Shimizu, H. Habazaki, P. Skeldon, G. E. Thompson, and G. C. Wood,